Create a dashboard in Mammoth from your data
Mammoth dashboards are built through a conversation with AI. You pick your data (or a template, a dashboard you already have, or a report you already send), describe what you need, and the AI builds a live, interactive dashboard from your data's structure. Start from Dashboards in the left sidebar, then Create. You need edit rights in a project to create a dashboard there.
Before you start
You can start from your data, a template or an existing report.
- Your data needs a View: the prepared version of your data in a Mammoth project. If you don't have one yet, set one up in your project first, or upload a file from the empty library (below).
- Start blank and templates don't need data up front. A template comes with sample data. You must connect your own data (Use my data) before you can publish it. See Start from a template.
Dashboards can only use data from projects you can access. You can't link Views from different workspaces.
Build your first dashboard from the empty library
The first time you open Dashboards with nothing in it, Mammoth checks what you have. It shows one of these screens instead of an empty list.
| Screen | When you see it | What you can do |
|---|---|---|
| "Your first dashboard starts with your data" | You have no data yet | Drop a file on "Drop the file you report from" ("CSV, Excel, JSON, PDF and more"). Or use Choose a file, Connect an app or Paste a link. "Saves to" and the project name show where the data goes; click Change to pick another project. |
| "Reading" and your file's name | Your file is uploading | Watch the steps Uploading, Reading rows and columns and Suggesting dashboards. You can leave the page: your file keeps loading, and the suggestions wait for you. Large files can take a few minutes. |
| "One more step for" and your file's name | The file landed but needs a look before a dashboard can use it | Click Open in Data to fix it in the data editor. |
| "Here's what we can build from" and your file's name | Your data is ready | Pick a Format (Dashboard, Slides or Doc). Then build a suggested idea or type your own description. You can also choose Use other data, Browse all data…, Add more data or Start from a template. |
| "No dashboards here yet" | You can open this workspace's projects but not build in them | Click Open Shared with you to see dashboards people have shared with you. |
Under the drop zone, Or look around first shows finished dashboards on sample data that you can open and click around. See all templates opens the template gallery.
If the upload fails, you see one of these messages:
- "We can't read .key files yet. Try CSV, Excel, JSON or PDF." (with your file's extension)
- "That upload didn't go through. Check your connection and try again." Click Try another file to start again.
Uploads count toward your workspace storage. See Limits and quotas.
Choose where to start on the Create page
- Click Dashboards in the left sidebar.
- Click Create.
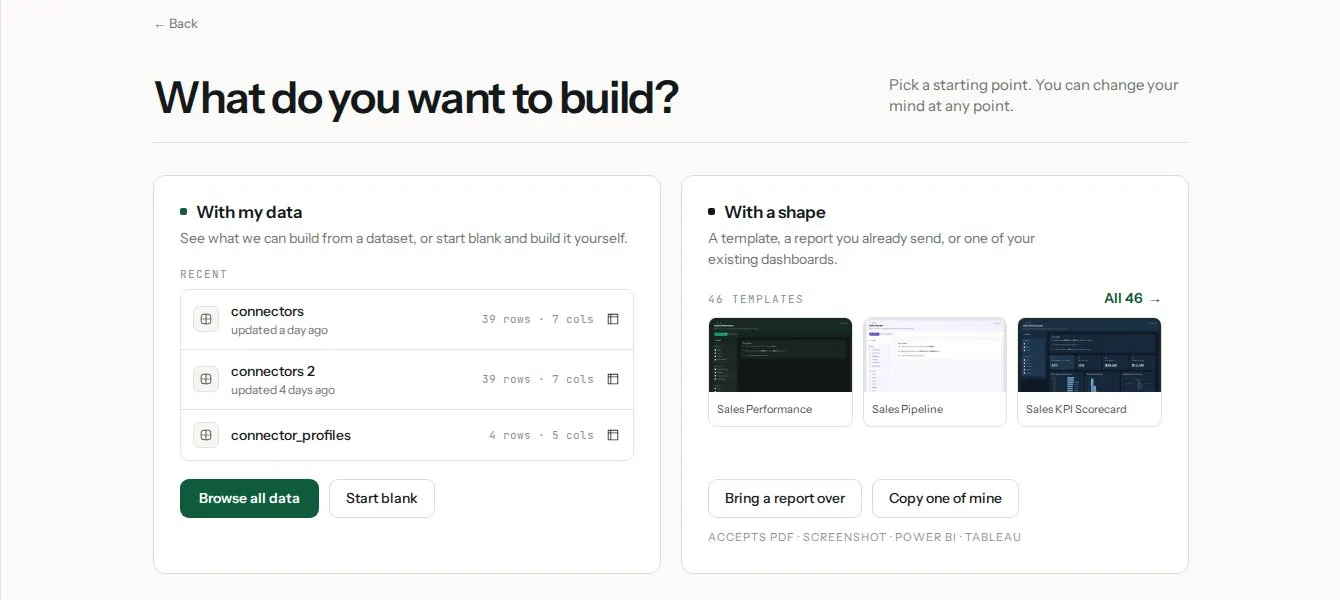
- On What do you want to build?, pick a lane.
With my data shows your recent Views, with their row and column counts. Choose one, or click Browse all data to find any View you can access. You can also click Start blank to build from an empty canvas.
With a shape starts from something that already exists:
| Choice | What it does |
|---|---|
| A template | Peek at one, or click Browse all templates. See Start from a template. |
| Bring a report over | Rebuilds a report you already have from a Power BI or Tableau workbook, or a PDF, screenshot, Markdown or plain-text file. See Import an existing report. |
| Copy one of mine | Rebuilds a dashboard you already have on other data. See Copy one of your dashboards onto other data. |
Preview your data before you build a dashboard on it
To check a View is the right one, hover it in the With my data list and click the preview icon (Preview this data). A window shows the dataset's name, its shape, and up to the first 25 rows with each column's type. The footer reads, for example, "Showing the first 25 rows of 12 columns".
- Click Use this data to continue with it, or Close to pick another.
- An empty dataset shows "This dataset has no rows yet."
- If the preview can't load, you see "Could not load a preview of this data. It may still be processing — try again in a moment."
- Use this data stays disabled while the preview loads or after an error.
Choose a format: dashboard, slides, doc, Q&A or Explore
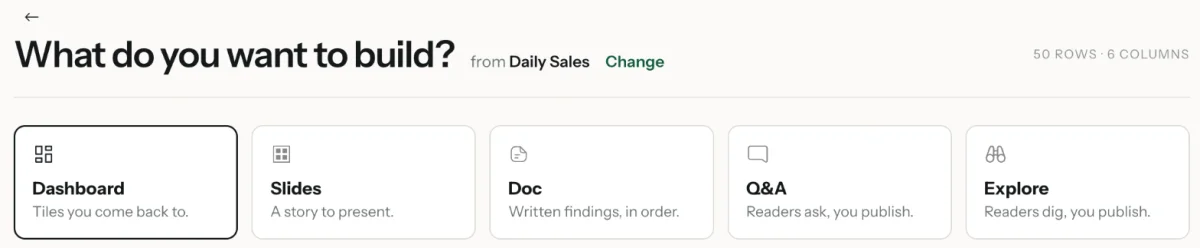
After you choose data, pick a format card:
| Format | What you get |
|---|---|
| Dashboard | Tiles you come back to. |
| Slides | A story to present. |
| Doc | Written findings, in order. |
| Q&A | A page where readers ask questions and the answers become cards. |
| Explore | A page your readers dig through. They click cards for each column to filter the rows underneath, and download what they filtered. |
The header shows the View you're building from (for example "from Sales") and its row and column counts. Click Change to pick another View.
Q&A and Explore don't suggest ideas.
- Q&A offers Open a notebook →. Readers ask their own questions of the data, and each answer comes back as a chart or a number.
- Explore offers Open an Explore page →, which sets up the first column cards from your columns.
See Explore and Q&A pages and Docs and slides.
Describe the dashboard you want to the AI
For Dashboard, Doc and Slides, the AI suggests ideas based on your columns, each with a short description.
- Select an idea to see a Roughly this sketch of the layout.
- Click Build this dashboard (Build this doc or Build these slides for the other formats).
Or type your own description in the prompt box, …or describe the dashboard you want. If the AI can't read your columns, it asks you to describe what you want instead.
Click Add context under the prompt to attach saved context: definitions or goals, so answers use your terms. See Give the AI context.
Your description can be as specific or as general as you like:
- General: "Give me a sales performance overview"
- Specific: "Show me monthly revenue as a line chart, top 10 products by units sold as a bar chart, and a KPI card with total transactions this quarter"
The AI uses your column types to choose charts:
| Column type | How the AI uses it |
|---|---|
| Date | Time-series charts |
| Categorical | Chart dimensions or filters |
| Numeric | Metrics, such as sums, averages or counts |
When you build, a progress screen shows the steps Analyze your data, Design the layout, Build the charts and Finalize the pages. The wording changes for docs, slides and Q&A. Then the editor opens.
A template lets you preview the layout on sample data. Samples can't be published until you connect your own data. How many dashboards you can publish and generate depends on your plan.
Copy one of your dashboards onto other data
Copy one of mine rebuilds a dashboard you already have as a new dashboard, on data you pick. The original stays untouched.
- Click Create, then Copy one of mine.
- In Copy one of your dashboards, pick the dashboard to rebuild. If you have none, you see "You have no other dashboards to copy yet."
- Pick dataset: choose the data to build the copy on. The AI maps each field, and you review before anything is created.
- Review mapping: check how each field maps. Rows are grouped as Metric, Breakdown and Trend over time. Counts show fields mapped, fields that need you, and fields dropped. Pick a different field where the match is wrong.
- Check the Live preview. Use Show money as to keep amounts as your data states them, or show them in a currency you choose.
- Confirm: "Here's what you'll get" lists how many fields were re-bound, confirms the look and format are kept, and names any pages left empty. Click Create dashboard.
The copy is a separate dashboard: edits to it don't sync back to the original. The same wizard runs from an open dashboard as Copy onto another dataset. See Build a copy of a dashboard on another dataset.
Create a dashboard on your phone
If you click Create on a phone, you see New dashboard: "Start one from here, or carry it to a computer."
| Choice | What it does |
|---|---|
| Start from a template | Pick a layout, point it at your data, and share it from the phone. Templates opened on a phone open as a draft you can share; editing needs a computer. |
| Ask the AI Agent | Say what it should show, and the agent builds it from your data. The AI Agent is available on Enterprise plans. |
| Build it yourself on a computer | The dashboard builder needs a bigger screen. Click Send link to send yourself the link through your phone's share sheet, or Copy link ("Link copied"). |
Refine a new dashboard in the editor
When the build finishes, the editor opens. It has a left panel with three tabs (AI Chat, Design and Data) and a live preview of the dashboard as viewers will see it. Describe changes in the chat, for example:
- "Change the bar chart to a horizontal layout"
- "Add a filter for region"
- "Split this into two pages, one for sales and one for marketing"
- "Make it show only data from this year"
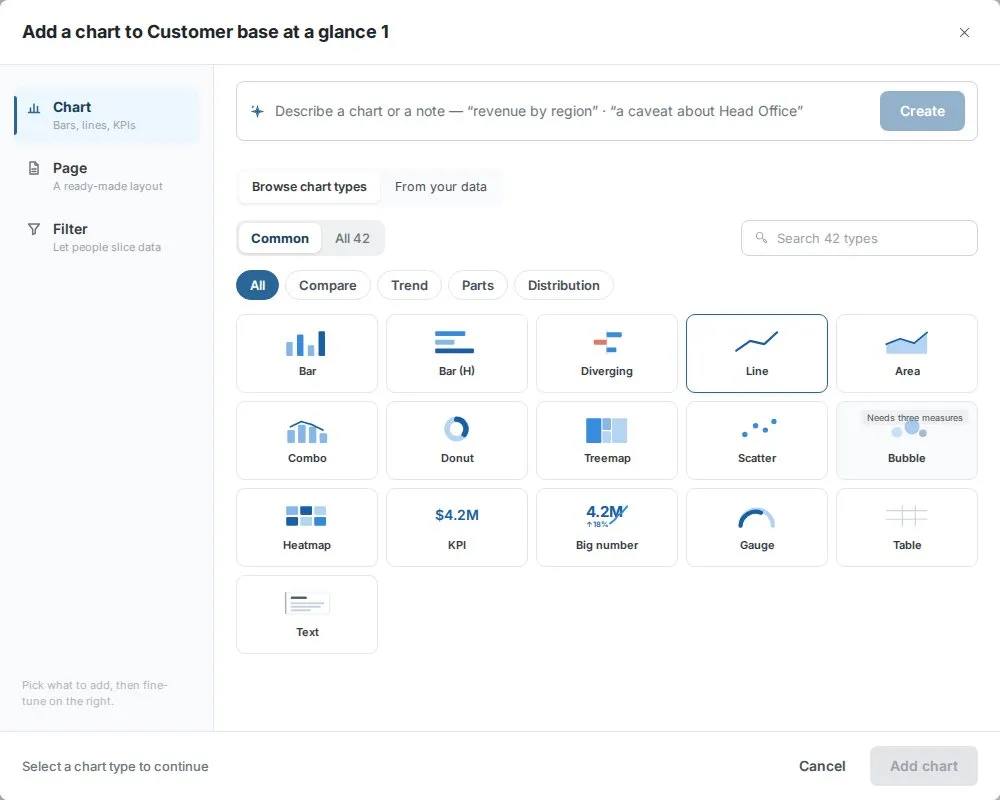
The Add menu in the header adds a Chart, Page or Filter. A new page can be a Q&A page, an Explore page or a Cover. For the full tour, see Edit with AI in the dashboard editor.
Save, then publish your dashboard
Saving is explicit. When you have unsaved edits, the header shows Unsaved changes, and publishing is disabled until you save. After you save, click Publish to go live. See Publish and share a dashboard.
Which charts the AI can build
The AI picks chart types from your columns. It uses line charts for trends over time, bars for comparing categories, KPI cards for single numbers, tables for row-level detail, and many more. For the full catalogue, see Add and change charts. To change a chart's fields and look, see Set up a chart.
After you create a dashboard
From the editor you can:
- Publish and share the dashboard.
- Set up data sync to keep charts current.
- Come back at any time and keep chatting with the AI to change it.
Related
- Import an existing report: rebuild a Power BI, Tableau, PDF or screenshot report.
- Start from a template: a finished design on sample data.
- Edit with AI in the dashboard editor: change what the AI built.
- Add and change charts: every chart type the AI can use.
- Give the AI context: definitions and goals the AI writes from.
Something wrong? support@mammoth.io