Investigate a pattern with Explore Cards, filter by filter
Edit access to the workspace to filter · Updated 8 Nov 2026
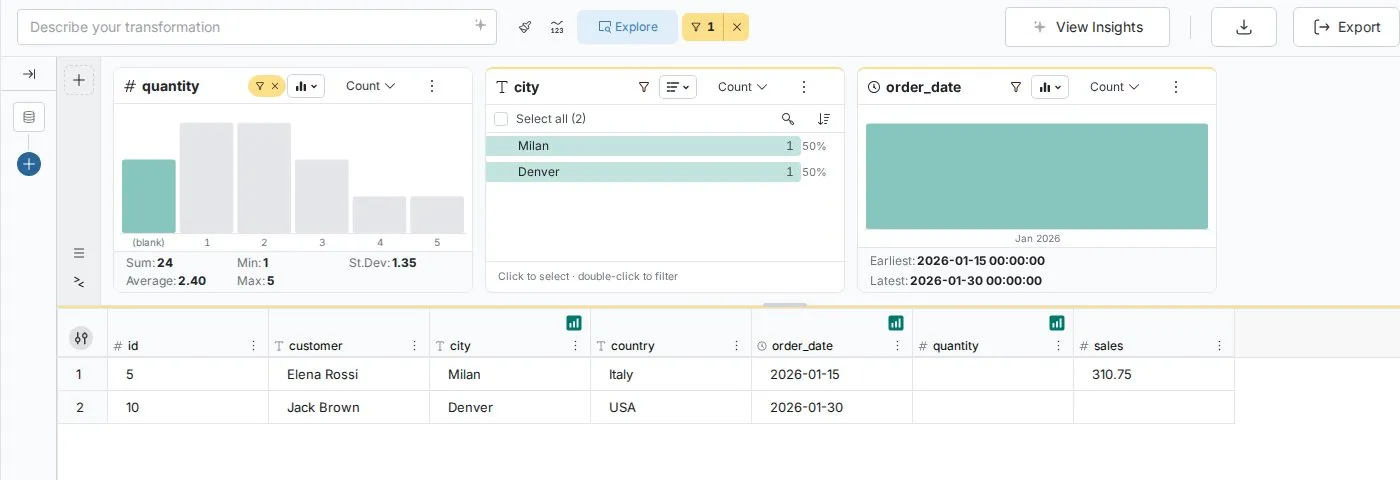
Each explore filter narrows the rows the cards to its right describe. Filtering one card at a time and reading the others is called progressive discovery. You need the Explore panel open with a card for each column you want to study, and edit access to the workspace to filter. How filtering works is on Explore Cards.
Worked example: find the cause of a defect spike
- Double-click "Fabrication Line Beta" on the line_name card. The grid drops from 2,847 rows to 892.
- Read the cards to the right. The shift card now shows Day 60%, Evening 25%, Night 15%. The defect_severity card shows Critical 35%, which is unusually high. The date card shows a spike in the weeks of March 15–22.
- Double-click "Critical" on defect_severity. The operator_name card now shows 3 operators behind 80% of critical defects.
Other patterns to follow across cards
| Pattern | What to do |
|---|---|
| Category, then numbers | Double-click "Enterprise" in customer_tier; the revenue card to its right shows the Enterprise revenue spread |
| Time, then category | Double-click "Q4 2024" on a date card; the product_category card shows Q4 performance |
| Outliers | Double-click the highest bar on an amount card (for example prices at $999,999); the customer_name and region cards show who and where. Check the other cards for date, category and source, then decide whether to exclude the rows with a Conditional Filter |
| Several filters | "West" (3,200 rows), then "Electronics" (1,850), then "Q4 2024" (420) |
| Inconsistent values | Spot variants such as "Apple Inc.", "Apple Inc" and "Apple Incorporated" on a text card, click them, then use Replace all values like this (Bulk Replace) to standardize |
| Time patterns | Double-click a spike on a date card and read the cards to its right for the cause; save the period as its own View if you need it again |
| Segments | Filter by a main attribute, refine with more filters, then save the segment as a View or a task |
Only cards to the right of a filtered card recalculate, so drag the cards you want to read after the one you filter. To keep a segment, save the filters as a View or a task.
Related
- Explore Cards: select, filter, exclude and clear filters.
- Text, number and date cards: what each card shows, including outliers and spelling variants.
- Find and replace values: the Bulk Replace task for spelling variants.
- Filter rows: exclude outlier rows for good.
Was this page helpful?
Something wrong? support@mammoth.io