Label rows, edit cells and fill blanks
The Label & Edit group in Describe your transformation > Filter, Label & Replace has three tasks. Label & Insert Values writes a value into all rows or only rows that match a condition. Edit Cells lets you type corrections straight into the grid. Fill Missing Values fills empty cells from nearby rows or predicted values.
Label rows that meet a condition
Label & Insert Values inserts a value into every row, or only into rows that match a condition.
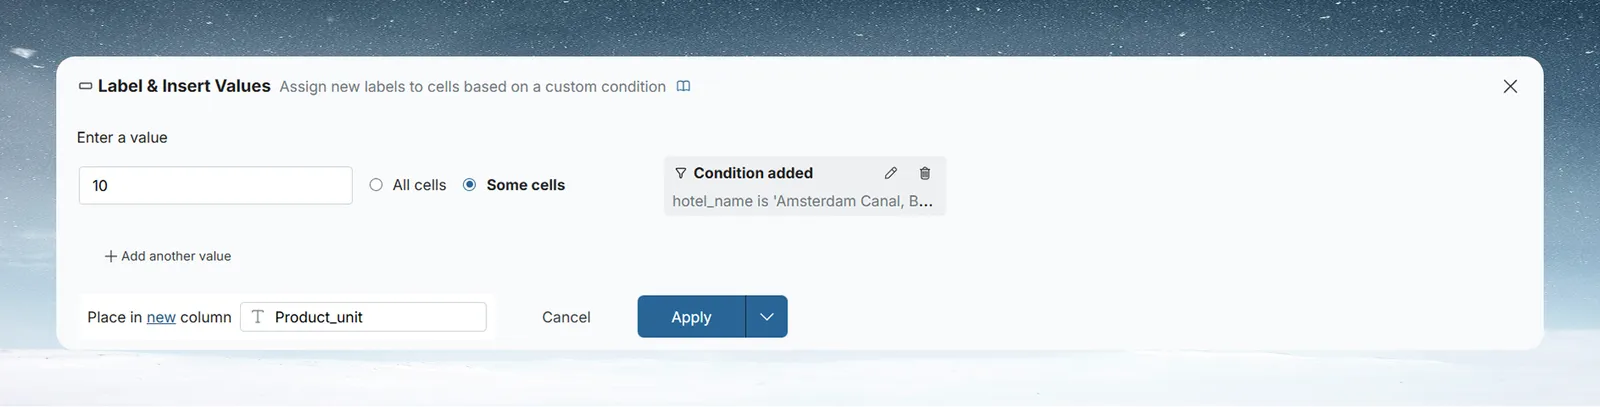
- Open Label & Insert Values.
- In Enter a value, type the value. The input adapts to the type of the column you write into. To insert a parameter's value, click the Val chip and choose Parameter; only parameters of the column's type are listed.
- Choose All cells or Some cells.
- For Some cells, click Add Condition. In the condition dialog, describe the condition in natural language or build it with column and operator dropdowns. A Condition added chip then shows the condition, with edit and delete icons.
- In Place in new column, keep New and type a column name and type, or click the word new and choose Existing to pick a column.
- Click Apply.
Insert different values for different rows
Click Add another value to insert a different value into other rows in the same task. Each earlier value needs a condition (Some cells); the last value then applies to All remaining cells. Drag values to reorder them.
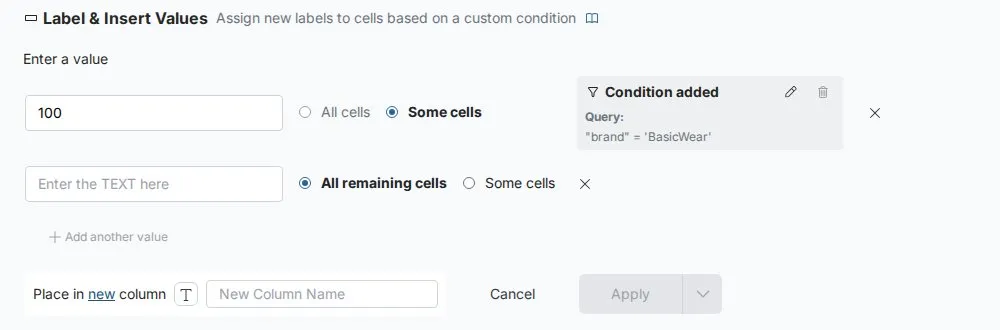
For example, to tag orders by size, insert Large into Some cells where order_amount is greater than 1000, then Add another value Standard for All remaining cells, placed in a new column order_size.
Stamp rows with the current date or time
When the result column is a Date column, the value is a dropdown with three options:
| Option | What it inserts |
|---|---|
| Datetime | A fixed date and time you pick in the Choose date time picker, to the second. It never changes. |
| Current Date UTC | The UTC date the step runs, at midnight (00:00:00). |
| Current Time UTC | The UTC date and time the step runs. |
Current Date UTC and Current Time UTC are worked out again on every run, including scheduled runs and reruns. Use them to stamp rows with a load date or a "last refreshed" time. Every row the step writes gets the same value in a given run.
Label values from an Explore card
Click the three-dot menu on any value bar in an Explore card and choose Replace all values like this. Label & Insert Values opens with that value set as the condition, so it targets only rows with that value. See Explore cards.
You can also open Label & Insert Values from a column's 3-dot menu, with that column pre-selected.
Edit individual cells in the grid
Edit Cells is for one-off corrections where a rule would be overkill.
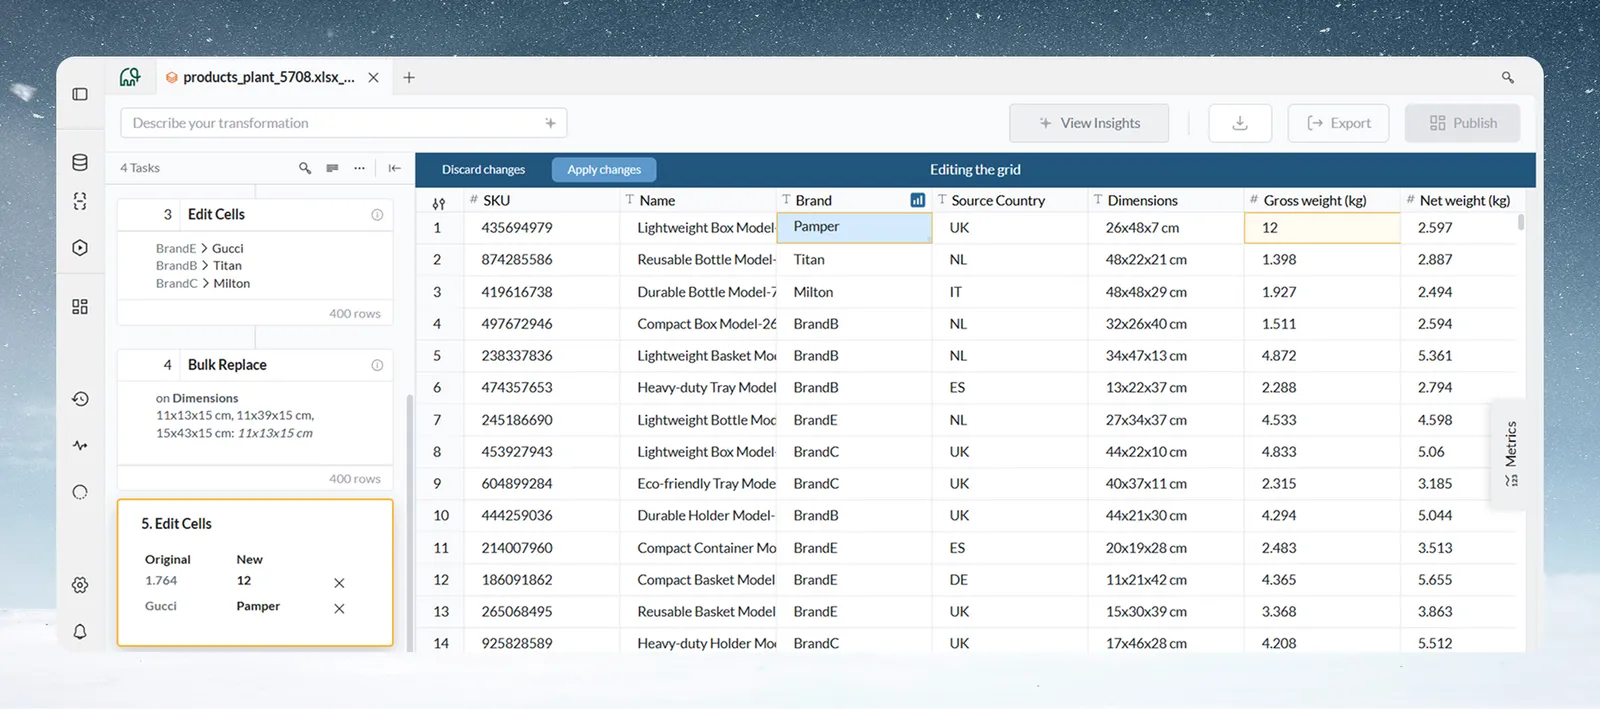
- Choose Edit Cells in the Transform menu, or double-click a cell. If cell editing is off for the dataset, a dialog asks you to turn it on first (see below).
- The View enters Editing the grid mode, with a blue bar at the top offering Discard changes and Apply changes.
- Double-click a cell and type the new value. Edited cells are highlighted.
- Check the task card in the Pipeline panel. It lists every edit as Original → New, each with an X to remove that change.
- Click Apply changes (or Add to Pipeline in Draft mode) to save all edits as one pipeline task, or Discard changes to cancel.
Edit Cells tasks can't be copied or duplicated.
Turn on cell editing for a dataset
Cell editing is a dataset setting and is off by default. It is meant for datasets under 500K rows.
From the dataset's settings in the Data Library:
- Open the dataset in the Data Library and go to its settings.
- Click the Cell editing switch (it shows On or Off).
- Mammoth asks "Turn on cell editing?" and notes that it "Re-runs this dataset's pipelines once, and stays on until every edit task is removed."
- Click Turn on.
From the data editor, double-click a cell, or choose Edit Cells. If editing is off, the Enable Cell Editing dialog opens. The same dialog opens from Cell editing (shown as Enabled or Disabled) on the dataset settings page that the settings icon at the start of the View tab bar opens. It notes that:
- Enabling cell editing will re-run the pipelines in the dataset.
- It will stay active, and you can disable it only if edit tasks are removed.
- It is recommended for smaller datasets (< 500K rows).
Click Enable Editing. While the pipeline re-runs, the blue bar at the top reads "Enabling cell editing while the pipeline re-runs". If it stops, the bar reads "Enabling cell editing did not finish", with a Try again button. When it's ready you see "Cell editing is now enabled. Double-click a cell to begin editing."
To turn it off, click the Cell editing switch again and confirm Turn off (on the dataset settings page, Disable Editing). This is "Only possible once no cells have been edited, or every edited cell has been removed." See Dataset settings and history.
Fill empty cells from the rows around them
Fill Missing Values fills empty cells in a column.
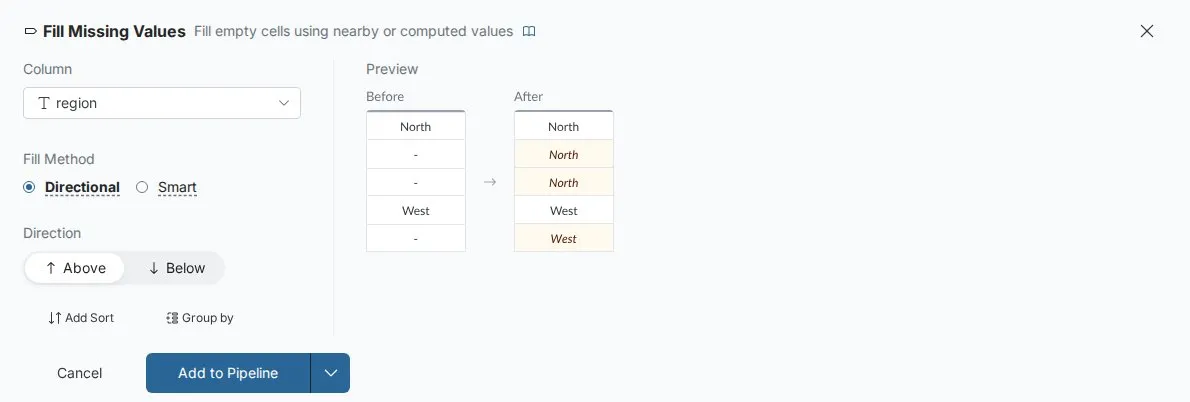
- In Select column, choose the column with empty cells.
- Choose a Fill Method:
- Directional copies the closest value above or below in the column.
- Smart predicts each empty cell from patterns in your complete rows.
- For Directional, choose a Direction: Above fills each empty cell with the nearest non-empty value above it; Below uses the nearest one below.
- Optional, Directional only: Add Sort sets the row order first, which decides what counts as above or below.
- Optional, Directional only: Group by fills only within groups, so a value never spills from one group into another.
- Check the Preview panel, then click Apply.
With AI fill, the step takes time to run, so its preview waits for you: "This function takes time to run. Click Run preview to see its result." Click Run preview.
For example, a report export lists region only on the first row of each block. Choose Directional, Above, to copy each region down to the empty rows below it.
Limits
| Limit | Value |
|---|---|
| Recommended dataset size for cell editing | Under 500K rows |
Troubleshooting cell edits and fills
| Symptom | Cause | Fix |
|---|---|---|
| Double-clicking a cell opens Enable Cell Editing | Cell editing is off for the dataset | Click Enable Editing, or leave it off and use Label & Insert Values |
| Can't turn cell editing off | Some cells are still edited | Remove every edit (or the Edit Cells tasks), then turn it off |
| Fill copied values across groups | No Group by set | Add Group by so filling stays within each group |
| Fill used the wrong neighbour | Row order isn't what you expect | Use Add Sort to set the order |
Related
- Filter rows: the operators you can use in a condition.
- Find and replace values: replace values by rule rather than cell by cell.
- Add, split, copy and delete columns: add an empty column to fill.
- Edit, reorder and copy pipeline tasks: review or remove an Edit Cells task.
- Parameters and snippets: insert a value you change in one place.
Something wrong? support@mammoth.io