Add a running total, rank or largest value per row
Window function and Obtain Large or Small Values are Numeric Tools in Describe your transformation › Date, Numeric & Text. Both add a column and keep every row, and both re-run every time the pipeline refreshes.
Add a running total, rank or moving comparison
Window function runs a calculation across rows for rankings, running totals and row-to-row comparisons. Group & Pivot gives one summary row per group; a window function adds its result as a new column beside the original rows. A number column's 3-dot menu has shortcuts: Calculate running total and Ranking.

| Setting | What it does |
|---|---|
| Select function | Sum, Average, Min, Max, Standard Deviation, Variance, Count, Row number, Rank, Dense rank, Percent rank, Cumulative percent rank, N tile, First Value, Last value, Nth value, Lead, Lag. |
| Select column | The column to run the function on. Shown for Sum, Average, Min, Max, Standard Deviation, Variance, First Value, Last value, Nth value, Lead and Lag. Count, Row number, Rank, Dense rank, Percent rank, Cumulative percent rank and N tile need no source column. |
| Value of N | For N tile (a whole number of 2 or more) and Nth value (1 or more). |
| Type | For Sum, Average, Min, Max, Standard Deviation, Variance, Count, First Value, Last value, Nth value and N tile. Accumulate (default) builds the result row by row: a Sum of 5, 10 and 15 gives 5, 15 and 30. Aggregate works out one summary per group and stamps it on every row: if a group's total is 30, every row in it shows 30. |
| Offset | For Lead and Lag: a whole number of 1 or more. |
| Limit ranking result | For Row number, Rank and Dense rank. Turn it on to enter Limit to following no. of rows and keep only the top ranks. |
| Group by | Runs the calculation within each group, for example ranking within each region rather than across all data. |
| Add Sort | The order rows are processed in. Shown for Row number, Rank, Dense rank, Percent rank, Cumulative percent rank, Lead and Lag, and for the other functions when Type is Accumulate. Row order matters for a running total. |
| Place in | A name for the new column, or an existing column to overwrite. |
Mammoth warns when a sum, average or ranking runs over an ID column: "IDs are labels, not amounts, so a running total or ranking of them isn't meaningful." The warning doesn't block Apply.
Rank customers by revenue within each region
- Open Window function and select Rank.
- Click Group by and select
region. - Click Add Sort, choose
revenueand sort descending. - Name the new column and click Apply.
Every customer row gets a rank within its region, not across the whole dataset.
Find the largest or smallest of several columns in each row
Obtain Large or Small Values compares a set of number columns row by row and returns the Nth largest or smallest value.
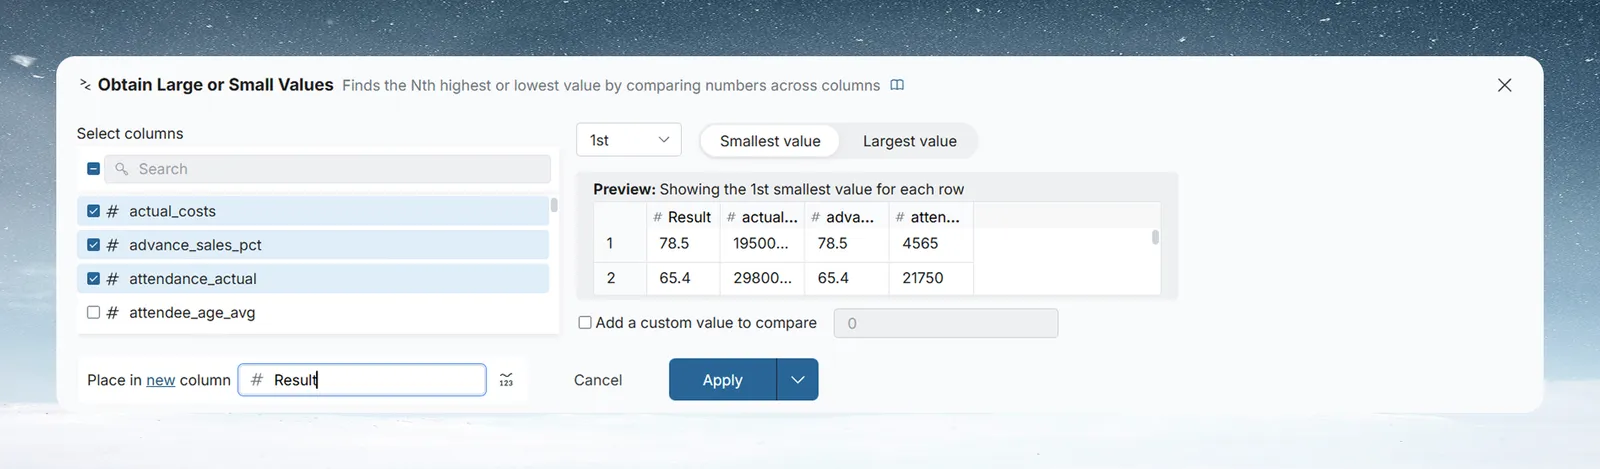
- In Select columns, tick the number columns to compare (at least two). Use the search box to find them.
- In Select Nth, set the rank to return: 1st, 2nd, 3rd and so on.
- Choose Largest value or Smallest value.
- Optional: in Add a custom value to compare, add a fixed number. It counts as an extra column and shows as its own column in the preview. It can be a Number parameter (click the Val chip).
- Check the Preview, which updates as you go.
- In Place in, name the output column or choose an existing column to overwrite. Click Apply.
For example, with three price columns, supplier_a_price, supplier_b_price and supplier_c_price, select all three, choose 1st and Smallest value. The result is the cheapest quote in each row, so you can see the best supplier per product.
Fix a running total that looks out of order
| Symptom | Cause | Fix |
|---|---|---|
| A running total looks out of order | The rows aren't sorted as you expect | Set Add Sort in Window function |
Related
- Group, pivot and unpivot: one summary row per group instead of a window.
- Calculate with formulas: row-by-row Math Function calculations.
- Work with text and JSON: the Text Tools in the same category.
Something wrong? support@mammoth.io