Excel tasks in Mammoth: filters, VLOOKUP and pivots
Most Excel report work maps to five Mammoth pipeline tasks, which you add from the + button or the Describe your transformation box in a view. You need the Project Editor or Project Admin role. For the full 30-day plan, see Mammoth for data analysts.
The five transformations analysts use most
| Task | Common uses |
|---|---|
| Conditional Filter | Recent orders: Order_Date is on or later than 2024-01-01. Remove test accounts: Email does NOT contain @test.com. Specific regions: Region is East, West (is accepts several values). Exclude cancelled orders: Status is not Cancelled |
| Bulk Replace | "iPhone 15 Pro", "iphone 15 pro" and "iPhone15Pro" all become "iPhone 15 Pro". "HR", "Human Resources" and "HR Dept" become "Human Resources". Mammoth suggests groups on the Group Suggestions tab; you keep the right ones and apply |
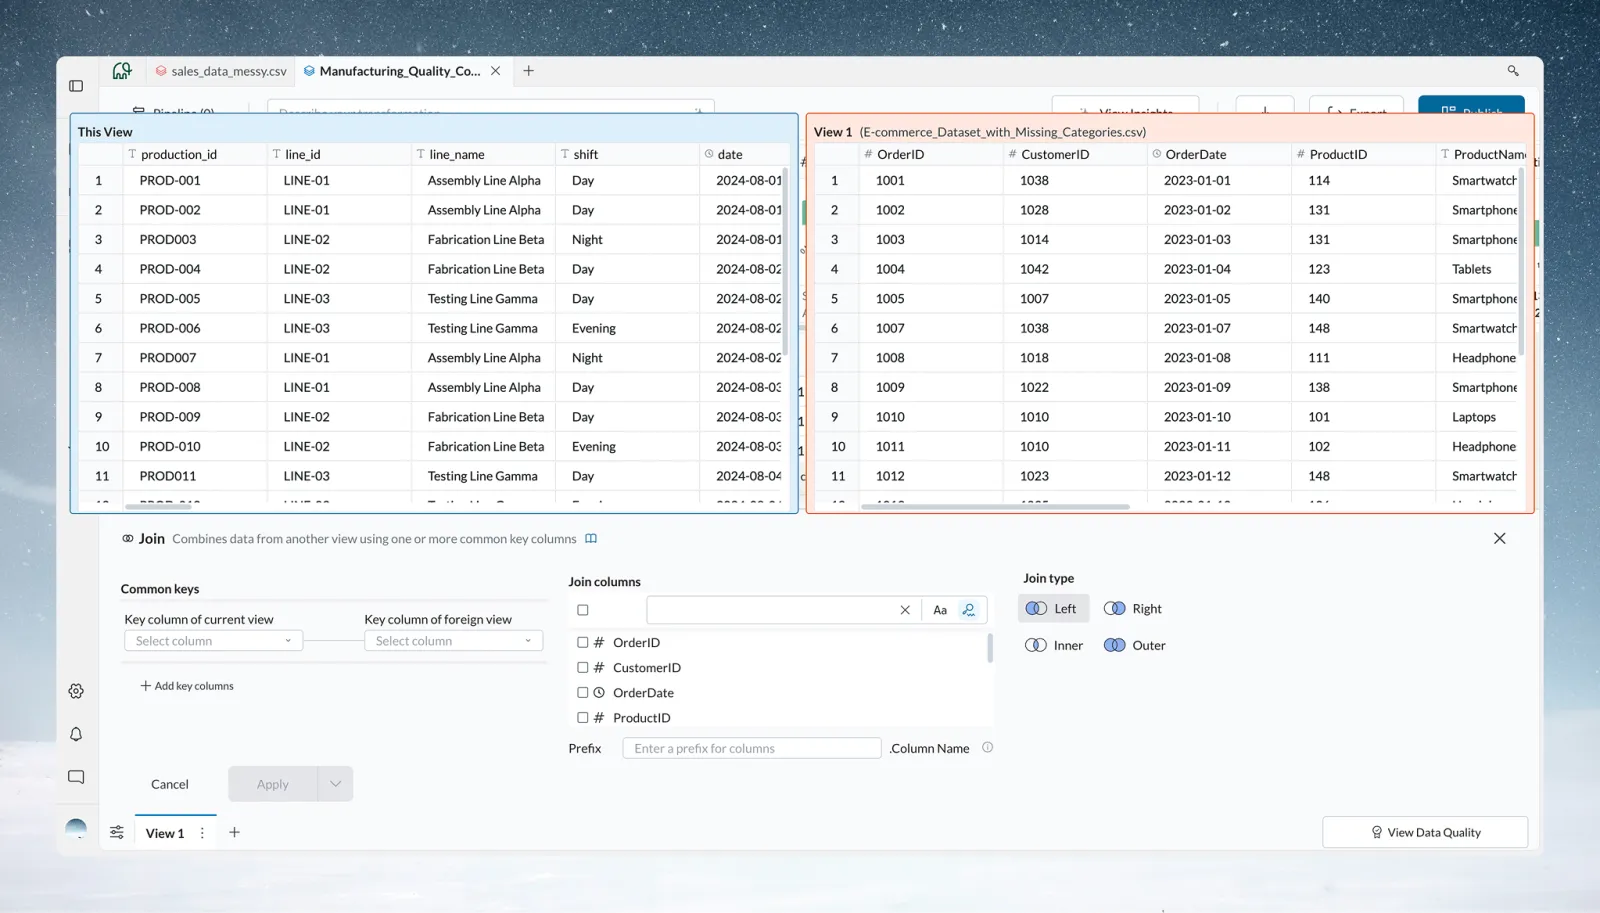
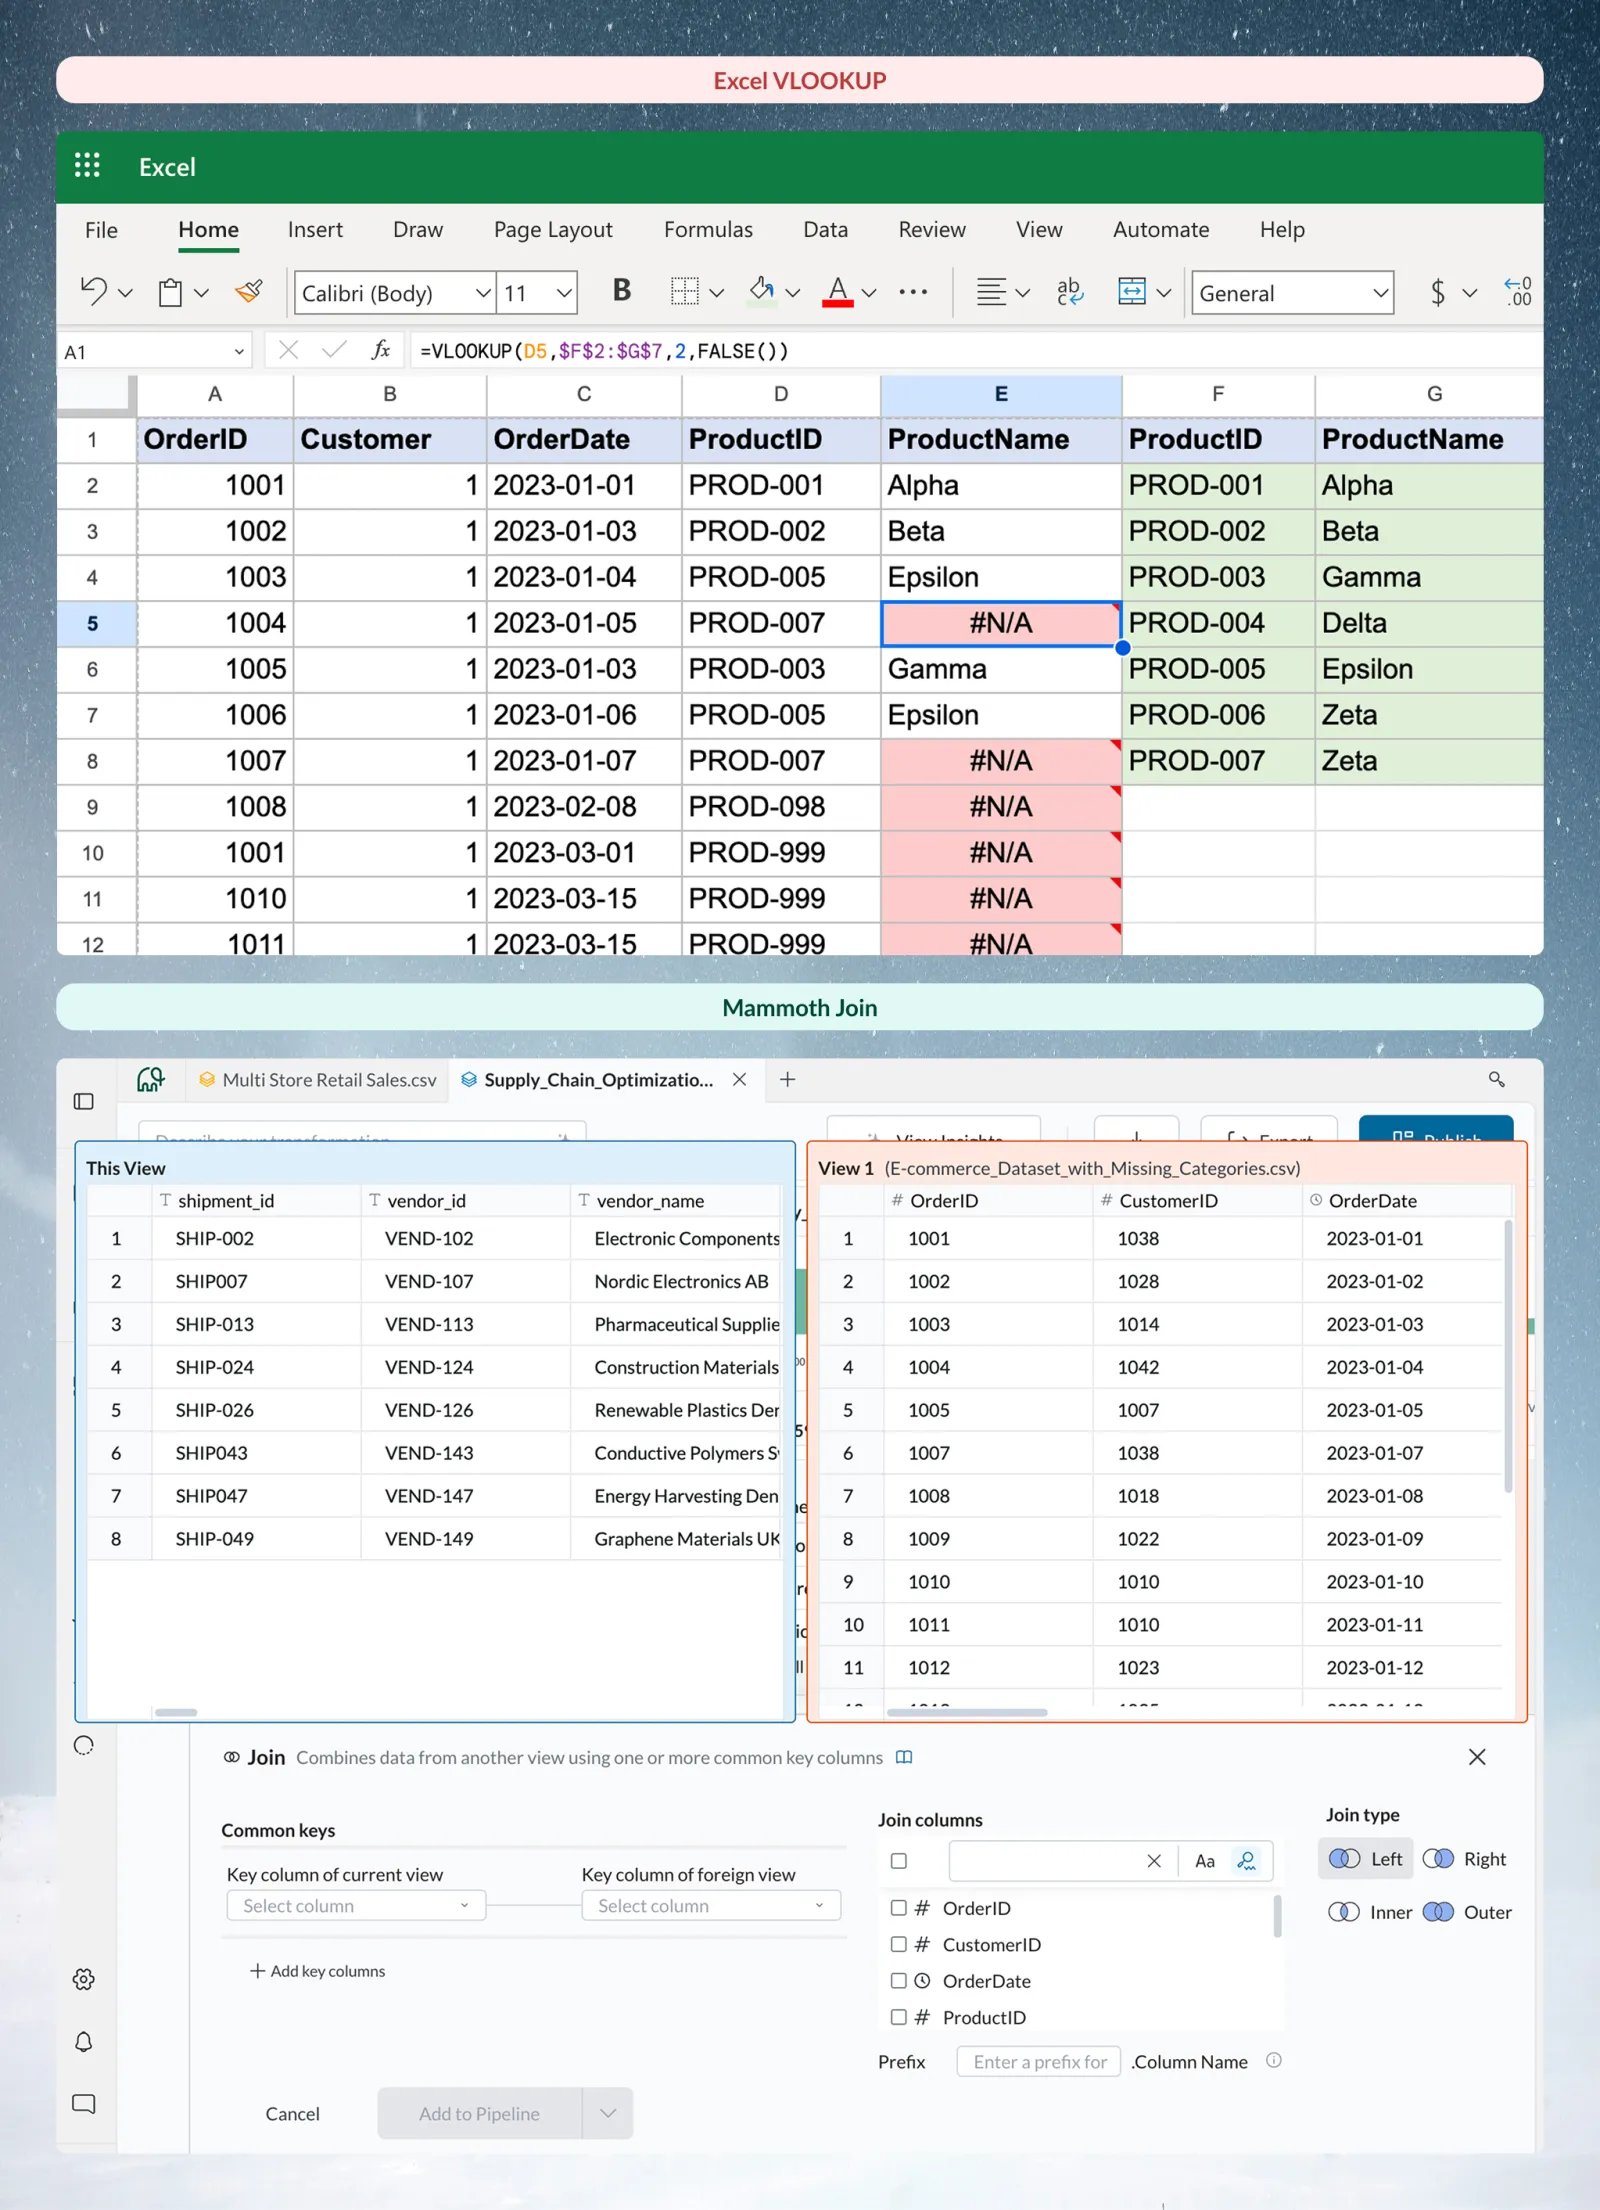
| Join and Lookup | Add customer names to order IDs with no VLOOKUP. Enrich sales with product details from a master list. Lookup brings in one column from another view, such as a price. For both, you pick the other dataset and view from the same project, then the key columns that match |
| Math Function | Profit margin: ("Revenue" - "Cost") / "Revenue". Year-over-year growth: ("This_Year" - "Last_Year") / "Last_Year". Share of total: "revenue" / SUM("revenue") * 100. For running totals and rankings, use Window Function |
| Group & Pivot | Sales by region, monthly totals, category summaries. To keep only the top 10 customers after grouping, add Show Top/Bottom Rows |
See Filter rows, Join two datasets on a shared column and Group, pivot and unpivot.
Describe what you want and let AI build it
The Describe your transformation box in the Transform menu finds the function that matches your words, and always offers Ask in plain words with your text in its prompt.
| You type | Where | Mammoth builds |
|---|---|---|
| "Remove orders from test accounts" | Describe what you want to generate in Conditional Filter, then Generate | A filter that removes rows with test emails |
| "Standardize company names" | Bulk Replace, Grouping Settings > Smart | Suggested groups of names that mean the same thing |
| "Calculate profit margin percentage" | Describe what you want to generate in Math Function, then Generate | A SQL expression for the margin |
| "Total sales by region" | Ask in plain words prompt, then Generate | A SQL query you review and apply |
Check the result in the preview before you click Apply. To build a dashboard, click Dashboards > Create, choose your view under With my data, pick a format, and build a suggested idea or describe one, such as "sales dashboard showing revenue by region".
Common analyst problems, solved
| Problem | The Mammoth way |
|---|---|
| "I have 12 Excel files to consolidate monthly" | Add each file to the same dataset with Add data. Each file becomes a batch, the view combines them, and the pipeline runs on the new rows. To pick up files from a folder automatically, use a Data Consolidation automation (a plan feature: see What each plan decides). See Combine incoming data and Batches |
| "My VLOOKUP keeps breaking" | A Join task matches rows by the columns you choose, in a visual panel |
| "I send the same report weekly" | A Dataset Refresh automation fetches new data, the pipeline runs, the dashboard updates, and a Messaging automation or the dashboard's email updates send it |
| "Data quality issues waste my time" | Run View Insights and View Data Quality before you build, then fix issues once in the pipeline |
Related
- Build your first pipeline: the core tasks on sample data, step by step.
- Find and replace values: Bulk Replace groups and rules.
- Write SQL with AI: every Ask in plain words rule.
Something wrong? support@mammoth.io