Mammoth for managers: set up and oversee your data team
This plan is for managers of data teams. In your first 48 hours you create a project (Data > project selector > New Project), invite your team with roles, and watch a first workflow in the Activity Log (Monitor > Activity Log). You don't need to build pipelines yourself, because your team does that; you set the boundaries and share the results as dashboards.
The key capabilities are projects, project roles and dashboard sharing; dashboards, docs and slides; Monitor and the Activity Log; and dashboard audience (who read a dashboard and what they asked).
What a Project Admin can do
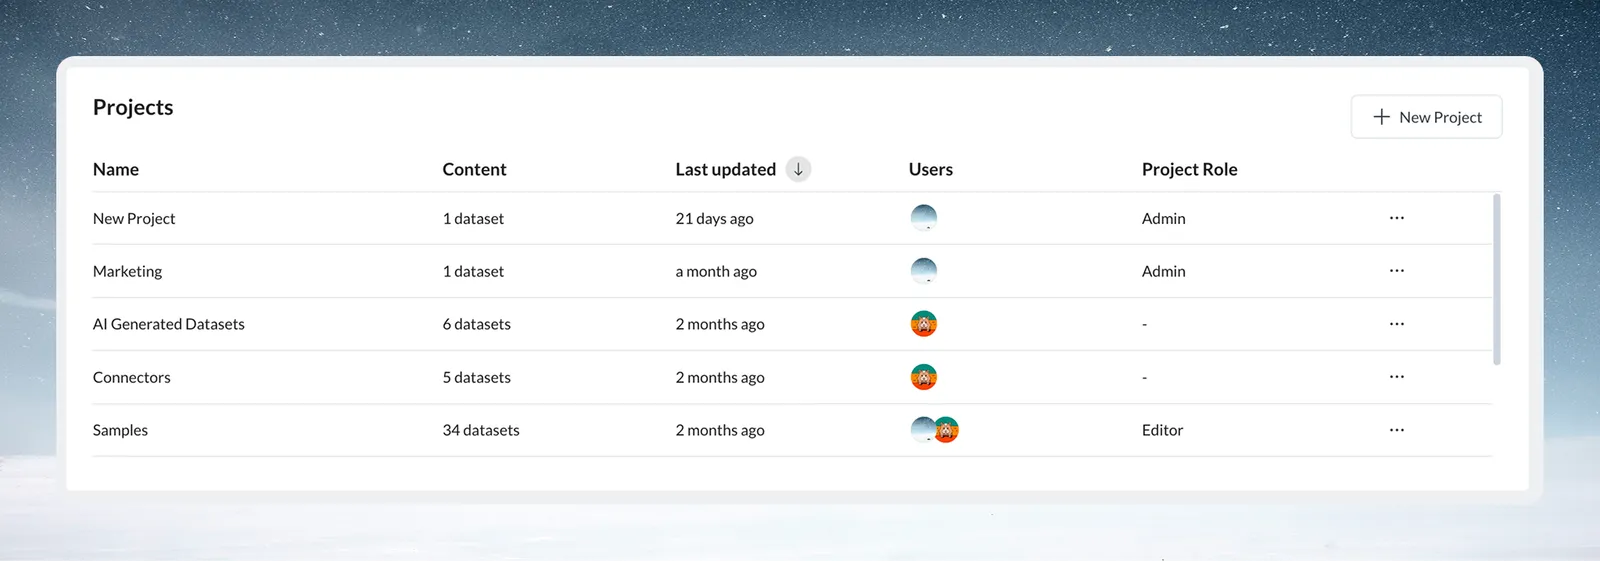
When you create a project, you become its Project Admin. You control the project's team, data access and governance; Project Admins control who can do what, and Project Editors control how they do it.
| Capability | Project Admin | Project Editor | Project Viewer |
|---|---|---|---|
| Add or remove project members | ✓ | ✗ | ✗ |
| Rename or delete the project | ✓ | ✗ | ✗ |
| Create, update or delete connections | ✓ | ✗ | ✗ |
| Start datasets from existing connections | ✓ | ✓ | ✗ |
| Add, edit or delete datasets, views and pipelines | ✓ | ✓ | ✗ |
| See Data Library items | ✓ | ✓ | ✓ (read-only) |
Project Admins can also add workspace members, invite people who aren't in the workspace yet, and remove access when someone leaves. On the Pro plan you can create custom project roles. Name a backup admin, so someone can handle urgent access needs when you're away.
Hour 1: create a project and pick a first use case
- Click Data in the left sidebar.
- Click the down arrow next to the project name at the top, then New Project.
- Name it, for example "FP&A Monthly Reporting" or "Operations Analytics".
- Leave Who can access on Only me for now (the default).
- Click Create Project.
Mammoth switches you into the new project, and you are its Project Admin. If your plan's project limit is reached, New Project is blocked. See Projects.
Managers mostly work at the project level: the workspace is your subscription, the project is your team's work area, datasets hold the data, views are where the team transforms it, and dashboards are what you share. Migrate one recurring process first, such as a monthly close report, a weekly operations dashboard, or a quarterly analysis that copies data between five spreadsheets. It becomes your proof of value.
Hours 2 to 4: invite your team and set project settings
Start with one or two team members; they can help onboard the rest.
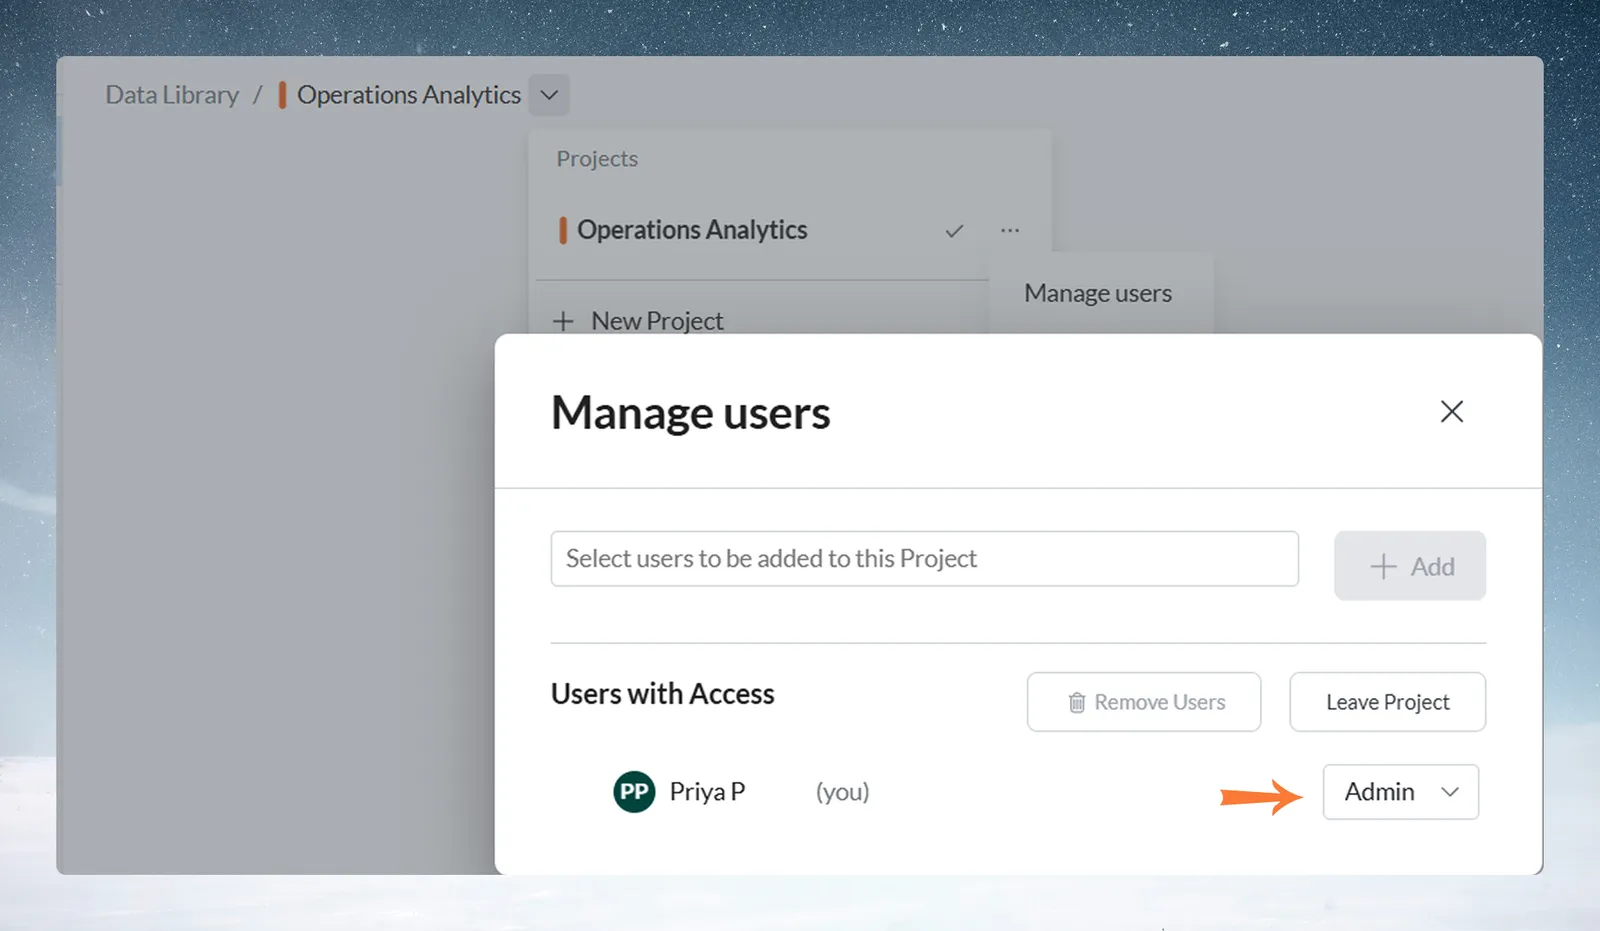
- In the project selector, click More options (three dots) next to your project.
- Click Manage Users.
- Add the workspace members you want, or type the email of someone who isn't in the workspace yet.
- Assign roles: Project Editor for most, Project Admin for backup admins, Project Viewer for read-only access.
The added members appear under Shared with, listed by role. Then open Project Settings from the project menu to check the Project Name and Project colour, set Dates (US, UK / Europe, International (ISO) or Not set), choose Who can access, and click Save changes. Who can access decides whether everyone in the workspace, the people you select, or only you can open the project. Starting restrictive and loosening later is easier than revoking access.
The project menu depends on your role in that project. Project Admins see Project Settings, Manage Users, Leave Project and Delete Project. Project Editors and Project Viewers see Leave Project, and Delete Project greyed out. Workspace Owners who aren't in the project see Manage Users and Join Project. See Set up your workspace for every setting and which menu items each role sees.
Hours 24 to 48: watch a first workflow
- Have a team member upload a recurring file, such as last month's sales report.
- Watch them build a pipeline. The goal is to understand the process, not to build it yourself.
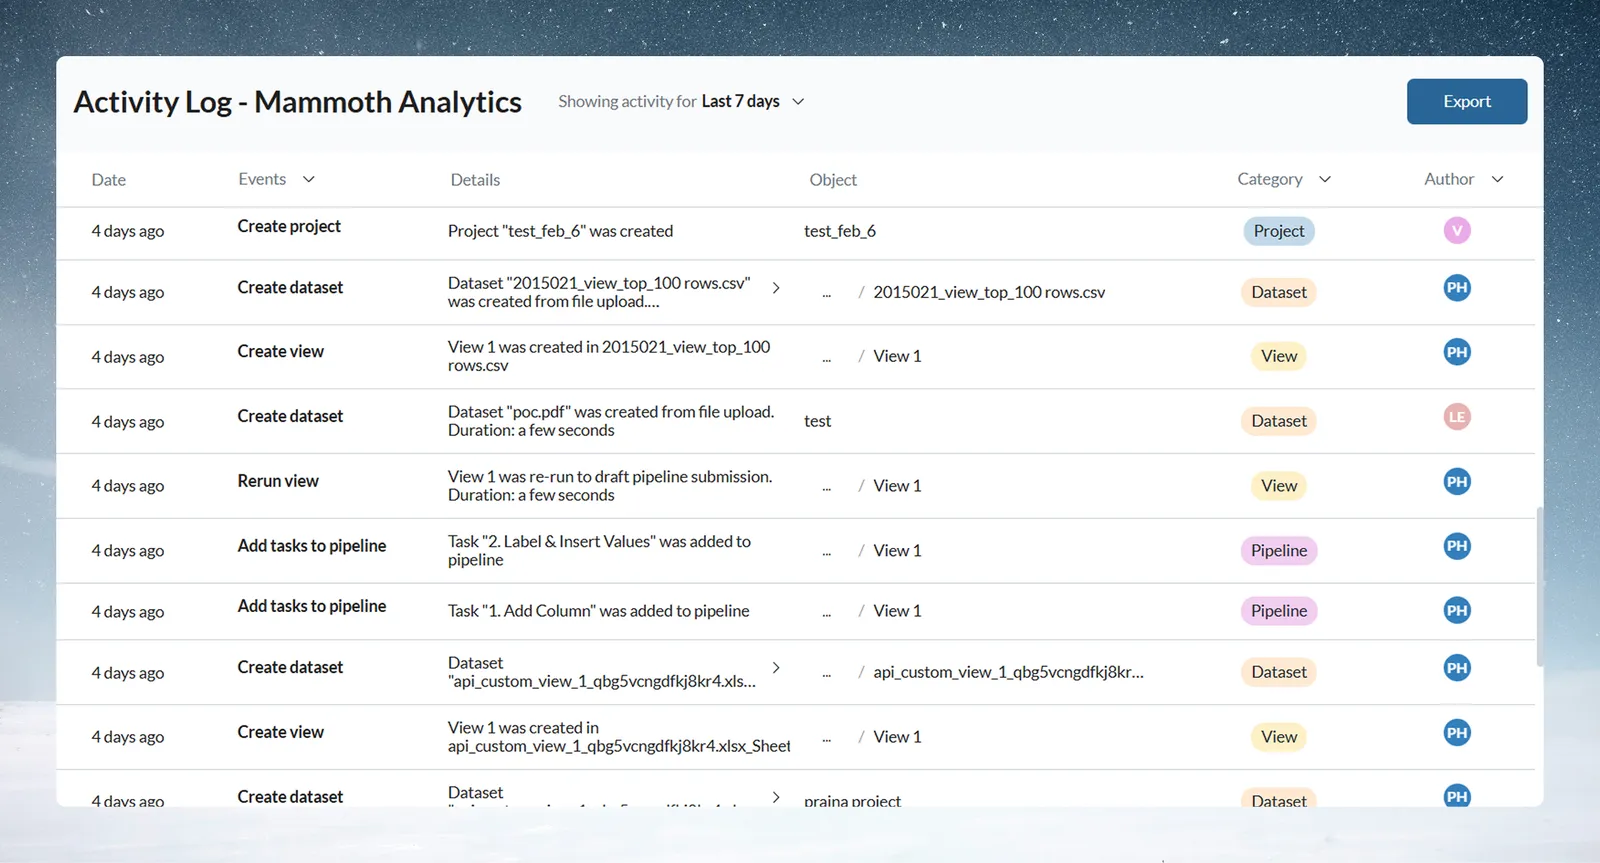
- Review the Activity Log to see their actions recorded.
- Hold a short team sync on how this could standardise your recurring workflow.
Standardise recurring workflows with a reference pipeline
- Identify workflows that repeat: monthly close, weekly operations summaries, quarterly board packs, recurring client deliverables.
- Document the current process with the person who does it: where the data comes from, what changes, the output, and how long it takes.
- Build a reference pipeline with your most technical team member. It becomes your template.
- Replicate it: others use Copy pipeline in Pipeline Version history, or copy single tasks and use Paste below, then adapt. See Edit, reorder and copy tasks.
- Monitor adoption in the Activity Log each week: who uses the reference pipeline, where people deviate, and who still works by hand.
Control who adds data sources
Connections belong to the project, and only Project Admins create, edit or delete them. To create one:
- Click Data in the left sidebar, then New dataset.
- In Where do you want to add data from?, choose Connectors (or open the Connections tab and click New Connection).
- Pick the source in the Connectors launcher and connect it.
The connection appears on the project's Connections tab, and Project Editors can start datasets from it. When an Editor tries to add a new source, they see "New sources are added by this project's admins." and can click Copy a request to send you a note. Project access is role-based and limited to invited members; Workspace Owners can add users to, and delete, any project. See Manage saved connections.
Create and share an executive dashboard
You can build a dashboard from a view your team prepared, instead of asking them for presentation material.
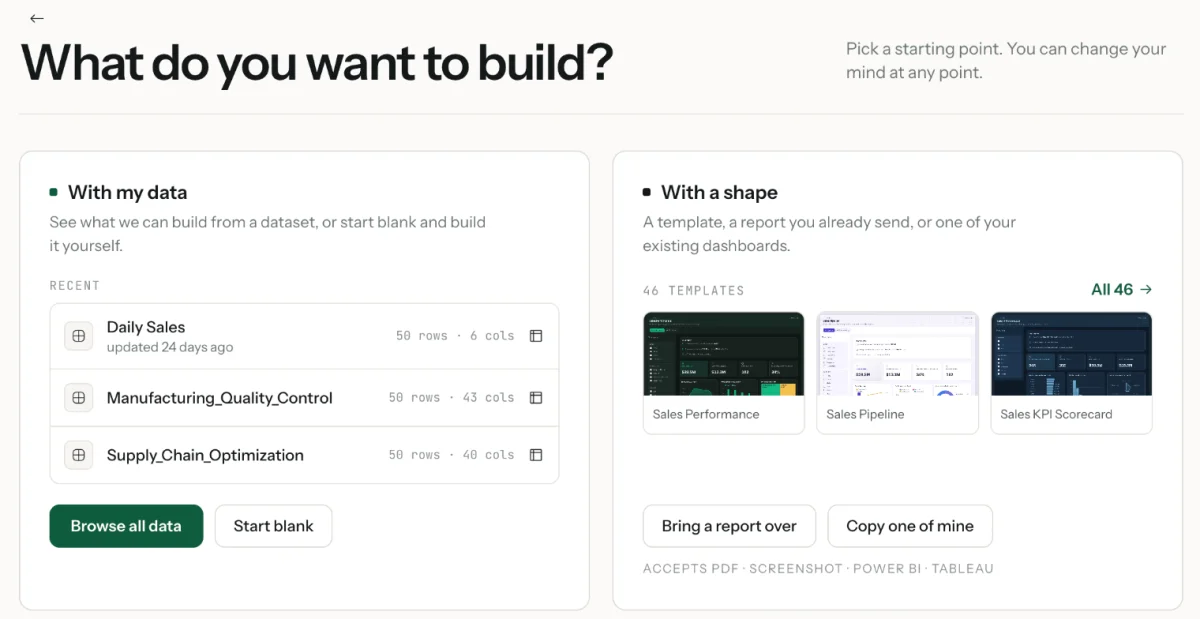
- Click Dashboards in the left sidebar, then Create, to open What do you want to build?
- Pick the lane: With my data builds from a dataset (or starts blank); With a shape starts from a template, a report you already send, or one of your existing dashboards.
- Choose the team's prepared data, and review the starting points Mammoth suggests from your columns and dates, or describe what you want.
- Pick a format: Dashboard, Slides, Doc, Q&A or Explore.
- Refine it, publish it, then share it.
In the dashboard's Share panel, the Access menu sets who can open the published link. By default, everyone in the dashboard's project has access.
| Access | Sign-in | Suited to |
|---|---|---|
| Anyone with the link and password | None, but a password of 8 to 128 characters | Board members, partners and clients without Mammoth accounts, when the link alone is too open |
| Anyone with the link | None | Public reporting and content fine for anyone to see |
| Sign-in required | Everyone in the project, plus people outside it you invite by email, signs in to Mammoth | Internal dashboards and department KPIs |
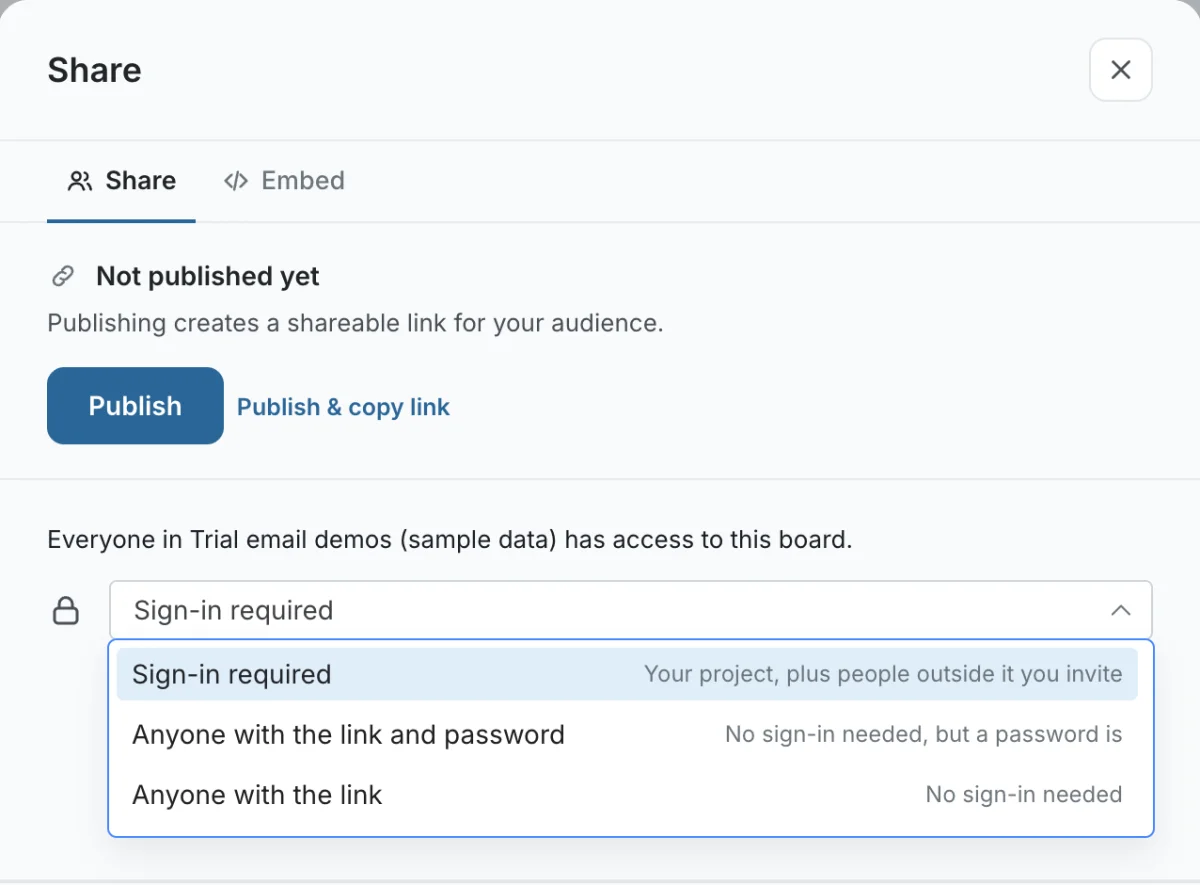
For board packs, use Anyone with the link and password and send the password separately. Only Sign-in required lets you invite viewers, use row-level security and send email updates. Data updates when the view's data updates; turn on email updates to tell readers. See Publish and share a dashboard and Email updates.
Review team activity in the Activity Log
Open Monitor in the left sidebar, then the Activity Log tab. Use the Project and Workspace buttons to switch scope. Every Workspace Owner and Workspace Member can open it.
Actions are recorded automatically in these categories: Dataset, Pipeline, View, Automation, Connector, Project, Folder, Workspace, Data Retention, Dashboard and Parameter. For example: creating datasets and adding data; adding, editing and deleting tasks; creating and running automations; inviting and removing users, changing roles, creating or renaming projects.
Each entry shows Date, Events, Details, Object, Category and Author. The date range defaults to Last 30 days. How far back the log goes depends on your plan: 7 days on Free, 90 days on Starter, 1 year on Team and 3 years on Pro. See Activity log.
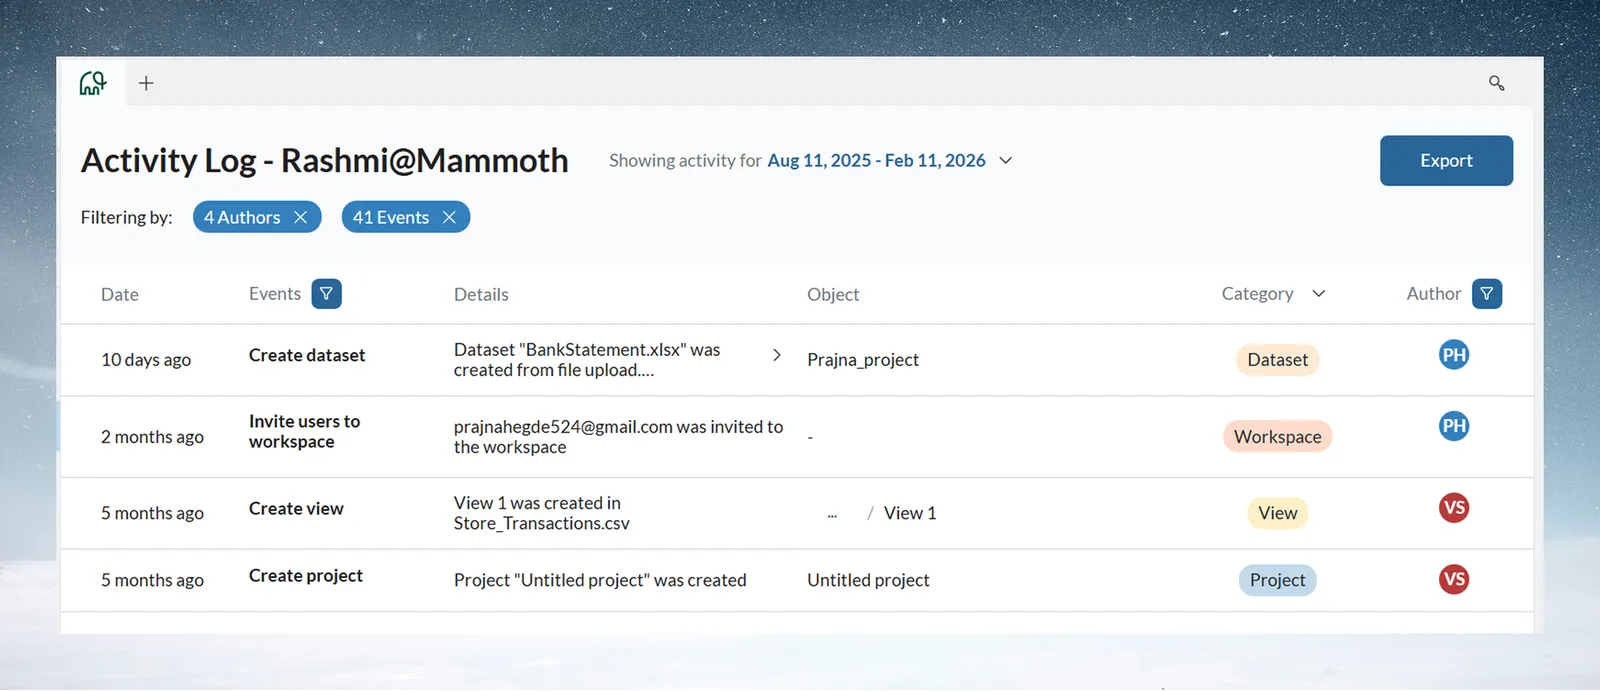
The log shows what happened, not data contents: you see an Add tasks to pipeline event with the view and the teammate, but not revenue values or rows. Use it to spot patterns: the same file uploaded by hand every week suggests a connector and Dataset Refresh (or, for files, a Data Consolidation automation); heavy Excel exports with few dashboards suggest dashboard training; similar pipelines rebuilt from scratch suggest a reference template and a short training session. Signs of success are several people using reference workflows, consistent naming, and team members building stakeholder dashboards on their own.
To check whether the team is using Mammoth, look in the log for pipeline creation in the first weeks and steady activity from most of the team (its history is limited by your plan). Also check whether recurring reports now come from Mammoth, and ask the team in one-to-ones which workflows they have automated.
Share data between projects
Projects don't share datasets or connections, and a Join or Lookup can't read another project's views. Send the data across first:
| Need | Method |
|---|---|
| Regular sharing inside Mammoth | A view in Project B ends its pipeline with Send to Dataset, pointed at a dataset in Project A. It sends new data each time the pipeline runs |
| Sharing through your own database | Project B exports a view to a shared database (for example PostgreSQL or BigQuery); Project A connects to it, and a Dataset Refresh keeps it current |
| One-time transfer | Save a copy from Project B (the download icon), then upload it into Project A |
| Read-only access | Share a dashboard, a collection, or a Live link (Team and Pro) |
Connections must be created in each project that needs them. Use approved shared databases for cross-project exchange, and read-only credentials for production systems.
When a team member leaves
Work stays in the project, not with the person: pipelines, datasets and shared dashboards keep working.
- In the Activity Log, filter Author to that person to see their key contributions.
- Decide who maintains each workflow, and hand off complex pipelines.
- A Workspace Owner removes them in Workspace Settings > User Management. Make sure each project still has a Project Admin.
Grow the team over months 1 to 3
Roll out in stages: champions (one or two people) in weeks 1 and 2, early adopters (three or four) in weeks 3 and 4, and the full team in weeks 5 to 8. Early adopters can help train later team members. Keep a library of reference pipelines with clear names, notes on the business logic, example uses and an owner. Measure time, error rates, rework and active users against a baseline you record before automating.
After 3 to 6 months, add scheduled Dataset Refreshes (daily, weekly, monthly), pipeline templates (Save as template in Pipeline Version history downloads the pipeline as a file the team can apply to another view), and dashboard templates (see Start from a template). If you use Tableau or Power BI, send prepared data with the Tableau Server/Cloud export (Team and Pro), or publish it to a Mammoth-managed database your BI tool reads. See Send data to a database or BI tool.
Related
- Set up your workspace: invite users and configure projects.
- Members, roles and custom roles: every permission in one matrix.
- Activity log: filters, export and retention.
- Publish and share a dashboard: access, passwords and row-level security.
- Pick your path: the plans for analysts and technical users.
Something wrong? support@mammoth.io