Mammoth for data analysts: automate Excel reports in 30 days
This plan is for data and business analysts who spend most of the day in Excel and want to replace copy-paste work with pipelines, without coding. You start in Data > New dataset with a file you use often, build a first pipeline on day 1, replace one manual workflow in week 1, and share a dashboard by the end of month 1. You need the Project Editor or Project Admin role in a project.
The key capabilities are file upload and Explore Cards; pipeline tasks such as Bulk Replace, Join and Group & Pivot; Dataset Refresh, Data Consolidation and Messaging automations; and dashboards, docs and slides built from your data.
| Milestone | Goal |
|---|---|
| Day 1 | First transformation and first complete pipeline |
| Week 1 | Replace a manual workflow |
| Month 1 | Several automated workflows and a shared dashboard |
Day 1: upload a file and remove test rows
- Click Data in the left sidebar, then New dataset.
- Drag your Excel or CSV file into the Upload area and click Submit.
- When the dataset is ready, click it and click Explore. The data opens in a spreadsheet-like view.
- In the Explore panel above the grid, click Add card (Explore a column) and pick a column. Text columns show bar charts of the most common values, numeric columns show distributions and outliers, and date columns show a timeline.
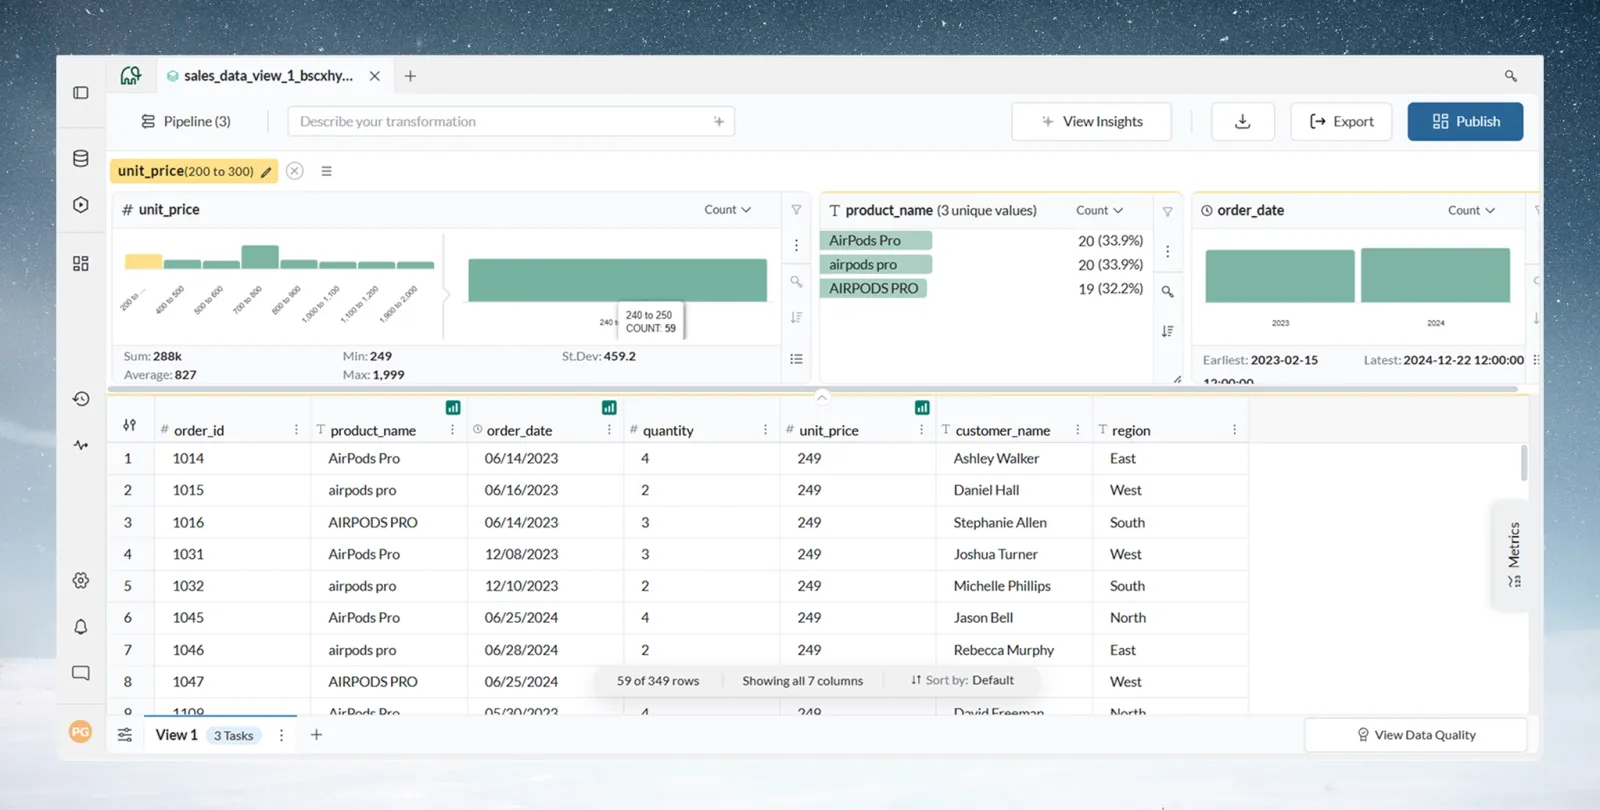
Double-click any value on a card to filter the data. You can turn the quick filter into a permanent Conditional Filter task later. Then remove unwanted rows, such as test data:
- Click the blue + button (tooltip "Add a task").
- Select Filter, Label & Replace > Conditional Filter, or type "filter" in the search box.
- The filter opens in SQL mode. Click Builder.
- Leave Keep selected, and choose your column (for example "Status").
- Select does NOT contain and type "test".
- Click Apply.
You can also describe the rule in the Describe what you want to generate bar, for example "remove rows where status contains test", and click Generate. The filter appears as a task and runs on every future refresh.
| Your Excel process | The Mammoth process |
|---|---|
| Open file, apply filter, copy visible cells, paste to a new sheet, save as a new file | Open the view, add a Conditional Filter, done. Next month's data uses the same pipeline |
Week 1: replace one manual workflow
| Your current work | The Mammoth way |
|---|---|
| Monthly report preparation (most common): download, clean, combine, calculate and format each month | Upload the file or connect the source. Add the tasks you do by hand (Conditional Filter, Bulk Replace, Convert Column Type, Math Function, Group & Pivot). The pipeline saves itself. Next month, add the new file to the same dataset with Add data, or create a Dataset Refresh automation for a connector dataset |
| Daily sales dashboard: extract from the CRM, clean, pivot and email | A Dataset Refresh automation on your CRM connector, and a dashboard built from the view, so stakeholders see current data without your email |
| Weekly metrics email: consolidate sources, calculate KPIs, format | A Messaging automation emails the view on a schedule, as a CSV attachment (up to 100,000 rows in total) |
See Add or replace data, Refresh a dataset and Send messages.
The five transformations analysts use most
| Task | Common uses |
|---|---|
| Conditional Filter | Recent orders: Order_Date is on or later than 2024-01-01. Remove test accounts: Email does NOT contain @test.com. Specific regions: Region is East, West (is accepts several values). Exclude cancelled orders: Status is not Cancelled |
| Bulk Replace | "iPhone 15 Pro", "iphone 15 pro" and "iPhone15Pro" all become "iPhone 15 Pro". "HR", "Human Resources" and "HR Dept" become "Human Resources". Mammoth suggests groups on the Group Suggestions tab; you keep the right ones and apply |
| Join and Lookup | Add customer names to order IDs with no VLOOKUP. Enrich sales with product details from a master list. Lookup brings in one column from another view, such as a price. For both, you pick the other dataset and view from the same project, then the key columns that match |
| Math Function | Profit margin: ("Revenue" - "Cost") / "Revenue". Year-over-year growth: ("This_Year" - "Last_Year") / "Last_Year". Share of total: "revenue" / SUM("revenue") * 100. For running totals and rankings, use Window Function |
| Group & Pivot | Sales by region, monthly totals, category summaries. To keep only the top 10 customers after grouping, add Show Top/Bottom Rows |
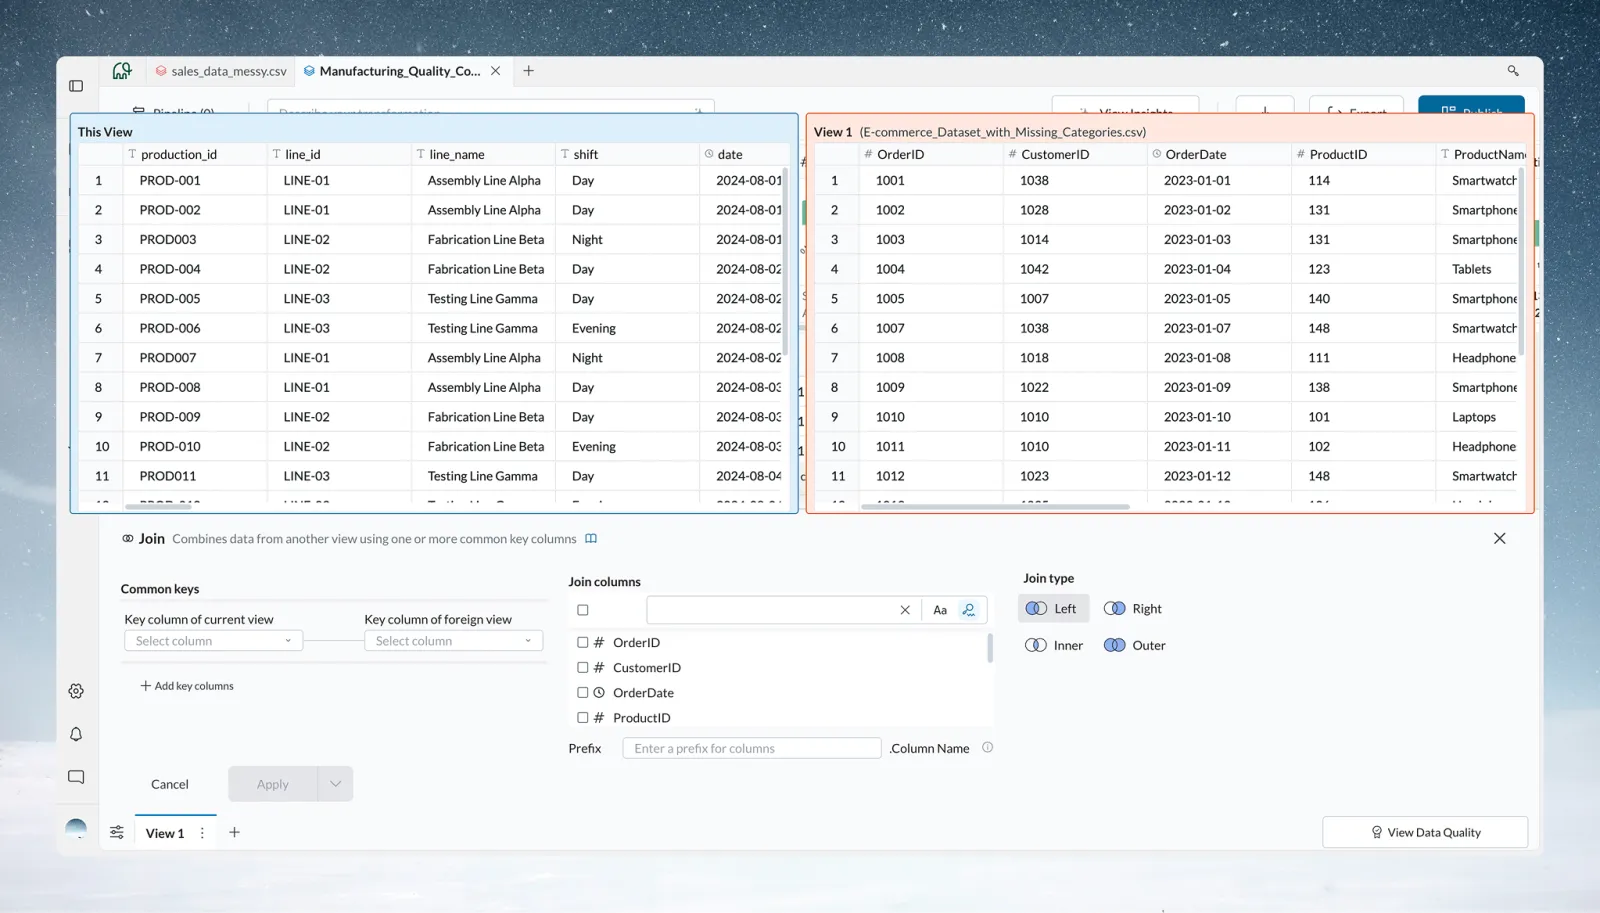
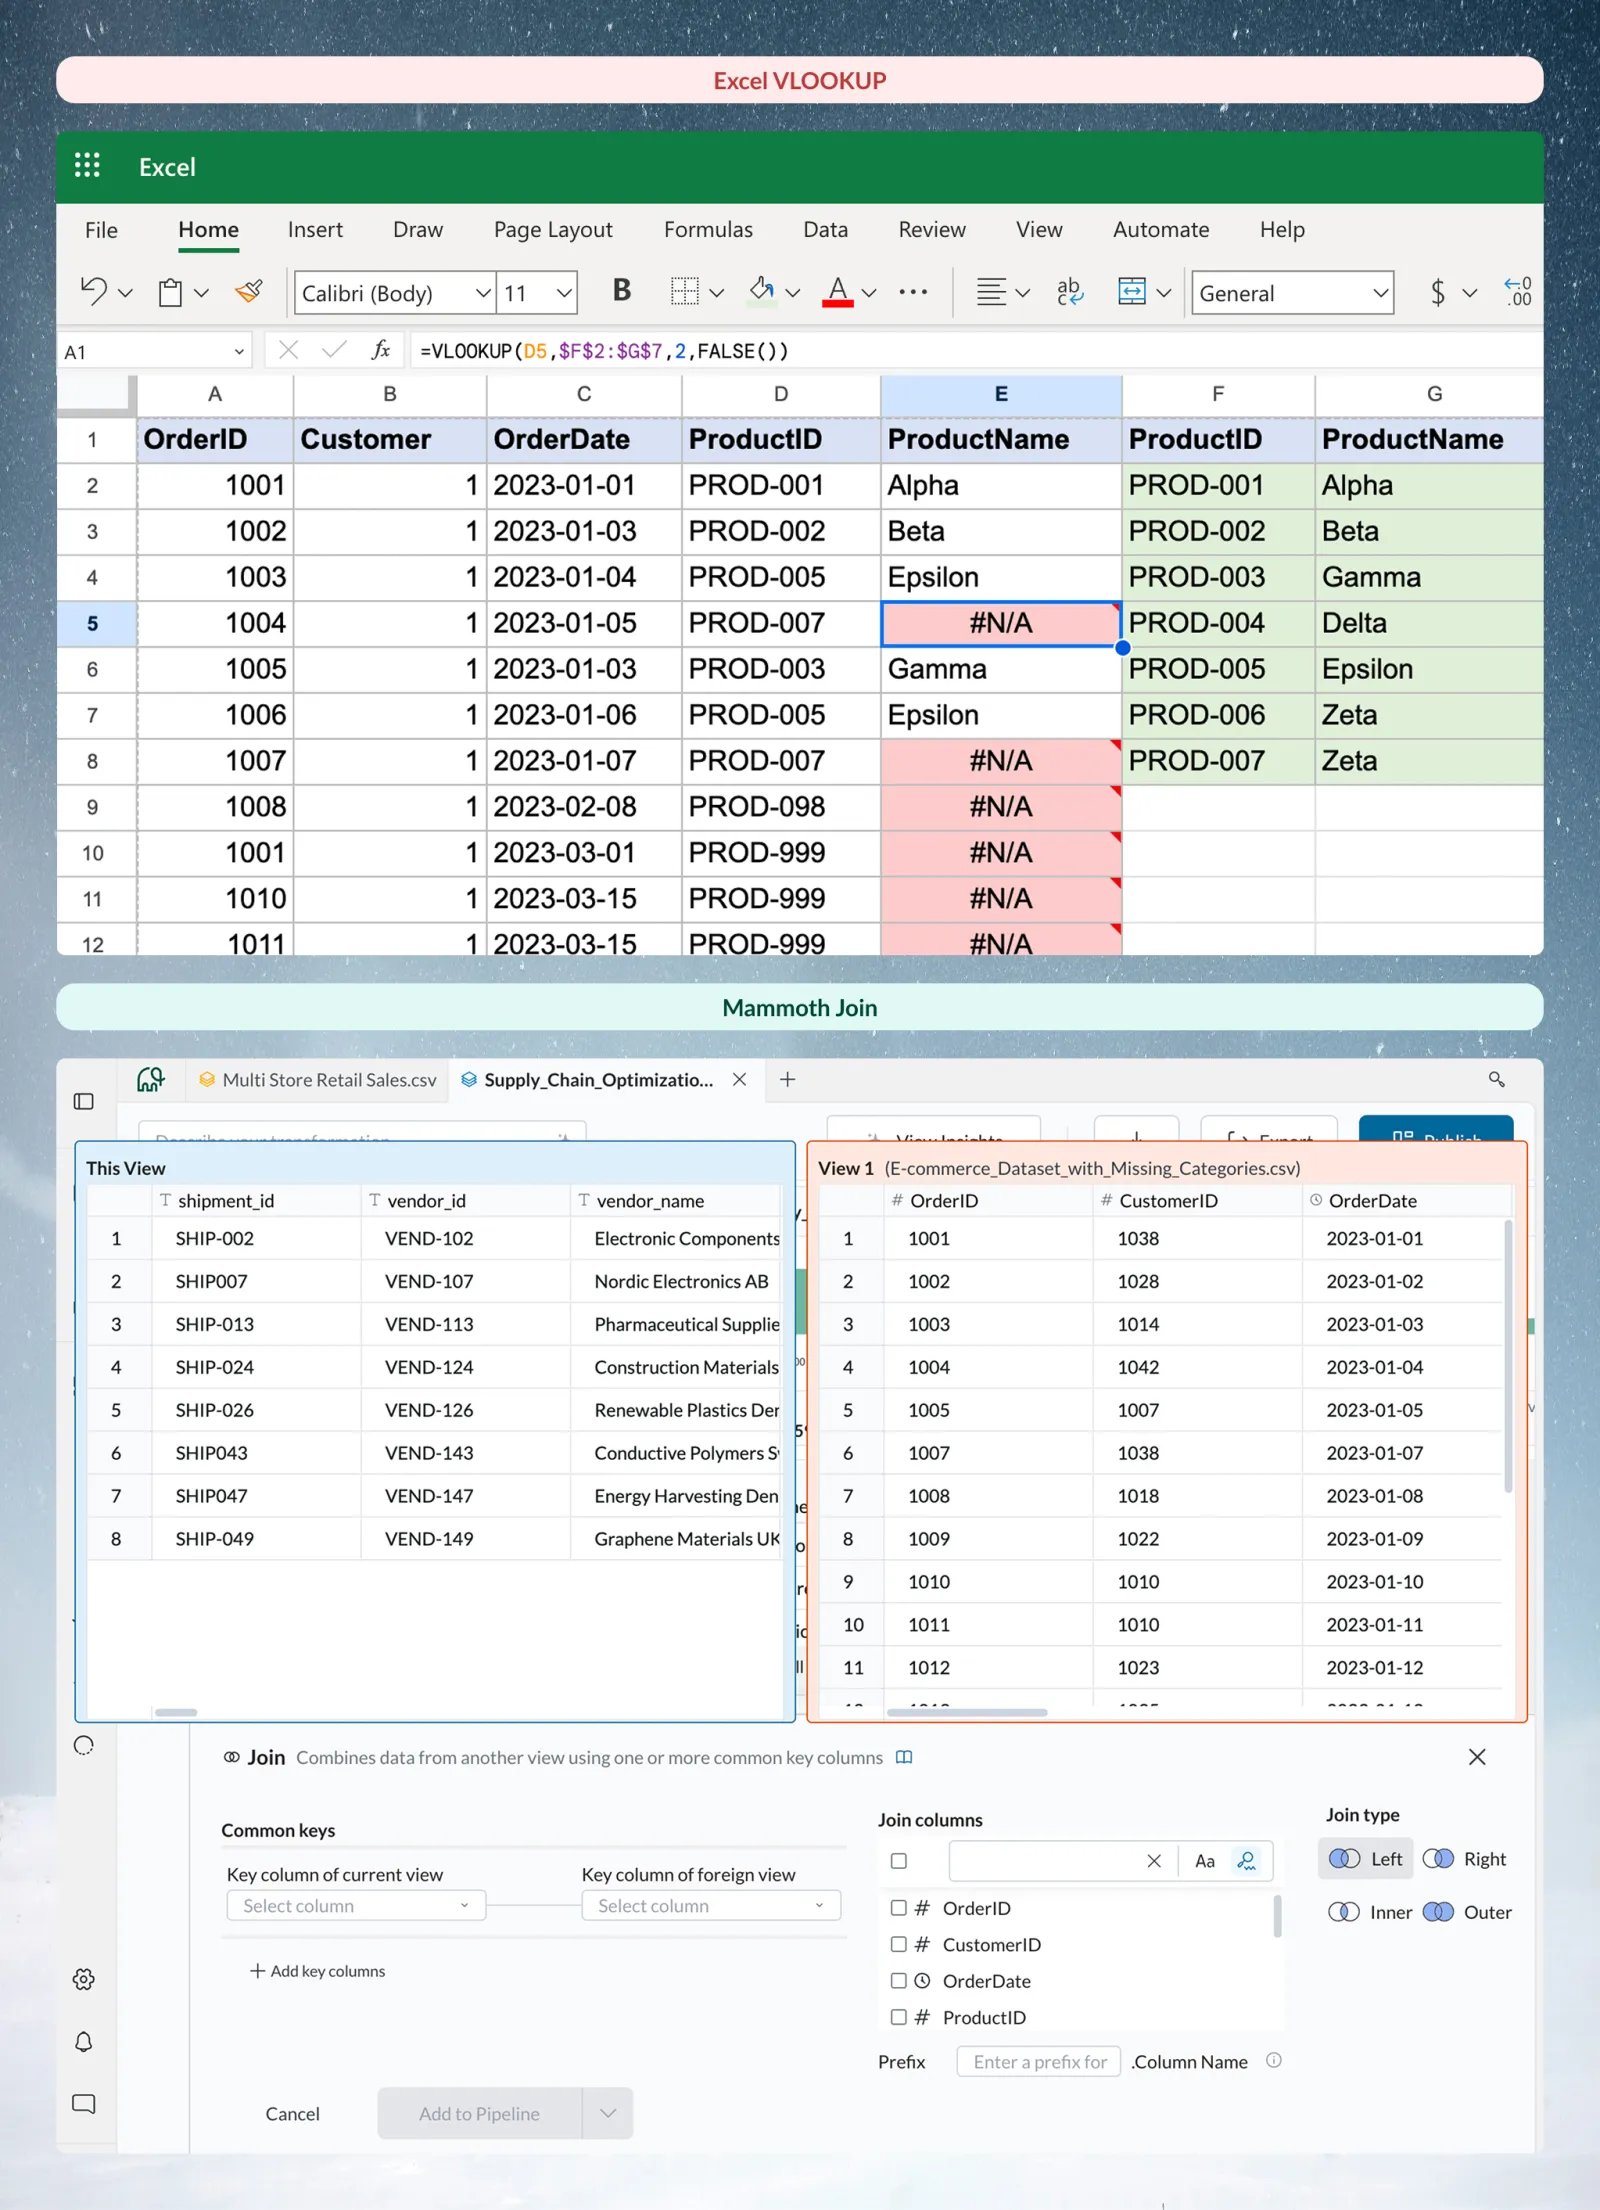
See Filter rows, Join two datasets on a shared column and Group, pivot and unpivot.
Check whether you can trust the data first
Two buttons answer "Can I trust this data, and what should I fix first?" before you build anything.
View Insights, in the action bar, surfaces observations such as inconsistent naming that fragments analysis, sparse or uneven date coverage, low repeat purchases, pricing spreads that suggest standardisation, and missing tracking. Insights don't generate on their own: click the button to run them. See View insights.
View Data Quality, in the footer of the view, builds a Data Quality Report across six dimensions: Completeness (missing values), Validity (format and rules), Uniqueness (duplicate identifiers), Consistency (mismatches and variations), Accuracy (values outside expected ranges) and Timeliness (freshness). Each view gets an overall Data Quality Score, critical issues and warnings, and recommended actions. Once a report exists, the button reads Data Quality Score followed by the score level. See Data quality report.
Describe what you want and let AI build it
The Describe your transformation box at the top of the Transform menu finds the function that matches your words, and always offers Ask in plain words with your text in its prompt.
| You type | Where | Mammoth builds |
|---|---|---|
| "Remove orders from test accounts" | Describe what you want to generate in Conditional Filter, then Generate | A filter that removes rows with test emails |
| "Standardize company names" | Bulk Replace, Grouping Settings > Smart | Suggested groups of names that mean the same thing |
| "Calculate profit margin percentage" | Describe what you want to generate in Math Function, then Generate | A SQL expression for the margin |
| "Total sales by region" | Ask in plain words prompt, then Generate | A SQL query you review and apply |
Check the result in the preview before you click Apply. To build a dashboard, click Dashboards > Create, choose your view under With my data, pick a format, and build a suggested idea or describe one, such as "sales dashboard showing revenue by region".
Common analyst problems, solved
| Problem | The Mammoth way |
|---|---|
| "I have 12 Excel files to consolidate monthly" | Add each file to the same dataset with Add data. Each file becomes a batch, the view combines them, and the pipeline runs on the new rows. To pick up files from a folder automatically, use a Data Consolidation automation (a plan feature: see What each plan decides). See Combine incoming data and Batches |
| "My VLOOKUP keeps breaking" | A Join task matches rows by the columns you choose, in a visual panel |
| "I send the same report weekly" | A Dataset Refresh automation fetches new data, the pipeline runs, the dashboard updates, and a Messaging automation or the dashboard's email updates send it |
| "Data quality issues waste my time" | Run View Insights and View Data Quality before you build, then fix issues once in the pipeline |
Your 30-day checklist
- Week 1: first dataset uploaded or connected; first pipeline with 3+ tasks; first manual workflow automated; data quality improved.
- Week 2: second workflow automated; first Join; first scheduled automation; a colleague added to the project.
- Week 3: first AI task (an Ask in plain words task or a function's AI bar); first dashboard; third workflow automated.
- Week 4: a pipeline of 7+ tasks; multi-source consolidation; a dashboard shared with stakeholders; a colleague trained.
In months 2 to 3, learn advanced joins (several sources, complex conditions), AND/OR conditions, custom aggregations and calculations, and dashboard interactivity and filters. In months 4 to 6, add webhooks and API connectors for data that arrives as it happens, Dataset Refreshes that run In a sequence (see Schedules and triggers), and performance tuning for large datasets (see Speed up pipelines and connectors). Then train colleagues on the workflows you've automated and document best practices for your team. For help in the app, hover tooltips, use the book icon (tooltip "Learn more") in a task panel's header, or click Support (the chat icon) at the bottom of the left sidebar to ask questions, report issues or share feedback. Clean and shape data covers every transformation, and Troubleshooting covers common problems.
Related
- Build your first pipeline: the five core tasks on sample data, step by step.
- Filter rows: every Conditional Filter operator.
- Find and replace values: Bulk Replace groups and rules.
- What you can automate: refreshes, consolidation and emailed reports.
- Pick your path: the plans for managers and technical users.
Something wrong? support@mammoth.io