Manage dashboards: find, tag, sync, download and delete
Every dashboard you can see is in the dashboard library, where you find, tag, sync, download and clean up the ones you've built. To rebuild a dashboard on other data or export it to Power BI or Tableau, see Change a dashboard's data or copy it. Start from Dashboards in the left sidebar. Anyone who can see the library can browse it; changing a dashboard needs edit access, which members of its project have.
Browse the dashboard library
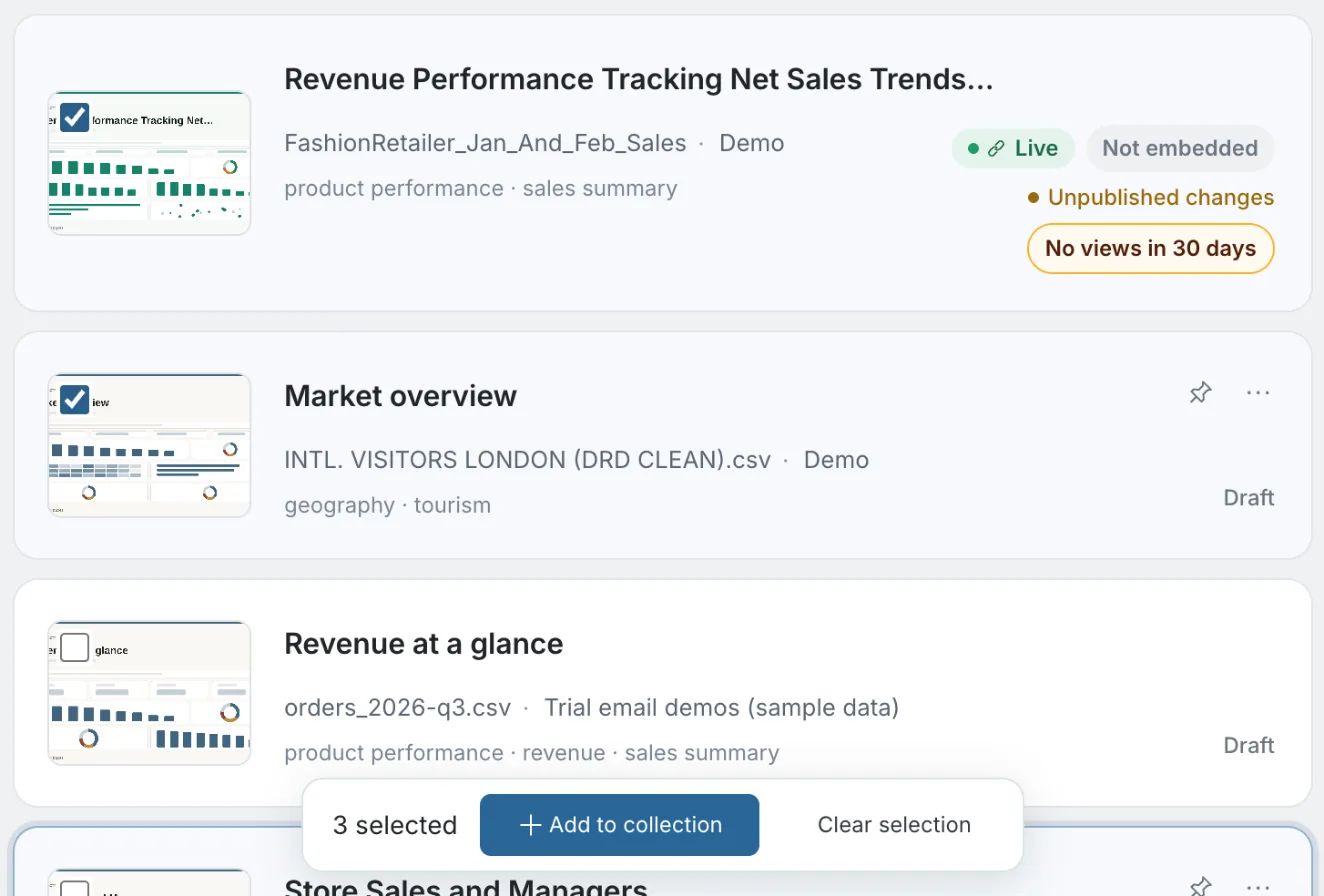
The Dashboards tab is a library of your dashboards, docs, decks and Q&A boards. Each row shows its format, name, source data, status, tags, and when it was last updated. Pills flag things that need attention, such as New data or Unpublished changes.
Show all, live or draft dashboards
The line above the list has a status switch, All · Live · Drafts, with a count on each:
| Segment | Shows |
|---|---|
| All | Every dashboard |
| Live | Published dashboards |
| Drafts | Dashboards never published |
These choices set the same Status filter as the Filter menu, so they appear in the filter chips too.
Find live dashboards nobody has viewed in 30 days
Next to the status switch, a toggle such as 4 live boards with no views in 30 days narrows the list to live boards nobody has opened in 30 days. It only appears when there is at least one. Click it again (it shows an ✕) to go back to Live. Use it to find boards to retire or to promote.
See views this week
The same line shows 38 views this week across the live boards in view, or in the open collection. When last week had at least 10 views, it adds a trend such as "▲12% on last week".
Each live row shows its views over the last 7 days, for example "38 views · 7d". A live board with no views in 30 days shows a No views in 30 days pill instead. Drafts show no views. For who viewed and what they read, see Audience and engagement.
Read the Live pill and Embedded chip
Each published row has a Live pill. For boards you can edit, an icon on it shows how the board is shared: a link for Anyone with the link, people for Sign-in required, and a lock for a password. Hover to read it ("Live — sign-in required", for example).
When the board is shared with people outside its project, directly or through a collection, the pill adds how many: 1 person or 3 people. Hover to see their names. Click the pill to open the Share panel.
A published board that is running in other sites shows an Embedded · 2 chip on its row. Hover it to read "Running inside 2 other websites". You see it on boards you can edit. To see the sites, open the row's Embeds tab.
Search, filter, sort and group dashboards
- Search by name, source, or tag.
- Filter by Project, Format, Source data, Status, Last edited by, Tags, and Collections, plus an Updated range (today, this week, this month, this quarter, or a custom range).
- Show or hide Archived items.
- Group by date or as a flat list.
- Sort by Last updated, Most viewed, Least viewed, or Date created. Mammoth remembers your sort.
- Open a collection from the shelf on the left. A collection is a set of dashboards you share as one, with its own viewer order, activity and data refresh. See Collections.
The Layout toggle at the right of the toolbar switches between List view (rows, the default) and Tile view (thumbnails). In Tile view, the format and status sit on the thumbnail and views move to a strip under it. Mammoth remembers your choice.
Use the dashboard details panel and row menu
Click a row to open its details panel. There you can rename the dashboard, add tags and collections, and click Edit, Preview, or Share. Double-click a row, or click Edit, to open the editor.
The panel has tabs for Audience, Updates, Sources, Access, and Embeds:
| Tab | What it shows |
|---|---|
| Audience | How a published dashboard is used: who opened it, views, engaged time, who hasn't opened it yet, and top readers. Full report → opens the full engagement report. For a draft it reads Publish to start counting. Your own visits are never counted. See Audience and engagement. |
| Updates | The data sync status. See Sync new data into a dashboard. |
| Access | Who can open the dashboard, with Share. |
| Embeds | The sites the board has been loaded from, with loads in the last 7 days and any refused sites. See Embedding. |
Each row's ⋯ menu has Rename, Archive, Embed, Add to collection, Remove from collection, and Delete. You can also pin a dashboard to the top of the list. Pins are stored in your browser.
Tag a dashboard
- Select the dashboard's row.
- Click Add tag in the details panel.
- Type in Find or create a tag… and pick an existing tag, or click Create "Finance" to make a new one.
To remove a tag, click the ✕ on its chip.
Preview a dashboard as viewers see it
Preview in the details panel opens the board in an overlay, as viewers see it, without leaving the library. Close it with Close or Esc.
| Board state | What Preview shows |
|---|---|
| Published and up to date | The live board, with the banner "This is what viewers see" |
| Published, with unpublished changes | The live version, which is older than your draft ("Opens the published version, which is older than your draft") |
| Never published | Your draft, with the banner "Your draft — nobody can see this yet" |
Add several dashboards to a collection at once
- Tick the checkbox on each row. Checkboxes appear only on dashboards you can edit. Shift-click to select every row between the last one you ticked and this one.
- A bar appears with 3 selected.
- Click Add to collection and pick the collection. Or click Clear selection to start over.
Drafts you add are published first. All the selected dashboards must be in one project. Otherwise Add to collection is greyed out: "Pick dashboards from one project to add them to a collection together". Dashboards you filter out, archive or delete drop out of the selection.
For everything else a collection does, see Collections.
Save edits, then publish them
Open a dashboard in the editor and keep working with the AI chat, the Design tab, and the Add menu. See Edit with AI in the dashboard editor.
Saving is explicit. The editor shows Unsaved changes until you save, and you can't publish while changes are unsaved. Saving doesn't change what viewers see: a published dashboard stays as it was until you publish again. Use History to review earlier versions of your edits.
Draft and published dashboard versions
Mammoth dashboards have two states:
| State | What it is |
|---|---|
| Draft | The working version you edit. Changes here are only visible to you and other editors until published. |
| Published | The version that viewers and shared users see. |
The editor header shows Live or Draft, with extra pills such as New data and a count of unpublished changes. To review or discard those changes, see Discard unpublished changes to a dashboard.
Mammoth tracks two types of changes separately:
- Data changes: new data from your sources.
- Presentation changes: layout, style, filters, and chart configuration.
To publish your changes:
- Save your edits.
- Open Share and click Publish.
- Viewers now see your changes.
See Publish and share a dashboard.
Sync new data into a dashboard automatically
A dashboard shows the data from its sources as of the last sync. To see how current it is, open the Updates modal from the library or from the editor's state line. It shows three steps: Sources, Draft, and Live.
| Stage | What it does | Automatic option |
|---|---|---|
| Sync new data | Pulls new rows into your draft. Each source has its own Sync button. There's no single button that syncs all sources. | Sync automatically brings new rows into your draft whenever the pipeline runs. |
| Publish | Lists Data changes and Presentation changes waiting to go live, with a Publish button. | Publish new data automatically sends new data live as soon as it syncs. Layout and style changes still wait for you to publish. |
With both toggles on, new data flows from your source to the published dashboard without manual steps.
Download a dashboard as PDF, PNG or PowerPoint
The caret next to the Publish button opens more actions:
| Action | What it does |
|---|---|
| Download PDF | Captures a static snapshot of the dashboard. |
| Download PNG of this page | An image of the page you are on. |
| Download PowerPoint | The dashboard as a .pptx deck. |
| Share as carousel… | Image cards for a LinkedIn post. See Publish and share a dashboard. |
| Export to Power BI / Export to Tableau | Dashboards only. See Export a dashboard to Power BI or Tableau. |
| Copy link | Copies the dashboard link. |
| Embed | Embeds the dashboard. See Embedding. |
| Add to collection | Adds it to a collection. |
| Duplicate | Copies the dashboard. |
| Change data | Rebuilds this board on other data (Use my data while on sample data). See Change a dashboard's data or copy it. |
| Copy onto another dataset | Builds a new board from this one on other data. See Change a dashboard's data or copy it. |
| Save as template | Saves it as a workspace template. See Start from a template. |
Duplicate a dashboard
Open the dashboard in the editor and choose Duplicate from the Publish caret menu. The copy opens in the editor. Duplicate isn't in the library's row menu.
Archive or delete a dashboard
Archive hides a dashboard from the library. Show archived items with the Archived filter, and use Restore from archive to bring one back.
Delete moves a dashboard to Trash:
- In the library, open the row's ⋯ menu and click Delete.
- Confirm in the dialog. If the board is embedded, the dialog warns "Deleting breaks 2 embeds: intranet.example.com, wiki.example.com".
A deleted dashboard is unpublished, so its share link stops working. You can restore it from Trash during the Trash retention period. A restored dashboard comes back as a draft and keeps its link and sharing settings, so publishing again is one click. See Get things back from Trash.
Who can see and edit a dashboard
Each dashboard belongs to a project, and everyone in that project has access to it. People you invite from the Share panel are always viewers. See Publish and share a dashboard.
Limits
- Bulk Add to collection: all selected dashboards must be in one project.
- A dashboard whose pages read more than one table can only be copied within its own project, can't be saved as a template, and can't be exported to Power BI or Tableau. See Change a dashboard's data or copy it.
Troubleshooting managing dashboards
| Message | Cause | Fix |
|---|---|---|
| "Pick dashboards from one project to add them to a collection together" | The selection spans projects. | Select dashboards from one project. |
Related
- Edit with AI in the dashboard editor: History and discarding unpublished changes.
- Change a dashboard's data or copy it: rebuild on other data, copy, or export to Power BI and Tableau.
- Publish and share a dashboard: publish, share links and the carousel.
- Collections: share several dashboards as one.
- Audience and engagement: who reads your dashboards.
- Fix dashboard problems: stale data, blank boards and share links.
Something wrong? support@mammoth.io