Build reusable pipeline templates for business users
A pipeline template is a saved pipeline that business users apply to their own view and run without code. You save it from More Pipeline options (...) > Pipeline Version history and apply it from a view's View Settings. This page is part of Mammoth for technical users.
Turn a recurring request into a template
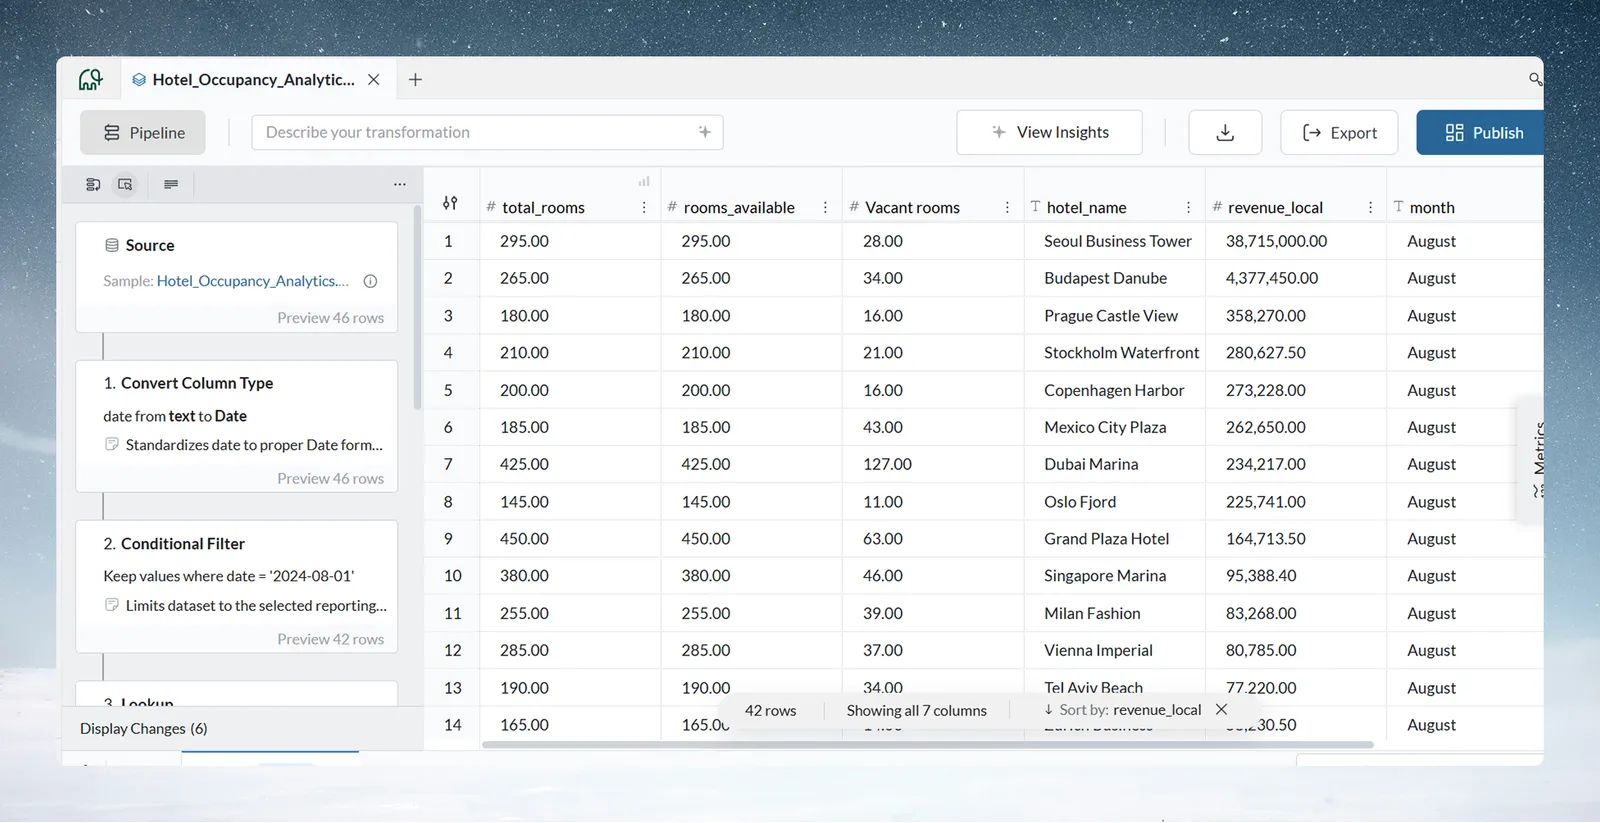
Pick a first person to enable: someone who asks you for help often, is keen to learn, has representative requests and knows Excel well. Turn one of their recurring requests into a template. To practise on the Hotel Occupancy Analytics sample file:
- Convert
datefrom text to Date. - Filter to the reporting month (
2024-08-01). - Lookup each hotel's region from a reference view, matched on hotel_id.
- Math Function for a new column
Vacant_rooms:"total_rooms" - "rooms_occupied". - Group & Pivot to summarise the month, for example a count and sums by region.
To order the result, use Sort in a column's menu (a display setting, not a pipeline task). Give each task a note (Add note in its menu) saying what it does, why, and when to change it ("change month filter here").
To save it as a template:
- Open More Pipeline options (...) > Pipeline Version history.
- Select the version you want and click Save as template.
- Mammoth downloads a
.mammothfile. Name it clearly, for examplehotel_occupancy_monthly_performance.mammoth, and keep it where your team can find it.
To reuse it, open the target view in the Data Library, click the gear (View Settings), choose Apply template, and pick the file. Apply template only works on a view with no tasks yet; Save as a template in the same menu saves the current pipeline. Copy pipeline or Copy tasks in Pipeline Version history paste tasks into another view.
Then train the person: walk through each task's business logic, have them change the month filter while you watch, then run it alone. They succeed when they can run it independently and explain each task.
Example: a retail transactions template
A retail transactions template (Store_Transactions_Analysis, 10 tasks) on point-of-sale data might filter departments and categories, calculate Total Value from Quantity and Price, standardise categories with Bulk Replace, adjust dates, extract Quarter, normalise text casing, limit scope, label rows by business rules, aggregate with Group & Pivot, and rank with Window Function.
Related
- Edit, reorder and copy tasks: version history, Save as template and copying tasks.
- Parameters and snippets: reuse values and tasks across pipelines.
- SQL and advanced tasks: logic you can put in a template.
Something wrong? support@mammoth.io