Add pages to a dashboard and set up navigation
When your dashboard covers several topics or audiences, split it into pages. Each page has its own charts, so readers can focus on one topic at a time. You add pages from Add → Page in the editor header, change their structure in the Design tab, and rename or reorder them in Manage pages; anyone who can edit the dashboard can do this.
Pages are a Dashboard-format feature. Docs and Slides have their own structure: see Docs and slides.
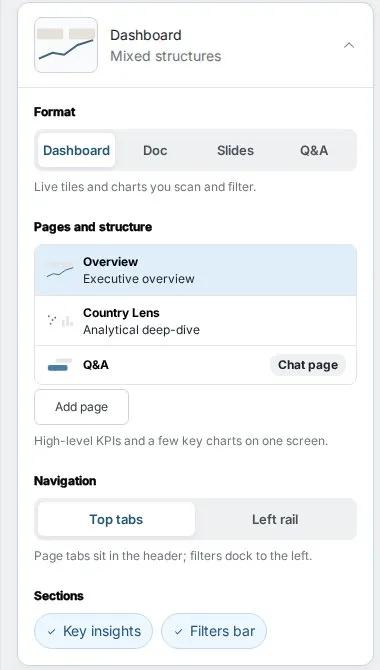
Choose page tabs or a left rail for navigation
In the editor, open the Design tab. Under Format, set Navigation:
| Option | What it does |
|---|---|
| Top tabs (default) | Page tabs sit in the header; filters dock to the left. |
| Left rail | A vertical rail holds pages and filters together. |
Add a page to a dashboard
- Click Add in the editor header, then Page.
- Under Select type, pick the kind of page.
- For a layout type, optionally type a Page title…. Leave it empty for Mammoth to name it.
- Click Create page.
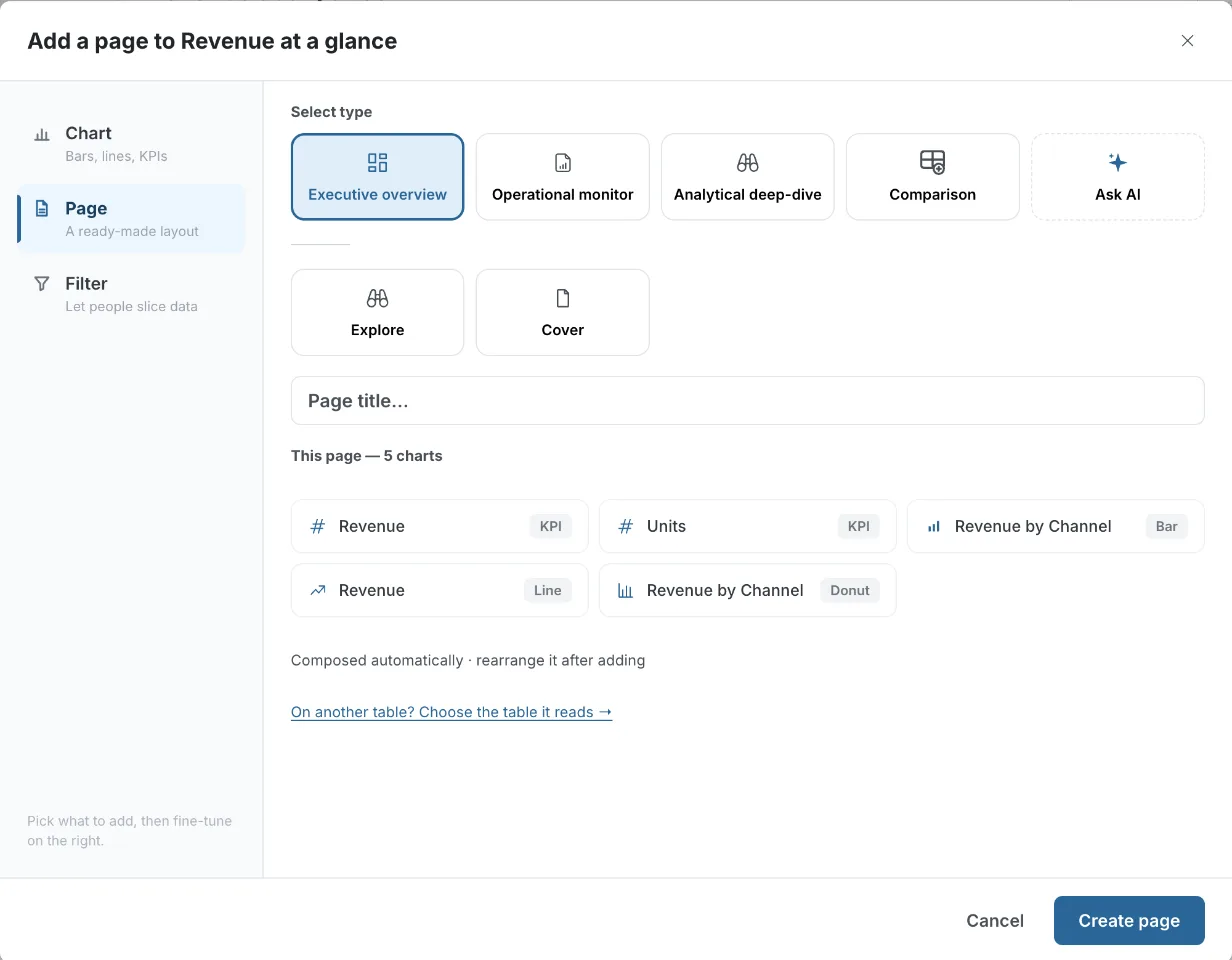
For the three layout types (Executive overview, Operational monitor, Analytical deep-dive), the panel previews the charts the page will get ("Composed automatically · rearrange it after adding").
Dashboard page types
| Type | What you get |
|---|---|
| Executive overview | High-level KPIs and a few key charts on one screen. |
| Operational monitor | Dense current-state view: live metrics, tables, exceptions. |
| Analytical deep-dive | Everything visible at high density for exploration. |
| Comparison | A column's values head-to-head, as a scorecard with the leader marked. You pick what to compare on the canvas right after adding. See Set up a Comparison page. |
| Ask AI | AI drafts the page from your description: any mix of KPIs, charts and text. |
| Q&A | A page where people ask questions and get answer cards grounded in your data. See Explore and Q&A pages. |
| Explore | A read-only page where readers dig through the data themselves, with column summaries, drill-down and a data grid. See Explore and Q&A pages. |
| Cover | A starter page that orients readers: a branded title page. You choose its style and wording on the canvas. See Title band and cover page. |
Some types have rules:
- Q&A and Cover: a dashboard holds only one of each. Once the page exists, the type drops out of the list.
- Cover appears only when the dashboard has at least one content page to orient.
- Explore is greyed out with Not with row security while row-level security is on.
Have the AI draft a page from a description
Pick Ask AI and describe the page, for example "supplier performance by region and spend". The preview updates as you type.
Nothing is added empty. If the page can't be composed, you see "Couldn't compose the page. Try a different description." with Recompose.
Ask the AI chat to add or split pages
You can also ask the AI chat in the editor:
"Add a new page called 'Customer Insights'"
"Split the dashboard into two pages: one for quarterly results and one for team performance"
When you describe content across several distinct topics when you create a dashboard, the AI can propose a multi-page structure. For example: "Create an executive dashboard with sales performance, marketing metrics, and operations KPIs". See Create a dashboard.
Change a page's layout structure
A page's structure is its layout variant: the same content, arranged differently. New dashboards start with Executive overview.
- Open the Design tab. Under Format, find Pages and structure. It lists one row per page.
- Click a chart page's row to open its structure picker.
- Pick Executive overview, Operational monitor, Analytical deep-dive or Comparison.
- The row shows Previewing, and the canvas shows the new layout. Click Save to keep it or Discard to go back.
Cover, Q&A and custom pages show a badge (Cover, Chat page, Custom page) instead of a picker, so you can't change their structure here. Add page sits under the list.
While a new structure is previewing, editing is paused until you save or discard it. See Save or discard a format preview.
Try a new layout on a copy of the page
If you added charts, changed a chart, or hid tiles on the page, Apply to a copy appears next to Save. It keeps this page as saved and puts the new structure on a duplicate. Your added charts and styling carry over. Use it to try a different layout without losing your hand edits.
Set up a Comparison page to compare regions or products
A Comparison page puts a column's values side by side, for example two regions, products or teams, with the leader marked. Readers can change what is compared while viewing.
- Add one with Add → Page → Comparison, or switch an existing page's structure to Comparison.
- Open Design → Format → Comparison settings…, or click the compare bar on the canvas. The Comparison panel opens.
- Choose the settings below.
| Setting | What it does |
|---|---|
| Starting view → Preset comparison | You choose what readers see first. Set Compare by (a field, grouped into Suggested and All fields) and Default subjects (up to 4). Readers can change it while viewing, but their choice isn't saved. |
| Starting view → Viewer chooses | The page opens with a Compare button, and each reader picks the field and subjects themselves. |
| Fields viewers can compare | The fields readers are allowed to pick. |
Default subjects start as the top 2 values by the page's main metric. If fewer than two values qualify, the page opens as Viewer chooses.
How readers change a comparison
- Click Compare to open the dialog ("Pick a field, then the subjects to put side by side").
- Choose a Field.
- Choose up to 4 Subjects.
- Click Compare.
Charts that can't be compared are hidden. The panel warns you, for example: "2 chart(s) on this page can’t be compared and will be hidden." See Which charts work on a comparison page.
Add a page that reads another table
A dashboard can read up to 5 tables from the same project. Each page reads one table, and every chart on that page reads it. A chart never reads two tables: to combine tables in one chart, join them in the data editor or a pipeline first (see Join two datasets on a shared column).
Start from any of these. They appear only for the Dashboard format, on a saved dashboard.
- Data tab → New page from another table ("Every chart on the new page reads that table."). See See the data behind a dashboard.
- Add → Page → On another table? Choose the table it reads →.
- On a dashboard that already reads more than one table, Add → Page says "This dashboard reads more than one table" and the button reads Choose a table.
The New page panel has these controls:
| Control | What it does |
|---|---|
| Page name | Defaults to the table's name. |
| This page reads | The tables in the dashboard's project, with Search tables. Tables already in use show which pages read them; the dashboard's original table shows This board's table. |
| Row security | Shows only when row-level security is on, with the security column's name, for example Row security · Region. Tells you whether the table has it or is missing the security column. If it's missing, you get links to open that table's pipeline (for example Open Orders pipeline) and Row security settings. |
| Filters on every page | Shows whether each dashboard filter covers this page too or stays on the other pages. Date uses picks this page's date column. A filter covers every page when every page's table has that column, with the same name and type. |
| Start with | A suggested layout (built from the table's columns, with a preview) or A blank page. |
Click Create page. You see a message such as "Added Returns, reading Orders."
Messages when adding a page on another table
| Message | What to do |
|---|---|
| "This board already reads 5 tables, the most a board can read. Pick a table it already reads, or combine tables in the data editor first." | Pick a table already in use, or combine tables first. |
| "This table belongs to a different project than the dashboard. Pick a table from the dashboard's project." | Pick a table from the same project. |
| "Orders has no Region column, so this page can't be added while row security is on. Add the column in its pipeline, or turn row security off." | Add the security column in that table's pipeline, or turn row security off. |
| "Orders has no date column, so the date filter won't cover this page." | Expect the date filter to skip this page, or add a date column. |
| "No other tables yet. Add data in the Data library, then come back." | Add data first. See Choose how to bring data in. |
What a dashboard on several tables can't do yet
A dashboard that reads more than one table:
- Can only be copied within its own project.
- Can't be saved as a template.
- Can't be exported to Power BI or Tableau.
To do any of these, use a dashboard that reads one table, or combine the tables in the data editor first. See Manage your dashboards.
Rename, duplicate, reorder or delete dashboard pages
Open Manage pages from the pencil on the page tabs on the canvas. For each page you can:
| Action | What it does |
|---|---|
| Drag handle | Drag, or use arrow keys, to reorder. |
| Rename | Change the page's name. |
| Duplicate | Copy the page. Not available for Cover or Q&A pages ("A dashboard can hold only one of these"). |
| Delete | Remove the page. You see a notice such as "Deleted “Marketing”" with Undo. You can't delete the last page. |
| Explore settings | Shown on Explore pages only. See Choose what readers can explore. |
Add page at the bottom opens the Add page flow. Click Done when you're finished.
You can also use the AI chat: "Move the Marketing page to be the first tab".
How filters work across dashboard pages
Each filter has a scope: Every page or This page. A filter set to every page applies across the whole dashboard. On a dashboard with several tables, it only reaches pages whose table has its field. See Make a filter apply to every page or one page.
Preview pages on desktop, tablet and mobile
Use the viewport switch in the editor header to preview Desktop, Tablet and Mobile layouts and check how your pages look on each.
Limits
- Up to 5 tables per dashboard, all from the dashboard's project. Each page reads one table.
- One Q&A page and one Cover per dashboard.
- Comparison pages: up to 4 subjects at once ("Up to 4 subjects"). Comparison settings… only shows when the table has fields that can be compared.
- Explore pages aren't available while row-level security is on.
- You can't delete the last page.
Related
- Filters: scope filters to one page or every page.
- Title band and cover page: style the cover page.
- Explore and Q&A pages: the two pages readers interact with.
- See the data behind a dashboard: the tables each page reads.
- Change a dashboard's theme: format and structure previews.
- Change a dashboard's data or copy it: copy and export rules for multi-table boards.
Something wrong? support@mammoth.io