Mammoth core ideas: workspaces, projects, datasets, views
Mammoth organises data work in seven nested levels: a workspace holds projects, a project holds datasets, each dataset holds batches of rows and opens in one or more views, and each view has a pipeline of tasks. Data flows from a source into a dataset, through a view's pipeline, and out to an export or dashboard. Learn views and pipelines first, because the rest builds on them.
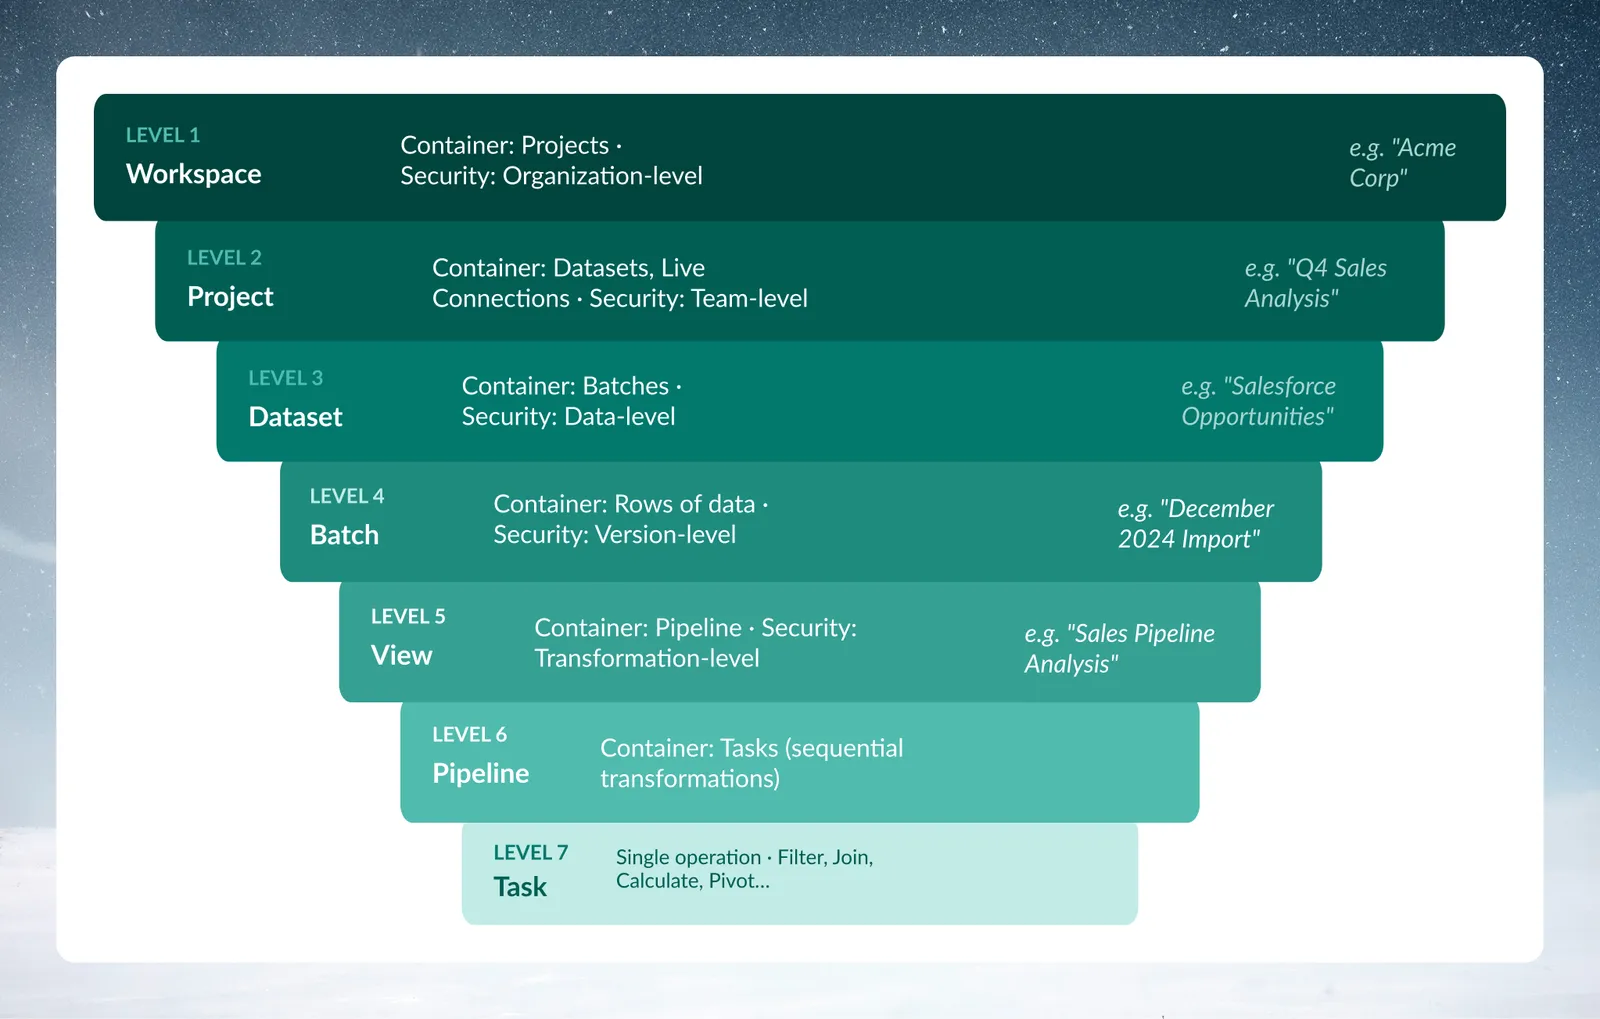

The seven levels at a glance
| Level | Container | What it holds | Access set by | Roles |
|---|---|---|---|---|
| 1 | Workspace | Projects, users, plan | Workspace membership | Workspace Owner, Workspace Member |
| 2 | Project | Datasets, connections, automations, dashboards | Project membership | Project Admin, Project Editor, Project Viewer |
| 3 | Dataset | Batches and views | The project | Project role |
| 4 | Batch | Rows of data | The project | Project role |
| 5 | View | A pipeline | The project | Project role |
| 6 | Pipeline | Tasks | The project | Project role |
| 7 | Task | One operation | The project | Project role |
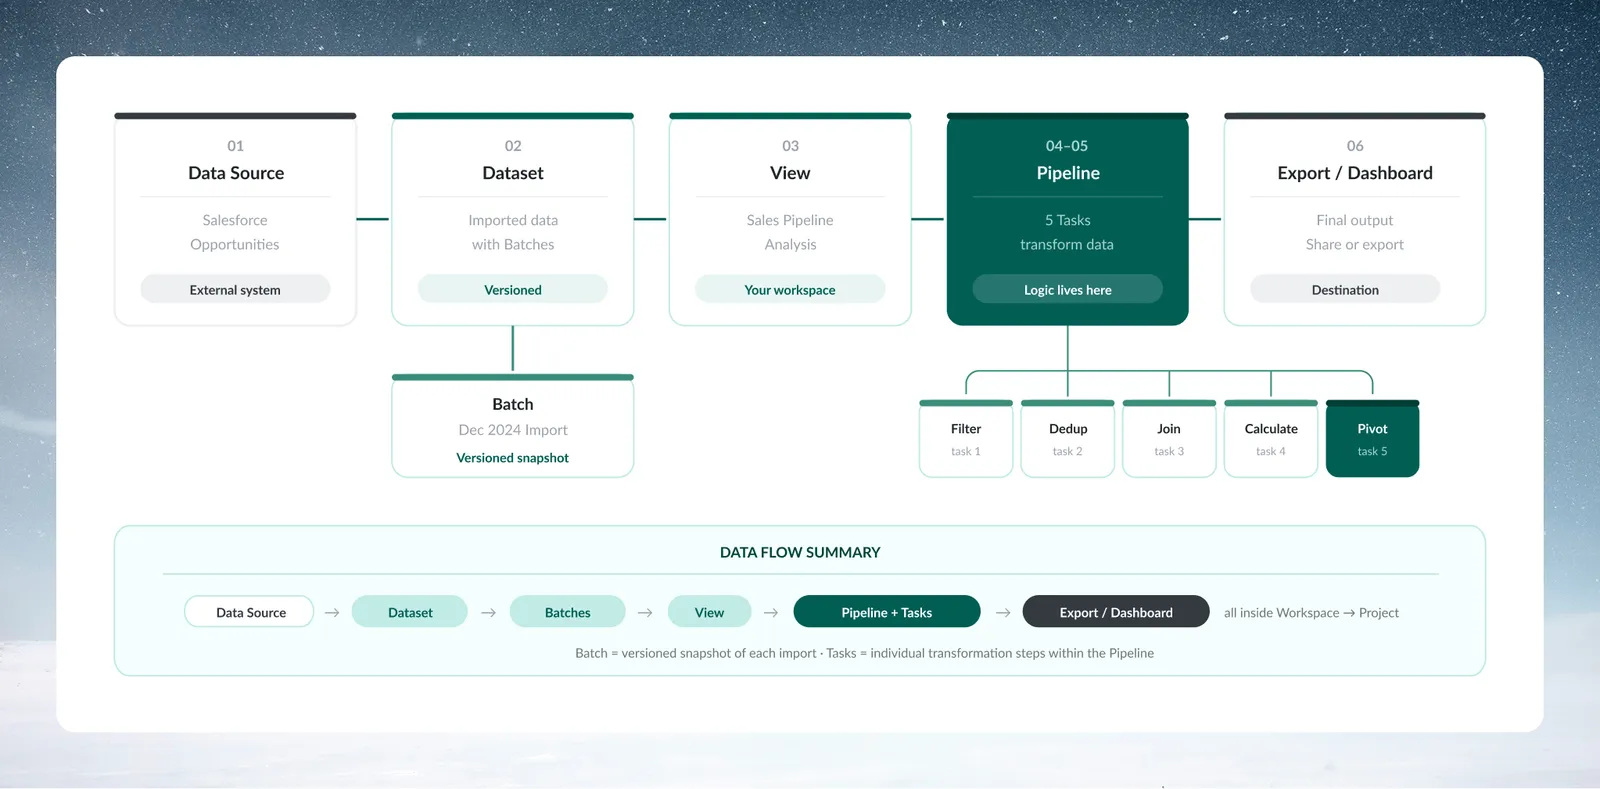
Workspace: your organisation's Mammoth account
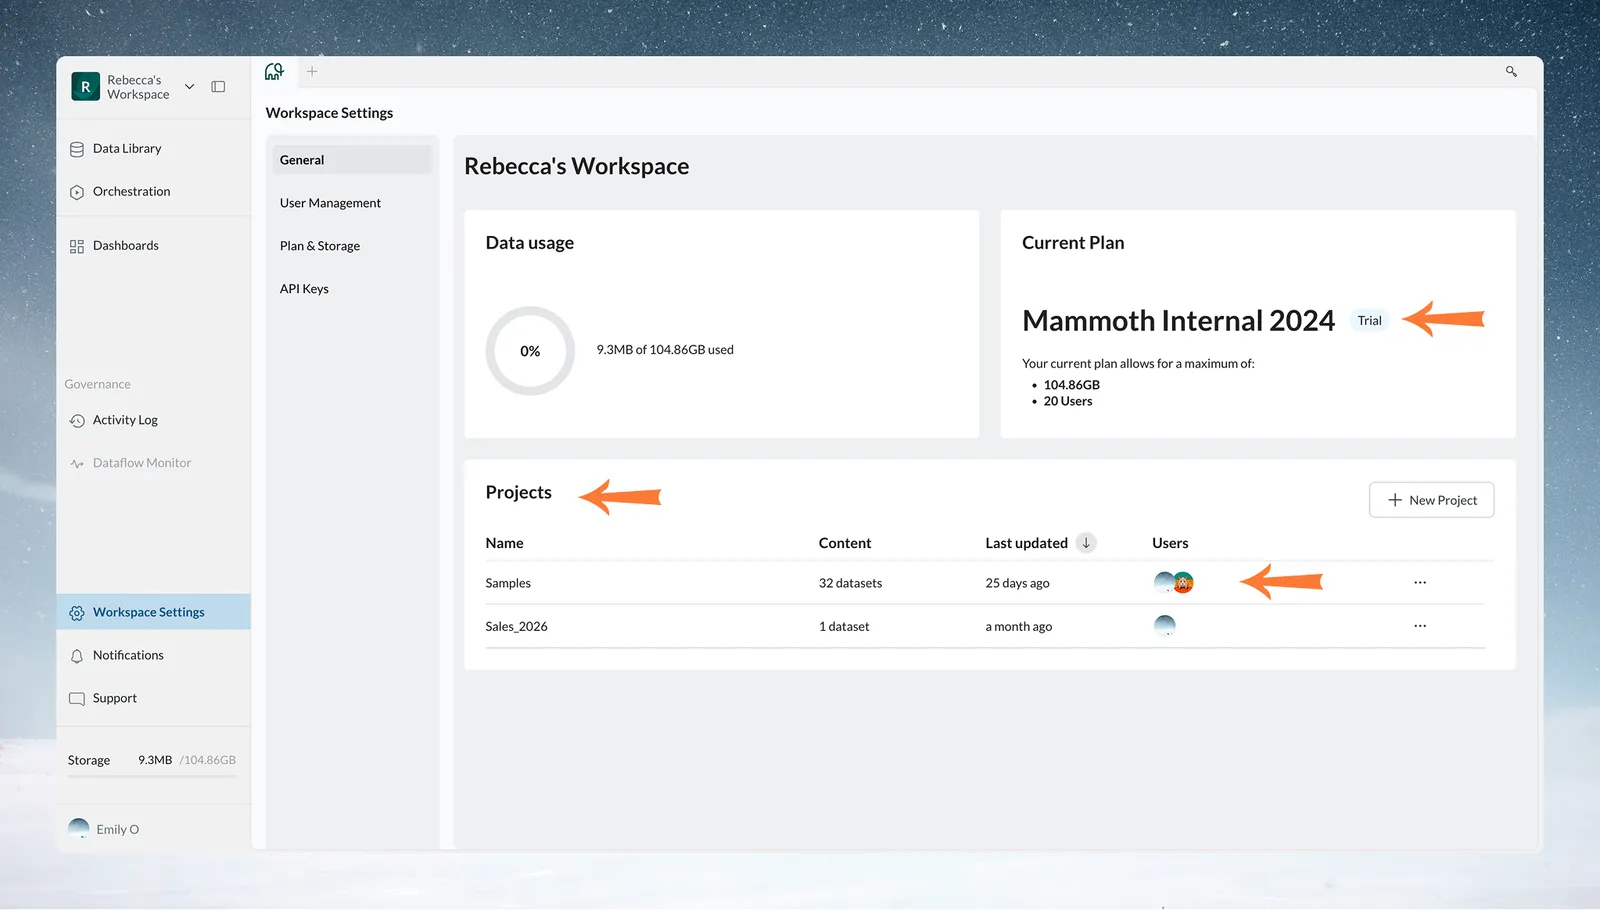
A Workspace is your organisation's Mammoth environment, like a Google Workspace or Slack workspace. When you sign up, you create or join one. It holds your plan and billing, your users and their workspace roles, workspace settings, and all your projects. You can belong to more than one workspace, and each is kept separate from the others.
Your plan sets the workspace's storage, user count and other allowances. See Limits and quotas.
You work at the workspace level when you set up your account, add or remove team members, manage the plan, or, as an Owner, look across projects.
What Workspace Owners and Workspace Members can do
There are two built-in workspace roles. A workspace can have more than one Owner.
| Role | Can |
|---|---|
| Workspace Owner | Manage the subscription, payment settings and plan. Invite, change and remove workspace users. See every project's name, add users to any project, and delete any project. Add, edit and delete external service API keys |
| Workspace Member | Create projects. Create and delete workspace API tokens. View and export the Activity Log. Work in the projects they are added to, with the project role they are given |
On the Pro plan you can also build custom workspace roles. For every capability, see Members, roles and custom roles.
Project: a separate area for one team
A Project is an area in the workspace for one team, department or initiative, like a shared drive with its own member list. Every dataset belongs to exactly one project. A project holds:
- datasets, folders and views, listed in its Data Library;
- connections to databases and apps, with their credentials;
- automations, Parameters and Snippets;
- dashboards built on its data.
People see a project's data only when they are a member of it. The project's access setting is Everyone in this workspace, Some people in this workspace or Only me. Connection credentials are stored with the project, so database access is controlled at the team level. See Projects.
Project Admin, Project Editor and Project Viewer
| Role | What it can do |
|---|---|
| Project Admin | Edit project settings, add and remove members, create, update and delete connections, delete the project, plus everything an Editor can do. The person who creates a project is its Project Admin. |
| Project Editor | Create, edit and delete datasets, views and pipelines, and create or change queries from connections. Can't manage project settings or members. |
| Project Viewer | View Data Library items, read-only. |
On the Pro plan you can add custom project roles.
Organise projects by who needs access
Teams usually organise projects by department ("Marketing", "Finance", "Operations"), by initiative ("Q4 Sales Analysis", "Customer Churn Study"), or by data source ("Salesforce Data", "Financial System Data"). Base projects on who needs access to which data, not only on your org chart. Connections belong to one project, so two teams that use the same database credentials either share a project or each set up their own connection.
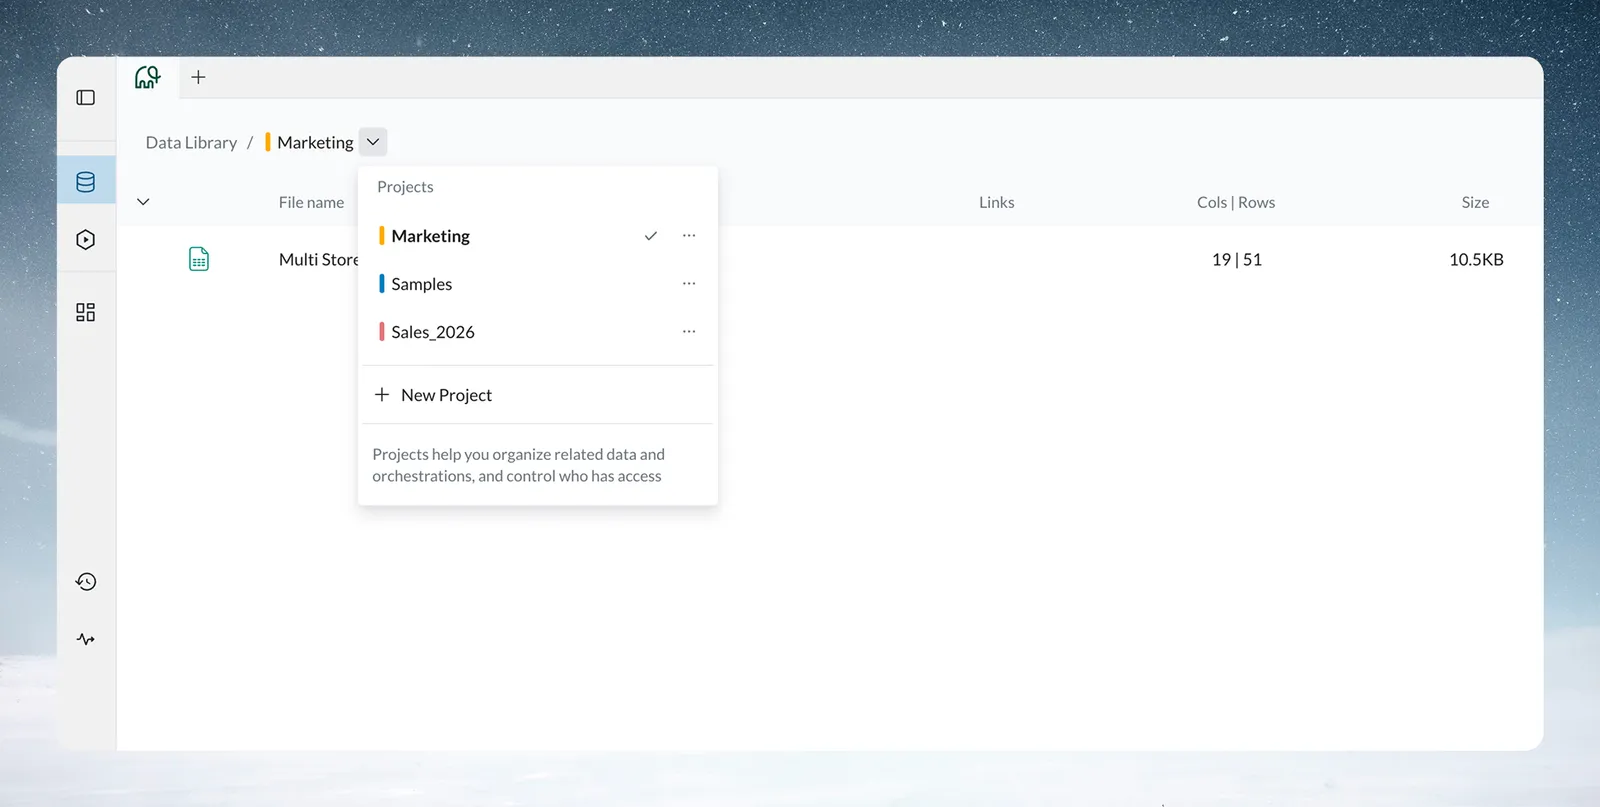
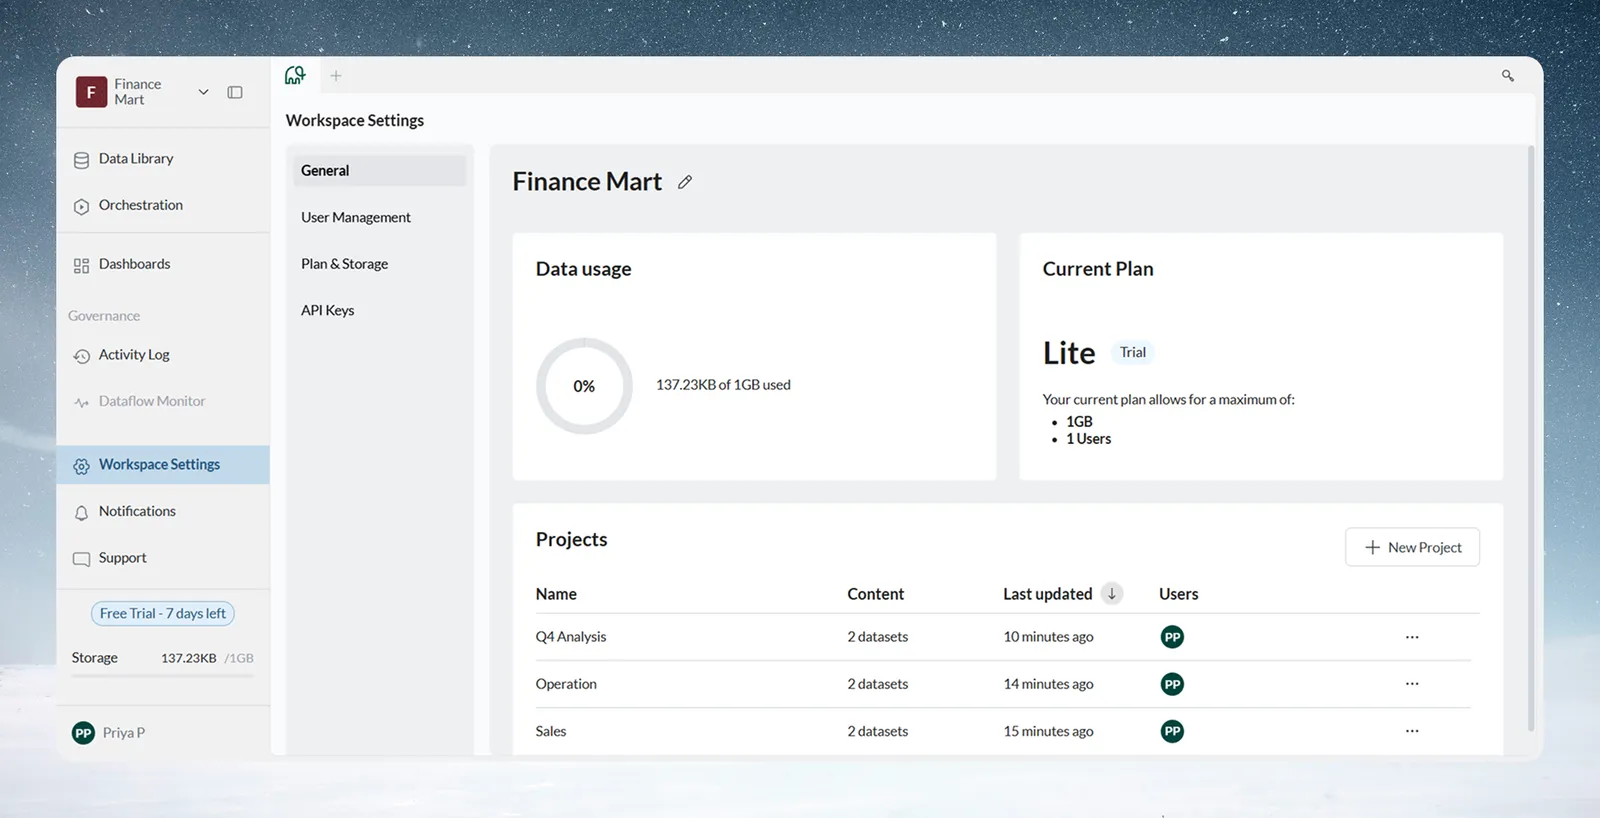
You can also see the project list in Workspace Settings.
Dataset: your imported data
A Dataset is your data, imported into Mammoth. When you upload a CSV, connect to a database or pull from an API, Mammoth creates a dataset with its columns and their types, its source, and one or more batches of data.
Files, database queries and API responses all become datasets, and you work on them the same way. Mammoth reads column types on import, and you can change a type later with a Convert Column Type task.
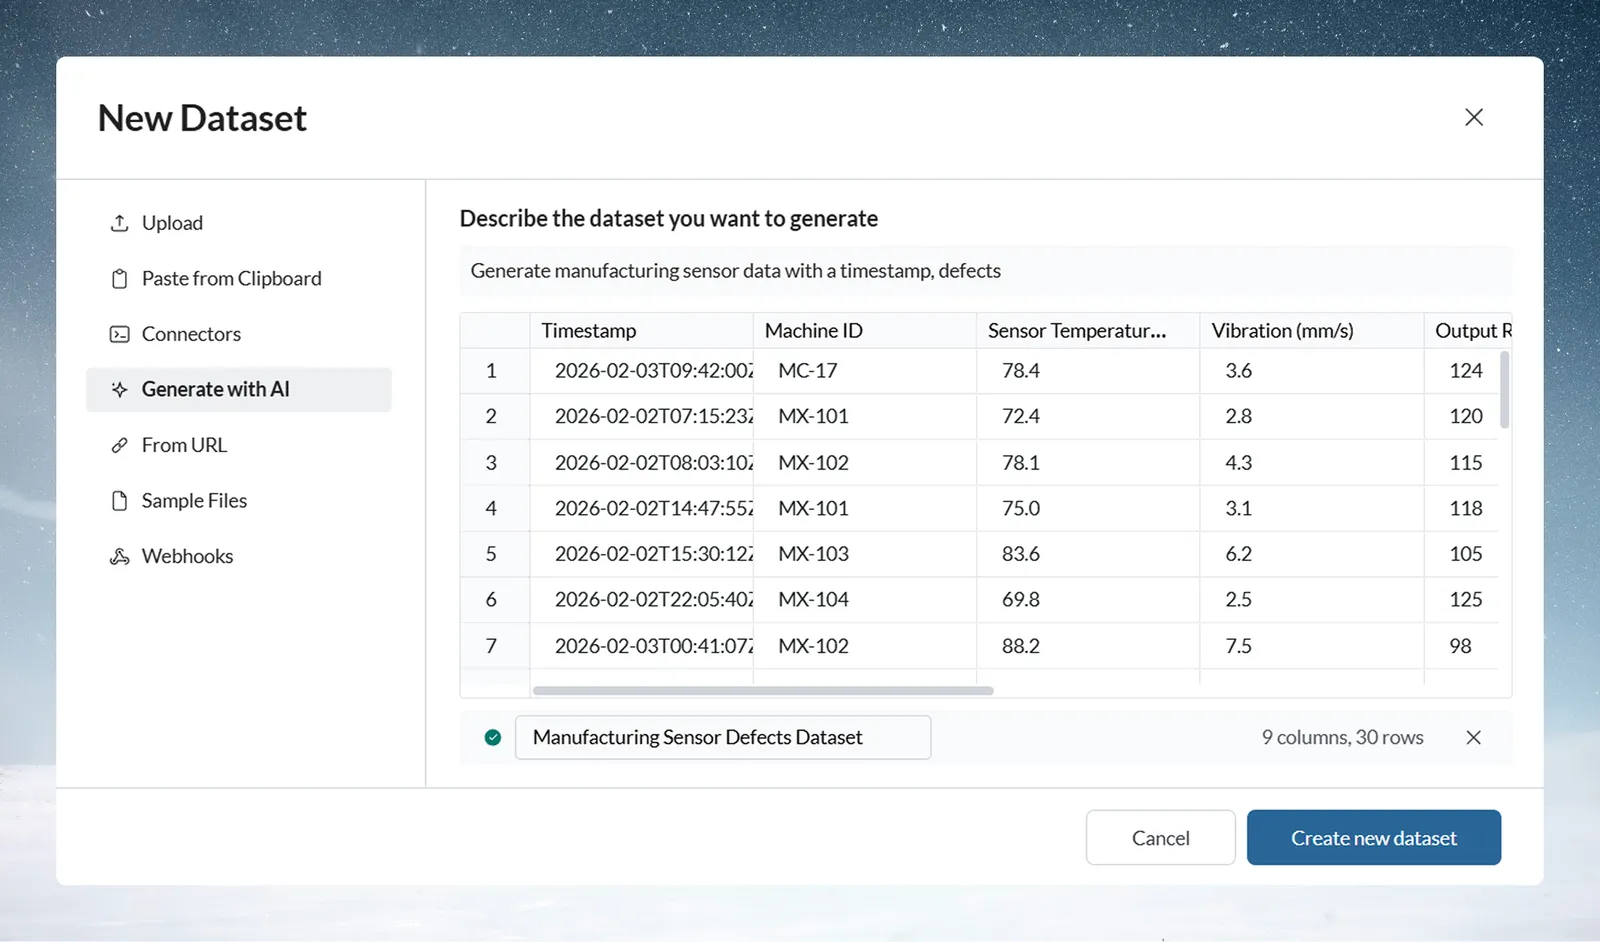
Click New dataset in the Data Library to create a dataset by file upload, paste from the clipboard, a connector, a URL, a webhook, a sample file, or by generating data with AI. See Choose how to bring data in. Once a dataset exists, you can add or replace its data, combine it with other datasets, open it in views, and export the results.
Batch: each load of new data
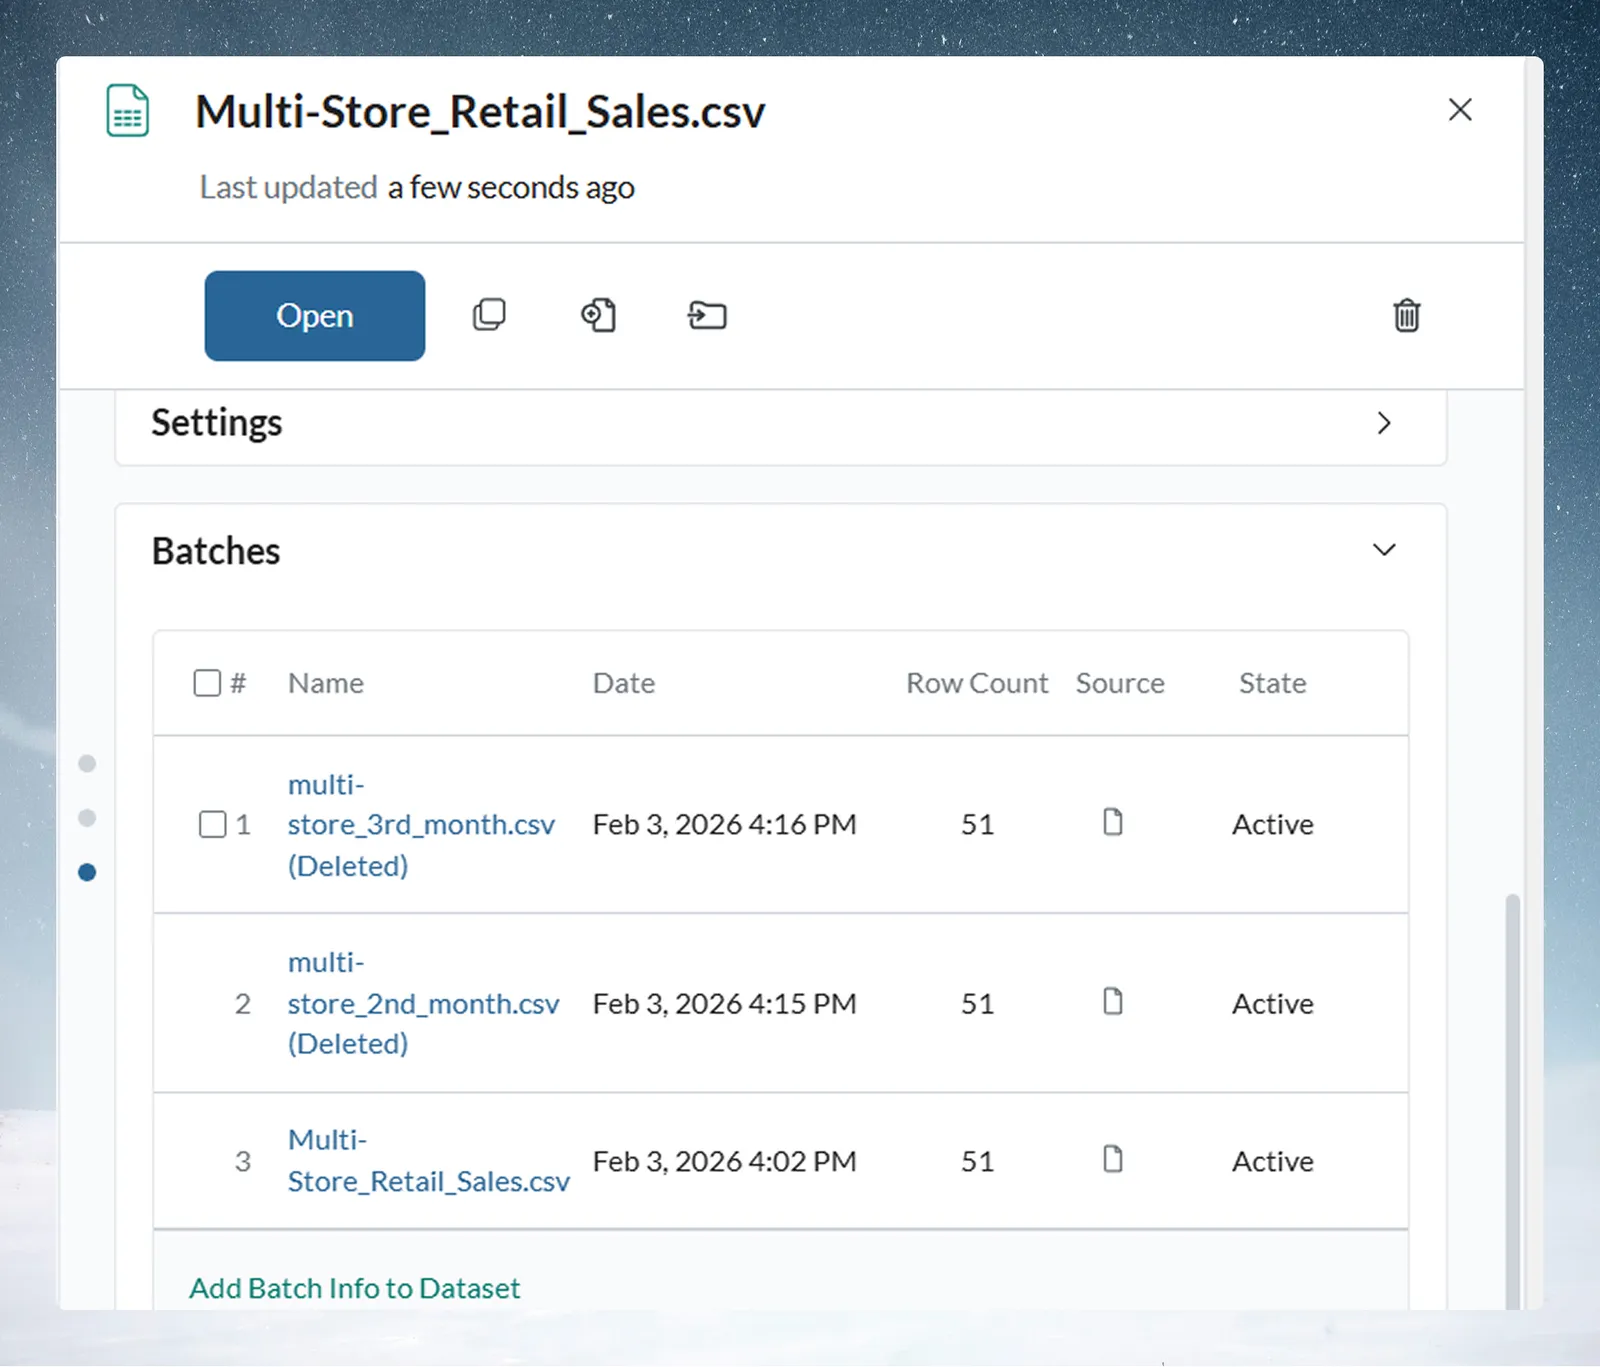
Each time data is added to a dataset, Mammoth records it as a Batch. The dataset's panel lists its batches, each with its source, row count and state (Active, Suspended or Pending Delete). The Activity Log records batch changes.
Combine or Replace new data
A dataset's Update Method decides what happens to new data:
| Update Method | What happens | Use it for |
|---|---|---|
| Combine | The new data becomes another batch beside the existing ones, and the dataset grows. | History that builds up over time, such as monthly sales or daily transactions |
| Replace | The previous batches are deleted and the new data becomes the only batch. | Reports that need only the latest data, such as a daily inventory snapshot |
Monthly sales files added in Combine mode give one batch per month; a daily feed gives one per day. A table fully reloaded each time uses Replace, so it always has one batch. You can also Suspend a batch, which leaves it out of every view without deleting it, or Delete it, which can't be undone. See Batches: see and fix what arrived.
View: where you explore and transform data
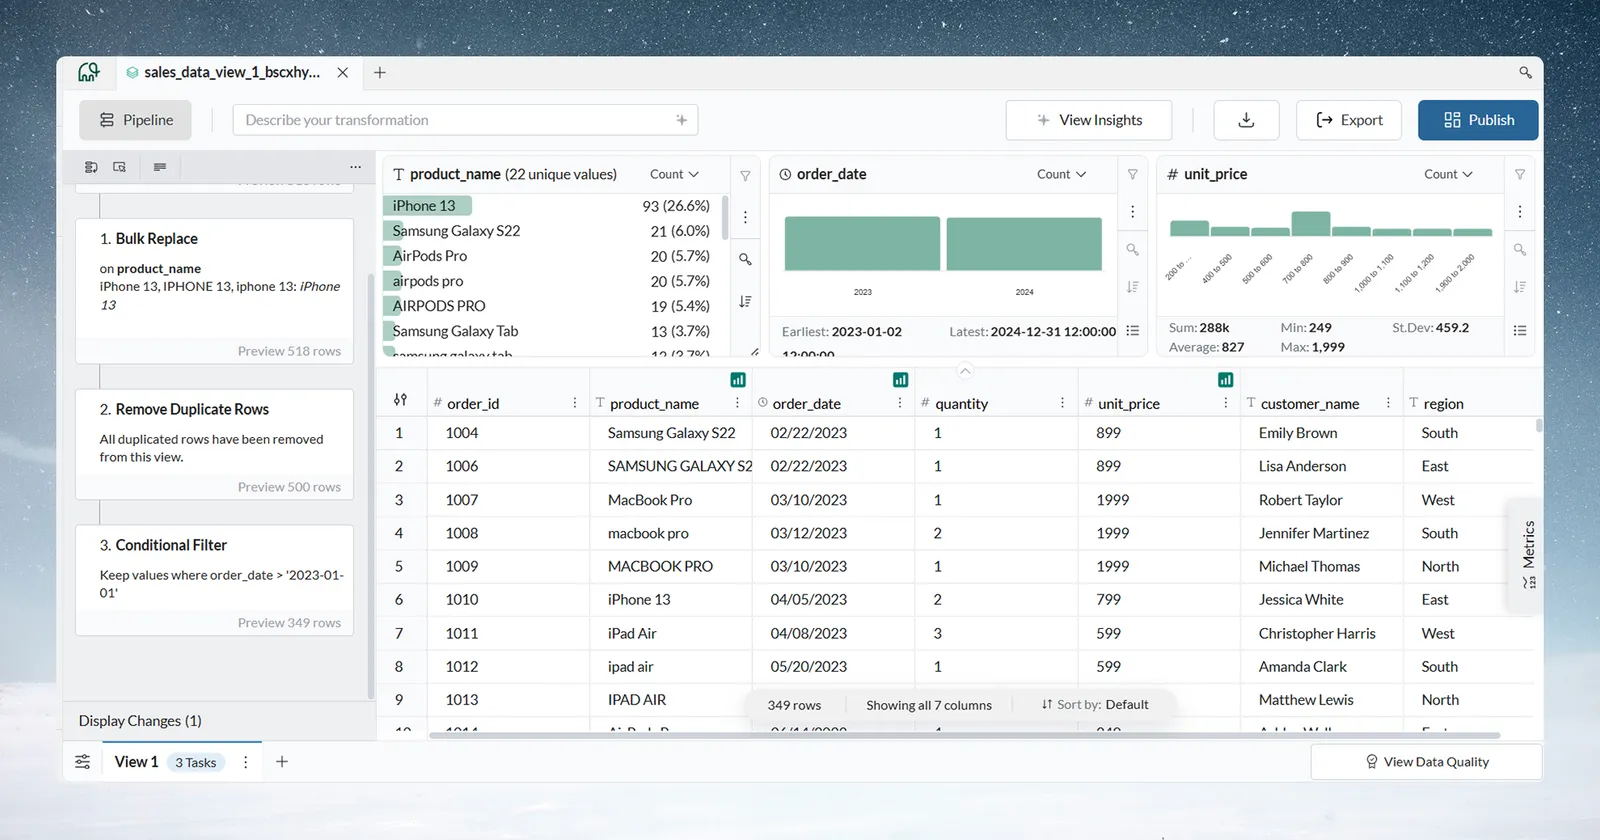
A View is the data editor for a dataset. It shows the data of all active batches together in a data grid, with Explore Cards above it, a metrics panel for calculations, and the Pipeline panel on the left.
Every dataset opens in a default view, and you can create more views of the same dataset, each with its own pipeline. For example, keep one view for executive reporting and another for detailed analysis. A view never changes the source data: its pipeline and display changes apply to what the view shows. See Views: create, rename and delete.
Display changes versus pipeline tasks
New users often confuse the two:
| Display changes | Pipeline tasks | |
|---|---|---|
| Examples | Sorting, hiding or renaming a column, formatting a number or date column | Filters, joins, calculations |
| What they change | How the data looks in this view only | The view's output |
| Saved | With the view, but not as tasks | As tasks in the pipeline |
| On refresh, exports, dashboards | Not part of the output | Run again on refresh, feed exports and dashboards built on the view, and can be copied into another view |
Use display changes to make one view easier to read. Use pipeline tasks for logic that the output, exports and reports depend on. A display change is like formatting an Excel sheet; a pipeline task is like a Power Query step that reshapes the data before anyone opens the sheet. See Rename, format and sort columns.
Pipeline: steps that run again on new data
When you apply a transformation in a view, it is added to the view's Pipeline as a task. Like a recipe, you write it once and cook it many times: new data flows through the same steps without manual repetition. The pipeline is:
- Sequential: tasks run top to bottom, and each works on the output of the one above it.
- Reusable: the same tasks run again on new data.
- Readable: each task card shows its function and key settings.
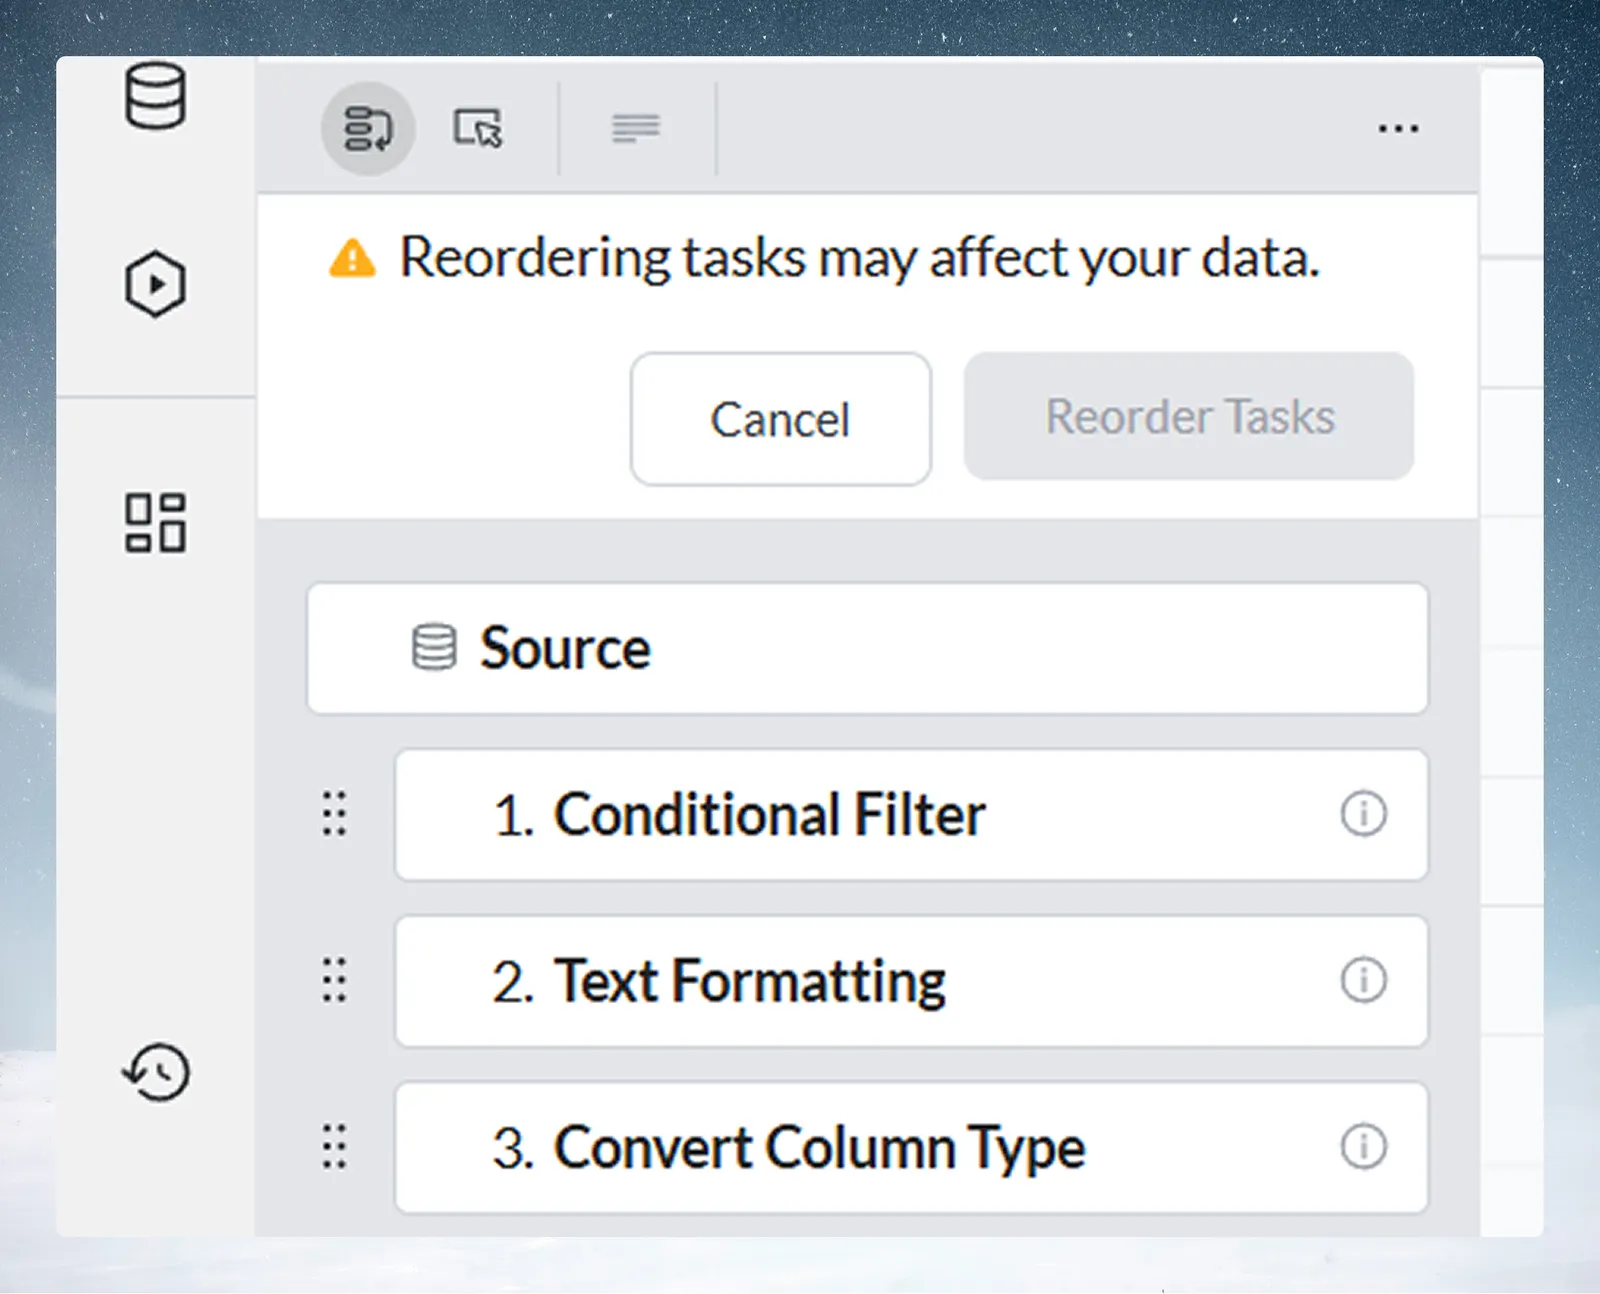
- Editable: you can edit, suspend, reorder, copy or delete tasks at any time.
- Previewable: you can look at the data as it was right after any task.
Pipeline Version history keeps earlier versions of the pipeline. See Edit, reorder and copy tasks.
Run tasks right away or in Draft mode
By default (Draft mode off), each task runs as soon as you apply it and the data grid updates. With Draft mode on, the tasks you add or change are queued, the Pipeline panel shows "Pipeline has Pending Updates", and the changes run together when you click Apply now. Turn Draft mode on from the More Pipeline options (...) menu.
Start with Draft mode off to see each result straight away. Once your logic works, turn it on for large datasets or long sequences of changes.
Common pipeline patterns
| Purpose | Typical tasks in order |
|---|---|
| Cleaning | Filter, remove duplicates, standardise values, convert types |
| Combining | Join datasets, select columns, calculate new fields |
| Reporting | Filter to a period, group and aggregate, pivot for layout |
Task: one operation in a pipeline
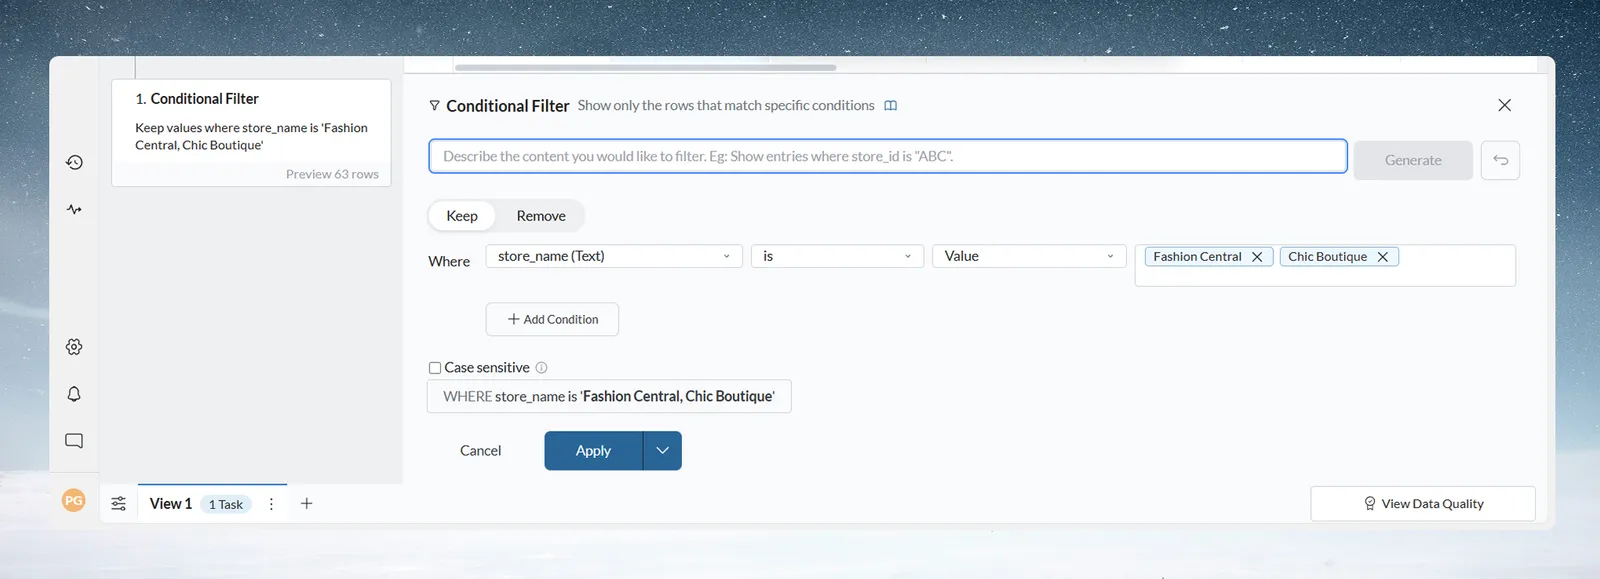
Each transformation you apply creates a Task: one operation, such as a filter, a join or a calculation, like one step in an Excel formula but visual and reusable. You set it up in the function panel, its position decides when it runs, and you can preview the data right after it.
The Transform menu opens from the + button (tooltip "Add a task") or the Describe your transformation box, which searches the functions and always offers Ask in plain words with your text as its prompt. It has seven categories:
| Category | Functions |
|---|---|
| AI Powered | Ask in plain words and Generative AI, plus shortcuts to Extract Text, Bulk Replace and Conditional Filter |
| Filter, Label & Replace | Conditional Filter, Remove Duplicate Rows, Show Top/Bottom Rows, Edit Cells, Label & Insert Values, Fill Missing Values, Bulk Replace, Find & Replace |
| Date, Numeric & Text | Add/Subtract Date Values, Extract Date Part, Financial Year, Calculate Date Difference, Math Function, Window Function, Obtain Large or Small Values, Extract Text, Text Formatting, Extract JSON |
| Reshape, Group & Pivot | Group & Pivot, Unpivot |
| Column Management | Add Column, Copy Columns, Combine Columns & Text, Convert Column Type, Remove Column, Split Into Multiple Columns |
| Unify | Send to Dataset, Join, Lookup, Repeat Rows |
| Controls | Data Check, Checkpoint Alert |
When you pick or edit a task, the function panel shows its settings. Many functions show a preview of the result before you click Apply, and the panel tells you when a setting is missing or wrong. See Calculate with formulas and the other pages in Clean and shape data.
Worked example with all seven levels
- Workspace: "Acme Corp" (your company)
- Project: "Q4 Sales Analysis" (your team's area)
- Dataset: "Salesforce Opportunities" (imported data)
- Batch: "December import" (this month's data)
- View: "Sales Pipeline Analysis" (where you work on it)
- Pipeline: five tasks transforming the data
- Tasks: Conditional Filter, Remove Duplicate Rows, Join, Math Function, Group & Pivot
Industry examples
These examples are illustrative.
Financial services: monthly regulatory reporting
Workspace: Example Bank
Project: SOX Compliance
Dataset: General Ledger Transactions
Batch: December (Replace mode)
View: Regulatory Report View
Pipeline: Filter → Categorize → Validate → Aggregate
Tasks: Conditional Filter, Label & Insert Values, Data Check, Group & Pivot
Manufacturing: production quality tracking
Workspace: Acme Manufacturing
Project: Quality Control
Dataset: Production Line Data
Batch: Daily production runs (Combine mode)
View: Quality Metrics
Pipeline: Calculate defect rates → Flag outliers → Trend analysis
Tasks: Math Function, Conditional Filter, Window Function
Hospitality: multi-property revenue analysis
Workspace: Example Hotels
Project: Revenue Management
Dataset: Property Management System Data
Batch: Nightly revenue reports (Replace mode)
View: Executive Revenue
Pipeline: Combine properties → Calculate RevPAR → Compare periods
Tasks: Join, Lookup, Math Function, Group & Pivot
How the structure keeps data secure
- Workspace isolation: each workspace is separate from every other.
- Project membership: people see a project's data only when they are members.
- Connection scoping: connection credentials stay with their project.
- Role-based permissions: workspace roles (Owner, Member) and project roles (Admin, Editor, Viewer), plus custom roles on the Pro plan.
- Activity Log: workspace and project actions are recorded in the Activity log.
See Security: sign-in, data security, compliance and audit logs.
Common questions about Mammoth concepts
Where is my data stored? In Mammoth's cloud, in your workspace, organised by project, dataset and batch.
What's the difference between a dataset and a view? A dataset is the imported data. A view is where you explore and transform it. One dataset can have several views, each with its own pipeline.
Why do I need projects? Projects decide who can see and change which data. The Marketing team doesn't see Finance's data unless they are members of the Finance project, and connection credentials stay with the project that owns them.
What happens to my pipeline when I add new data? The new data runs through the existing pipeline, so the same steps apply without manual work.
Can I have several pipelines on the same dataset? Yes. Create more views of the dataset, each with its own pipeline.
Related
- Quick start: see these ideas at work on a small file.
- Build your first pipeline: a hands-on pipeline on sample data.
- Members, roles and custom roles: every permission in one matrix.
- How the pipeline works: how tasks run, task previews and Draft mode.
- Edit, reorder and copy tasks: suspend, copy and reorder tasks, and restore an earlier pipeline version.
- Glossary: look up any Mammoth term.
Something wrong? support@mammoth.io