Automate and share data in Mammoth: exports, dashboards
Once a view's pipeline is built, Mammoth keeps it current with automations and gets the results out as dashboards, docs, slides, downloads and exports. Start from Dashboards > Create, the Automations tab in the Data Library, or Export in the view toolbar. For what Mammoth is as a whole, see What is Mammoth.
Build dashboards, docs and slides with AI
Click Dashboards in the left sidebar, then Create. Pick your data, choose a format and describe what you need. The AI reads your columns and builds a styled, interactive Dashboard, Doc, Slides deck, Q&A page or Explore page, which you refine with the AI chat or by hand. See Create a dashboard and Docs and slides.
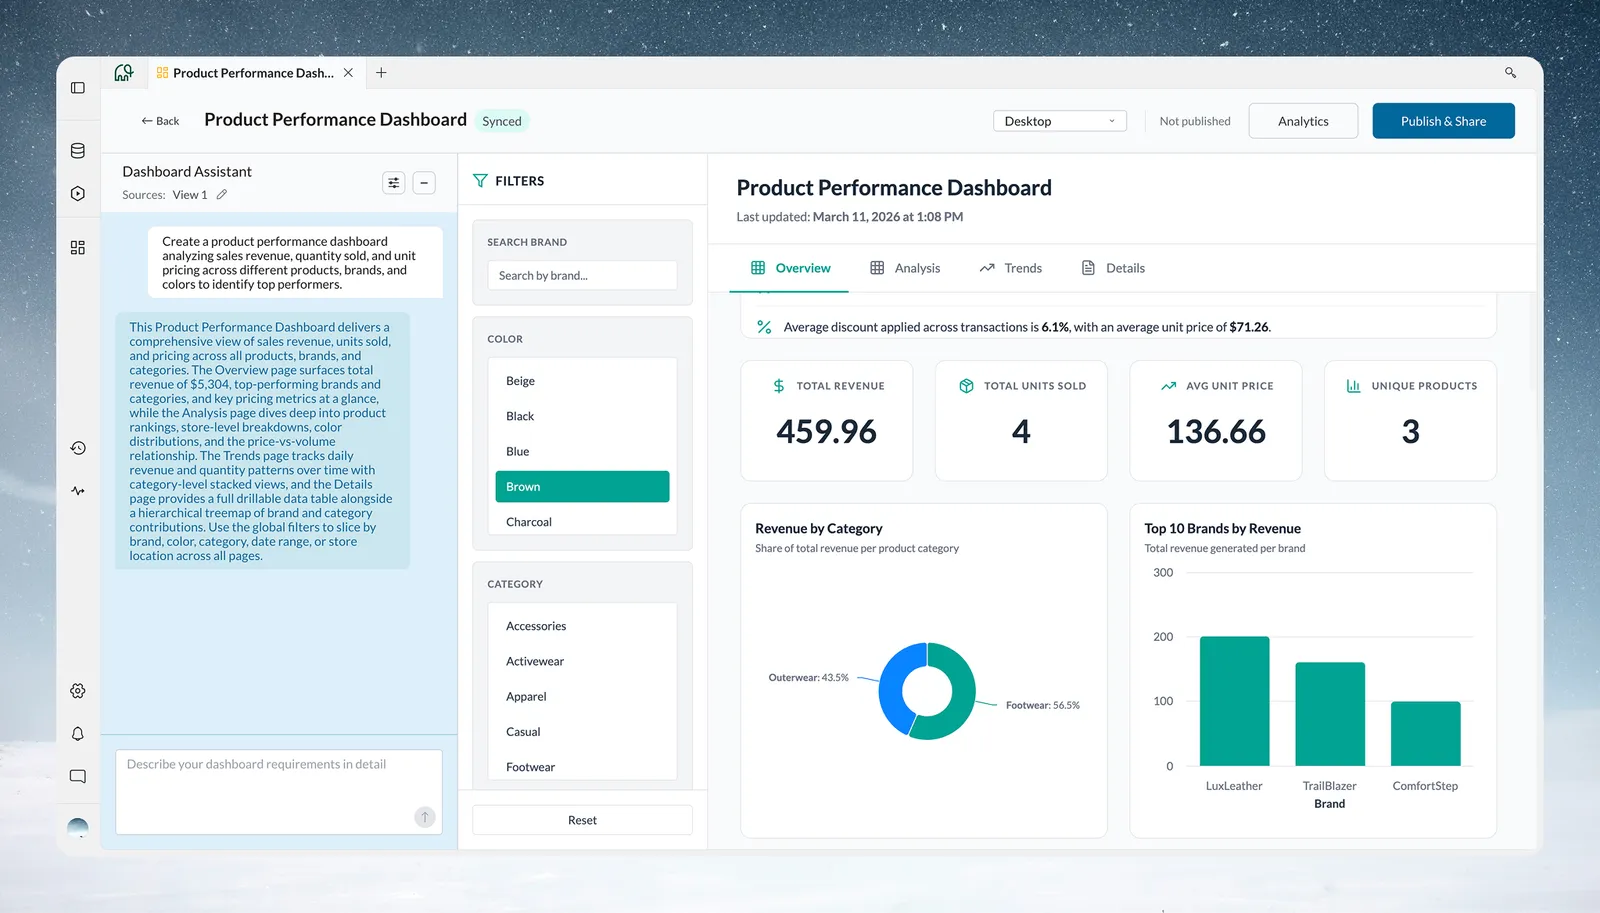
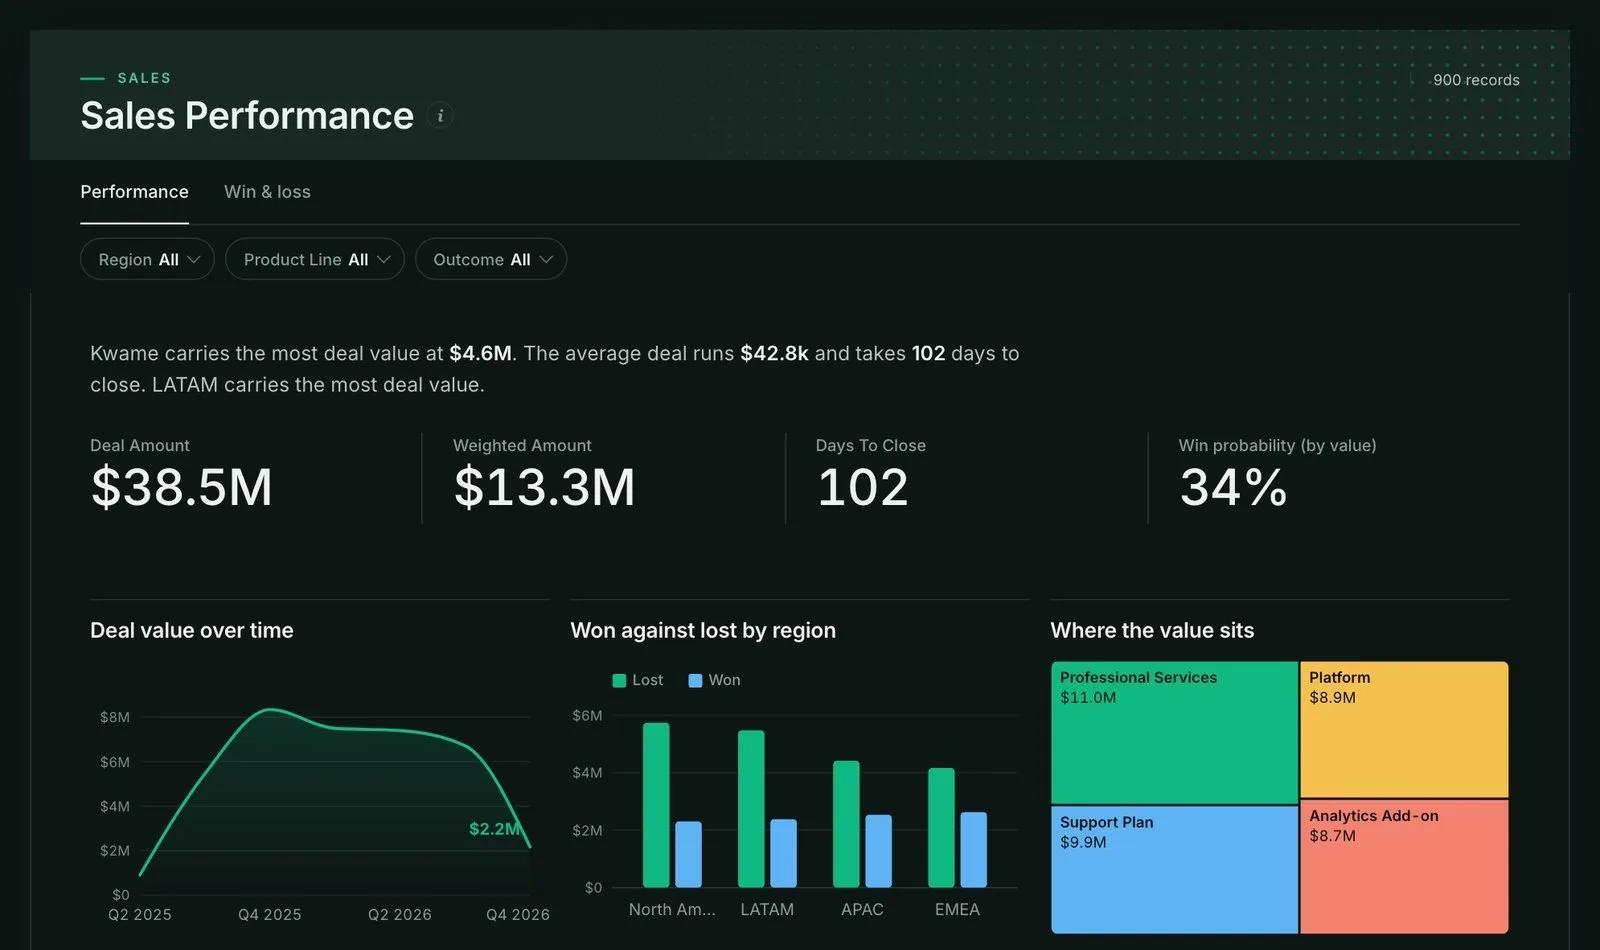
Share with Sign-in required (people with a Mammoth account), Anyone with the link and password, or Anyone with the link. You can also send email updates and see who read it, for executive reporting, stakeholder updates or client dashboards. See Publish and share a dashboard. Your plan sets how many dashboards you can publish and your monthly AI generations (Limits and quotas).
Automate refreshes, exports and emailed reports
Automations run recurring work without manual steps, from the Automations tab in the Data Library:
| Type | What it does |
|---|---|
| Dataset Refresh | Fetches the latest data for datasets from a database, app or API connector, or from a URL. Several datasets can refresh In parallel or In a sequence. |
| File Collection | Collects files from cloud folders into a Mammoth folder. Available on plans that include it. |
| Data Consolidation | Combines or replaces a dataset's data when a new file arrives in a folder. |
| Scheduled Export | Runs a view's export steps on a schedule, whether or not the data changed. |
| Messaging | Emails people a view on a schedule, as a CSV attachment. |
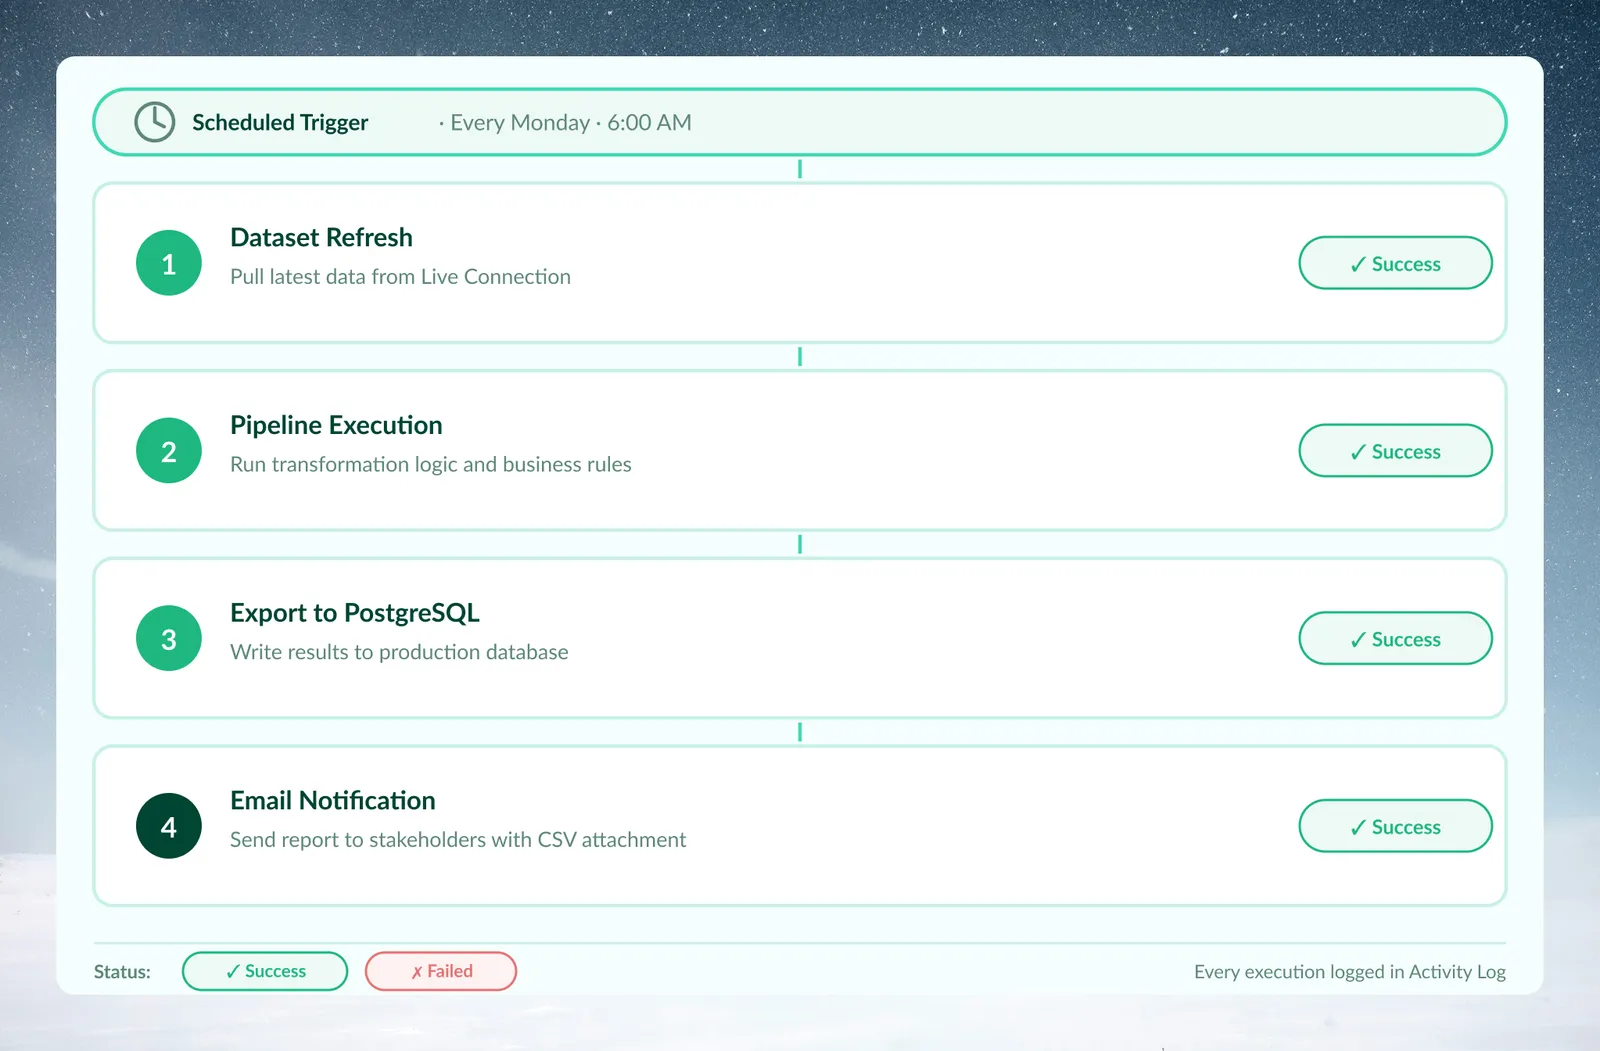
Your plan sets the shortest schedule interval. Monitor shows running and past runs and anything that needs attention. See What you can automate and Activity log.
Export and share your data
| Control in the view toolbar | What it does |
|---|---|
| Download icon (Save a copy) | A one-time copy: Download file (CSV, Excel, JSON and more), New dataset, or Email to people in the workspace. |
| Export | Adds an export task that delivers data every time the pipeline runs. Tabs: External Destinations and Mammoth Managed. |
| Publish | Opens the create page to build a dashboard, doc, slides or Q&A from the view. |
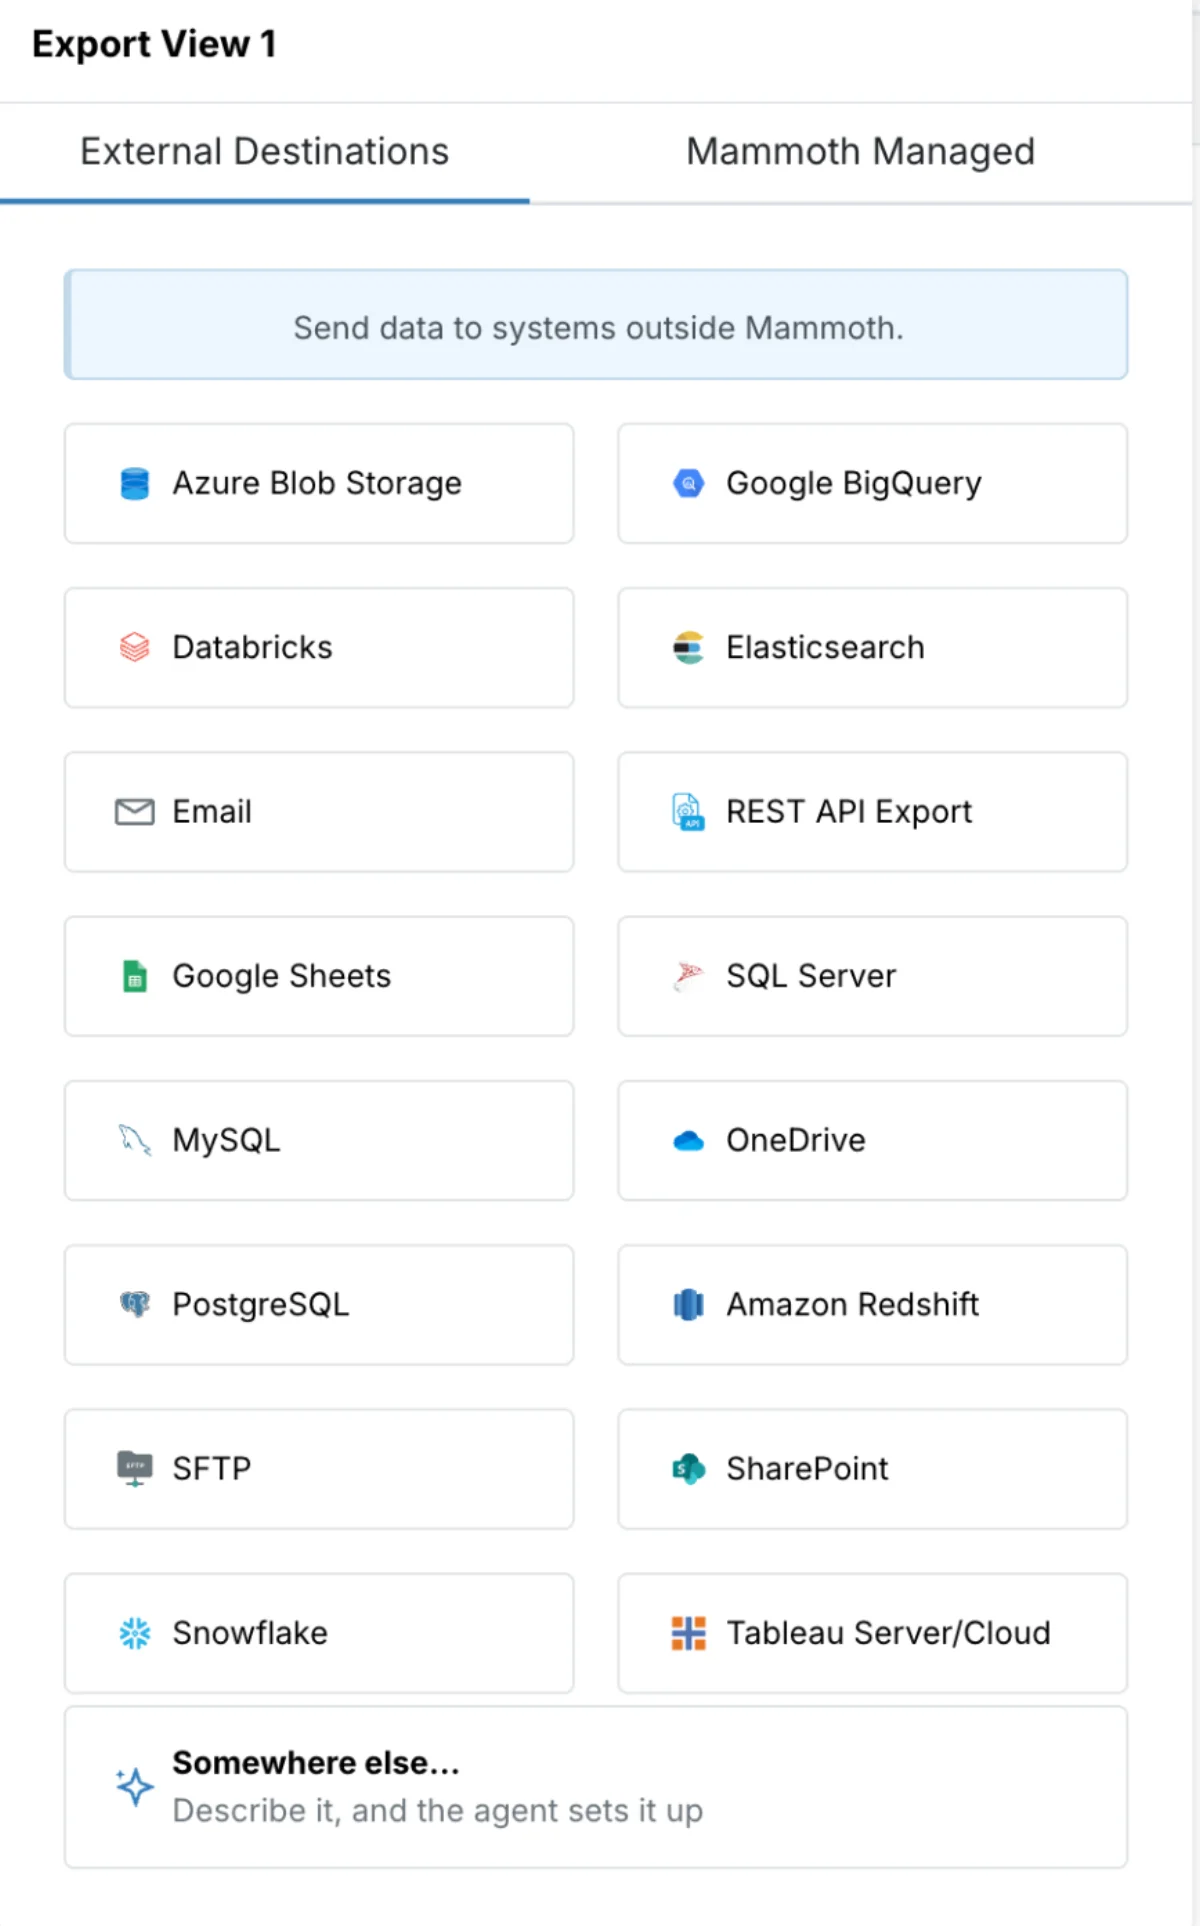
- External Destinations: Google BigQuery, PostgreSQL, MySQL, SQL Server, Amazon Redshift, Snowflake, Databricks, Elasticsearch, SFTP, SharePoint, Azure Blob Storage, OneDrive, Google Sheets, Email, Tableau Server/Cloud and REST API Export. Somewhere else… asks the AI Agent to build an export to another API, on Enterprise plans.
- Mammoth Managed: Send to Dataset (push results into another dataset, even in another project), Live link (a URL that always serves the current data as CSV) and a Mammoth-managed Google BigQuery or PostgreSQL database.
Send to Dataset, Snowflake, Databricks, Google Sheets and Email are on every plan. Other destinations depend on your plan; a card your plan doesn't include shows a Trial pill. See Send data to a database or BI tool.
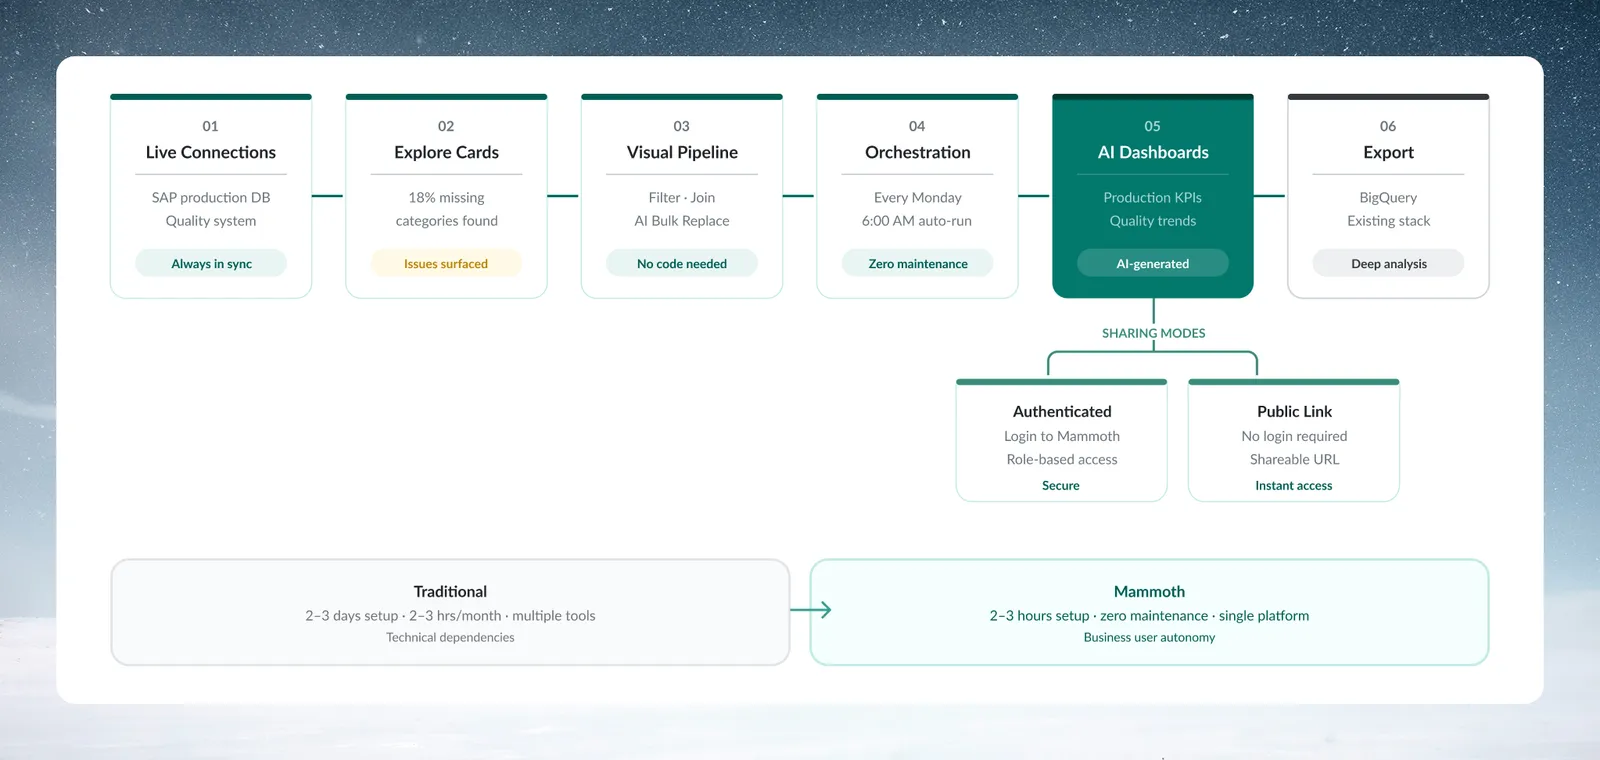
Example: a manufacturing team end to end
In this illustrative example, a manufacturing team connects its SAP HANA production database and its quality system. Explore Cards on the product category column show many empty values. The team's pipeline filters out test records, standardises vendor names with Bulk Replace, joins production with quality data, and calculates defect rates by product line.
A Dataset Refresh automation pulls new data every Monday morning, and the pipeline applies the same steps. A dashboard of production and quality trends is shared with Sign-in required, so plant managers sign in to see it. An export task sends the results to the team's BigQuery warehouse after every run.
Automate one manual process you repeat every month first.
Related
- Prepare data: connect, explore and clean before you share.
- Limits and quotas: dashboards you can publish, AI generations and schedule intervals.
- What you can automate: every automation type in detail.
Something wrong? support@mammoth.io