Lock, edit and compare metrics as you filter
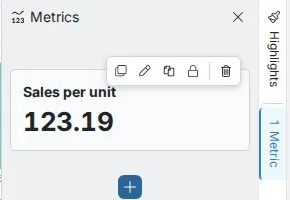
Metric cards in the Metrics panel recalculate when you filter with Explore Cards, unless you lock them. Hover a card for its actions: copy, edit, duplicate, lock and delete. How to create a metric is on Metrics.
Copy, edit, duplicate, lock or delete a metric card
A card shows its title (with a lock icon when locked), the value, the Subtitle and the Description. A metric built from a plain-English description shows it in a row you can click to see the generated query. A metric with a condition shows it as a filter summary. If a metric can't be calculated, the card shows Error; hover it to see why.
Hover a card to see five action icons. They are disabled while the pipeline has an error.
| Icon | What it does |
|---|---|
| Copy to clipboard | Copies the title and current value at once, for example Total sales: 5.2M |
| Edit (pencil) | Opens the full editor: expression, Title, Subtitle, Description and formatting |
| Duplicate | Opens "Duplicate metric" with the original expression. The title gets a number, for example "Weight per unit sold 1". Edit or submit as is |
| Lock | Freezes the metric against explore filters. It keeps the filters active when you locked it. Click again to unlock |
| Delete (trash) | Removes the metric after you confirm |
Drag a card by its header to reorder the cards.
Watch metrics change as you filter
For example, before filtering: Total Revenue $5.2M, Average Deal $12,340, Order Count 421, Win Rate 67%. After double-clicking "West" on the Region card: $1.8M, $14,560, 124 and 72%. To follow a trend, filter month by month (Jan, Feb, Mar) and watch the values change.
Compare a segment with the total using lock
Lock a metric while no filters are on to keep its all-data value.
- Lock "Total Revenue" at $5.2M.
- Filter Region to West.
- Create another Revenue metric and leave it unlocked. It shows $1.8M.
- Compare: West is about 35% of total revenue.
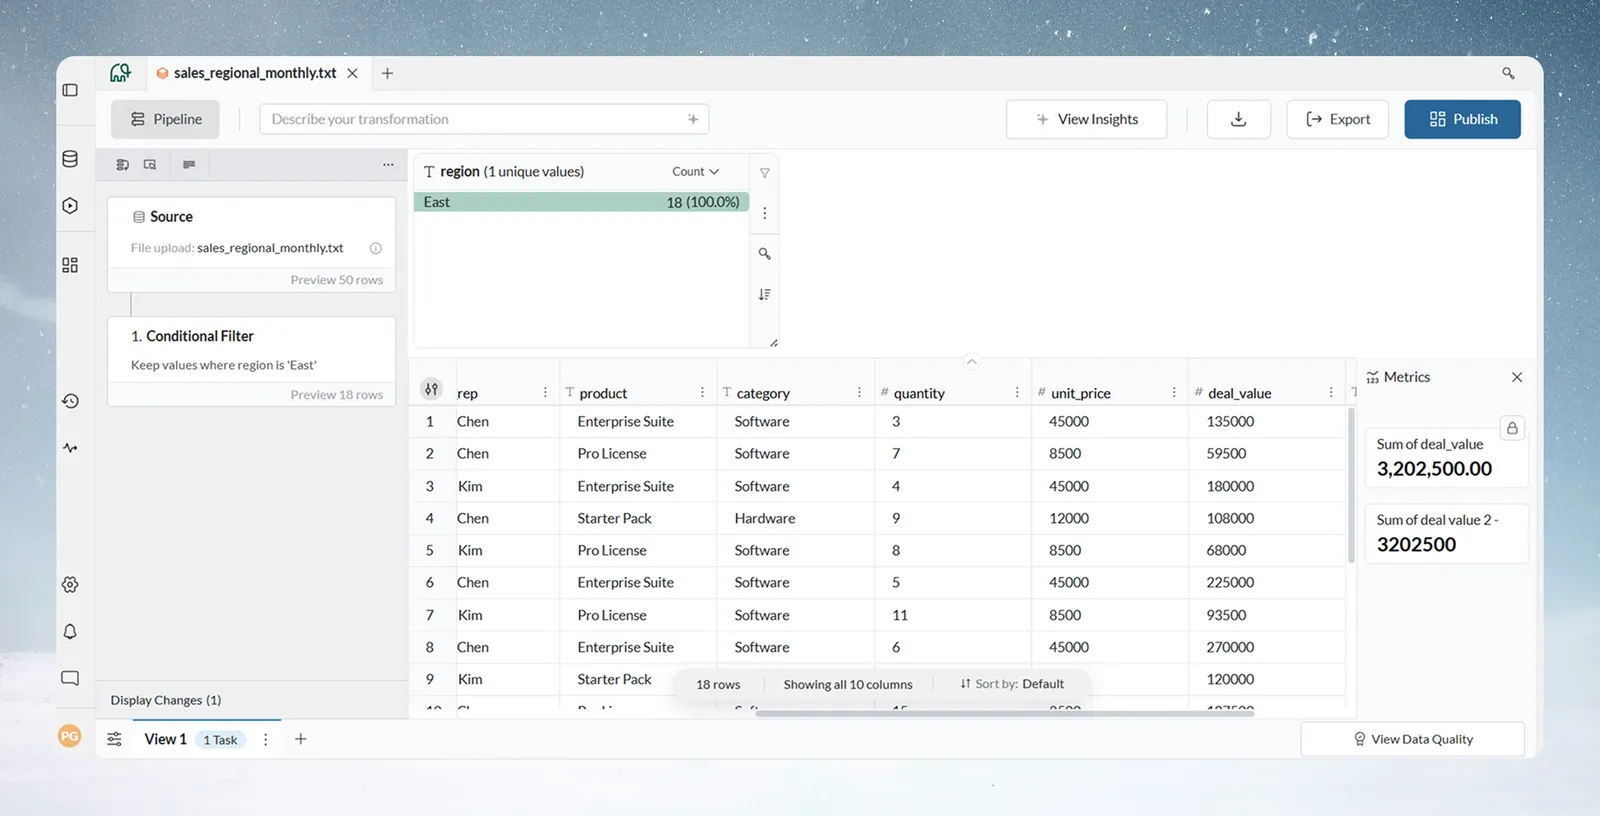
The same works for any segment: a locked Total Sales of $3.2M beside an unlocked $1.1M filtered to East shows East is 34% of the business.
Example metric sets
A good start for any dataset is 3–5 metrics: a total count, a key sum, a main average and one or two business ratios.
| Use | Metrics |
|---|---|
| Sales | SUM("deal_value"), AVG("deal_value"), COUNT() with status is Won, and a win rate in SQL mode |
| Manufacturing quality | COUNT(), COUNT() with defect_severity is not None, a defect rate in SQL mode, and AVG("yield_percentage") |
| Compliance | COUNT(), COUNT() with amount > 10000, SUM("amount") with amount > 10000, and a compliance rate in SQL mode |
Metrics compared with Explore Cards and View Insights
| Metrics panel | Explore Cards | View Insights | |
|---|---|---|---|
| Purpose | Single-value KPIs | Data distributions | AI-written observations |
| Made by | You, with calculations | You, for any column | The AI |
| Display | Large numbers with labels | Charts and ranked lists | Sentences |
| Kept | Saved with the View | Saved with the View | Saved until the View's data changes |
Use Explore Cards to find patterns, then create metrics to track the numbers behind them.
Troubleshooting metric cards
| Symptom | Cause | Fix |
|---|---|---|
| Metric doesn't change when you filter | The metric is locked, or no filter is applied | Click the lock icon to unlock; check the filter badge beside Explore; refresh the View |
| Card icons are disabled | The pipeline has an error | Fix the failing step |
Related
- Metrics: create a metric from a column header, a formula or AI.
- Explore Cards: the filters metrics follow.
- View Insights: let AI summarize the View.
- Tables, KPI cards, insights and text: show numbers on a dashboard.
Something wrong? support@mammoth.io