Prepare data in Mammoth: connect, clean and explore
Preparing data in Mammoth means bringing it into a project's Data Library, checking it with Explore Cards, and cleaning it in a view's pipeline, by hand or with AI. Start from Data > New dataset in the left sidebar. For what Mammoth is as a whole, see What is Mammoth.
Find your data in the Data Library
Click Data in the left sidebar to open the project's Data Library. Its tabs are Datasets, Connections, Automations and Parameters. Datasets lists folders, datasets and views, with status chips and actions for several items at once.
New dataset adds data: upload a file or folder, paste from the clipboard, connect a source, import from a URL, load a sample file, generate data with AI, or receive rows through a webhook. See Find your way around the Data Library.
Connect databases, apps and cloud storage
To connect databases, apps, cloud storage and APIs instead of re-uploading files, click New dataset and choose Connectors, or open Data > Connections and click New Connection. A database opens its connection form; other sources open the connector workspace, where a chat asks for credentials or a sign-in. A saved connection belongs to the project. See Connect a database or app and Manage saved connections.
Datasets from databases, apps and APIs refresh with a Dataset Refresh automation. Files from drives and file servers (Dropbox, Google Drive, SharePoint, SFTP and others) are saved once; a File Collection automation brings in new files. One pipeline can join data from several sources.
See what is in each column with Explore Cards
In the Explore panel above the grid, Add card picks a column. The card shows distinct values (text), a distribution (numbers) or a timeline (dates), and Mammoth remembers your cards for the view.
Select values, then choose Filter or Exclude, or double-click a value to filter to it. Explore filters are temporary; you can turn them into a pipeline task or a new view. Use cards right after an upload to spot missing values, odd spellings and outliers.
Clean data in a visual, no-code pipeline
Open a dataset to work on it in a view, the data editor for a dataset. Each task you add, such as a filter, a join or a pivot, goes into the view's pipeline in the Pipeline panel on the left. Tasks run top to bottom and you can drag them into a new order, so the pipeline is a readable record of your logic.
The + button ("Add a task") opens the Transform menu. Its seven categories are AI Powered, Filter, Label & Replace, Date, Numeric & Text, Reshape, Group & Pivot, Column Management, Unify and Controls.
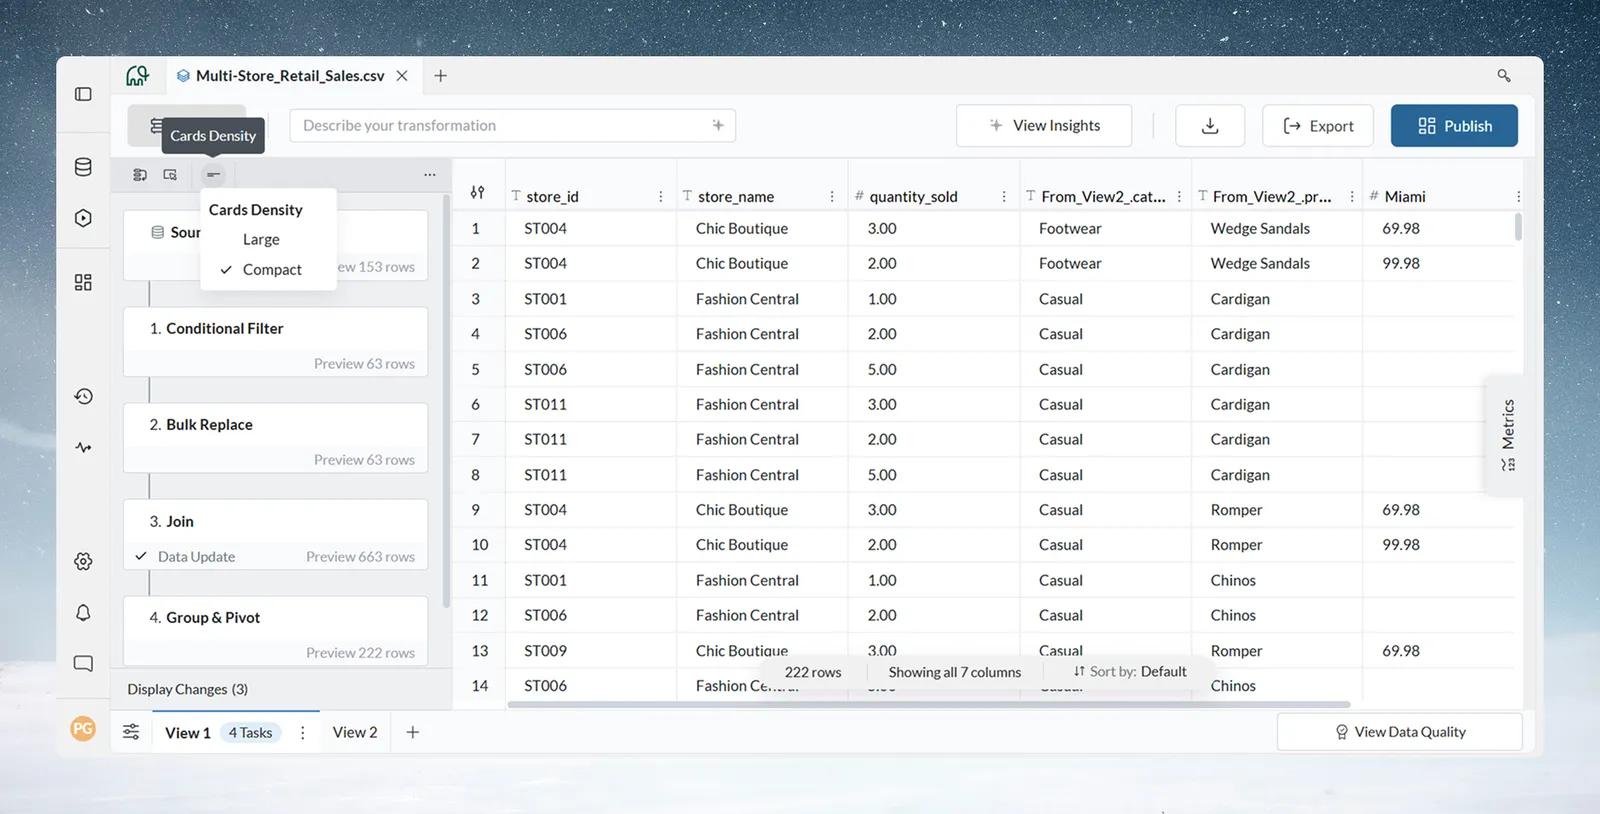
Preview the data at any task, and edit or reorder tasks later. Draft mode queues several changes to run together with Apply now. See How the pipeline works.
Describe a transformation and let AI build it
| Task | What it does |
|---|---|
| Generative AI | Writes new column values from a prompt: classify, enrich, translate or summarise rows. |
| Ask in plain words | Turns a plain-language request into a SQL query and runs it on the view. |
| Conditional Filter and Extract Text | Build their rule from a sentence you type. |
| Bulk Replace | Suggests groups of similar values, such as "iPhone 15 Pro", "iphone 15 pro" and "iPhone15Pro", to replace with one name. |
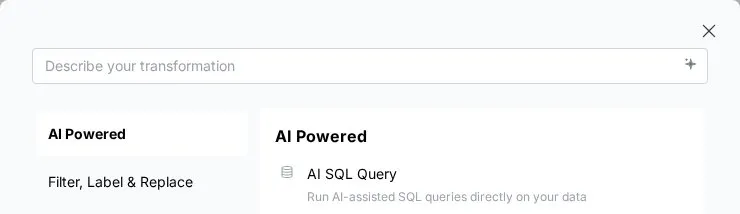
The Describe your transformation box in the action bar opens the Transform menu and searches its functions. It always offers Ask in plain words too, with your text carried into its prompt. AI tasks produce ordinary pipeline tasks you can inspect and edit, so you can classify comments or pull an amount out of a notes column without a formula. See Use AI on your columns and Write SQL with AI.
Related
- Automate and share data: what happens after the data is clean.
- Quick start: try these steps on a small file.
- Core ideas: how datasets, views and pipelines fit together.
Something wrong? support@mammoth.io