Explore Cards, Metrics, View Insights or Data Quality?
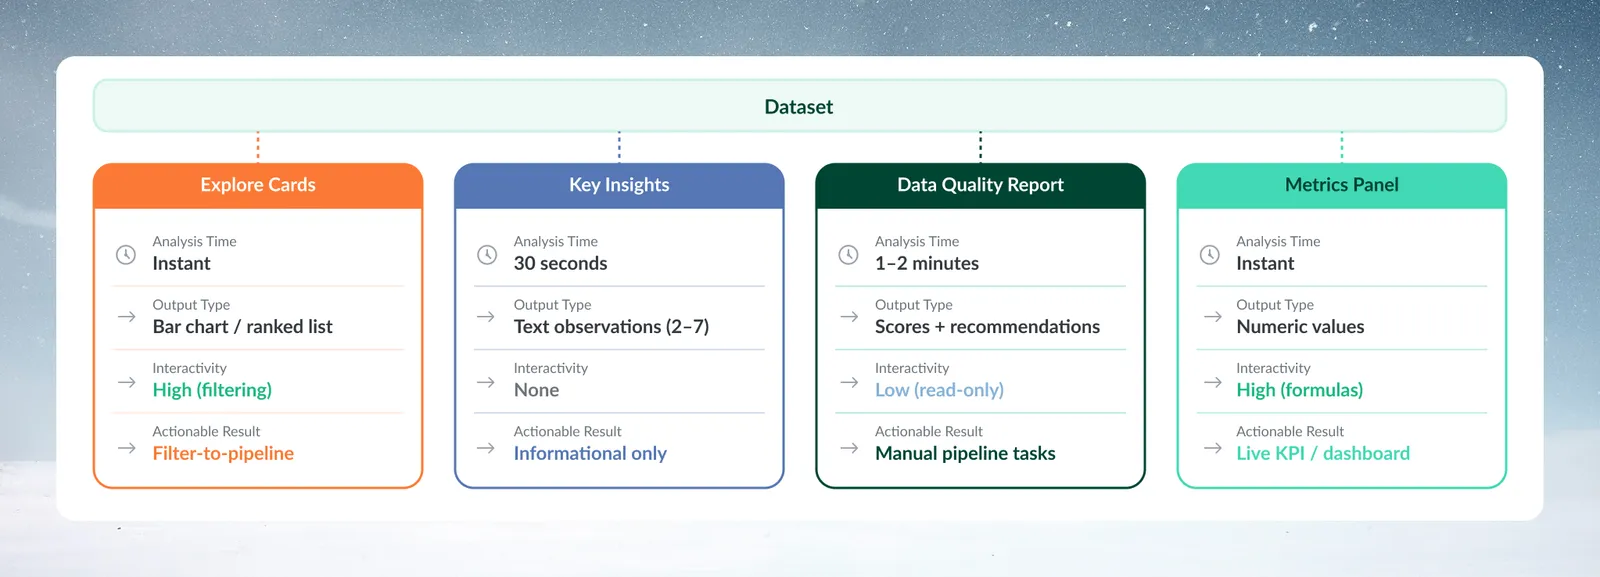
Mammoth has four tools that show what is in a View before you transform it. Explore Cards and the Metrics panel are interactive and follow your filters; View Insights and the Data Quality Report are read-only snapshots of the whole View. All four are in the data editor; how to combine them is on Use the explore tools together.
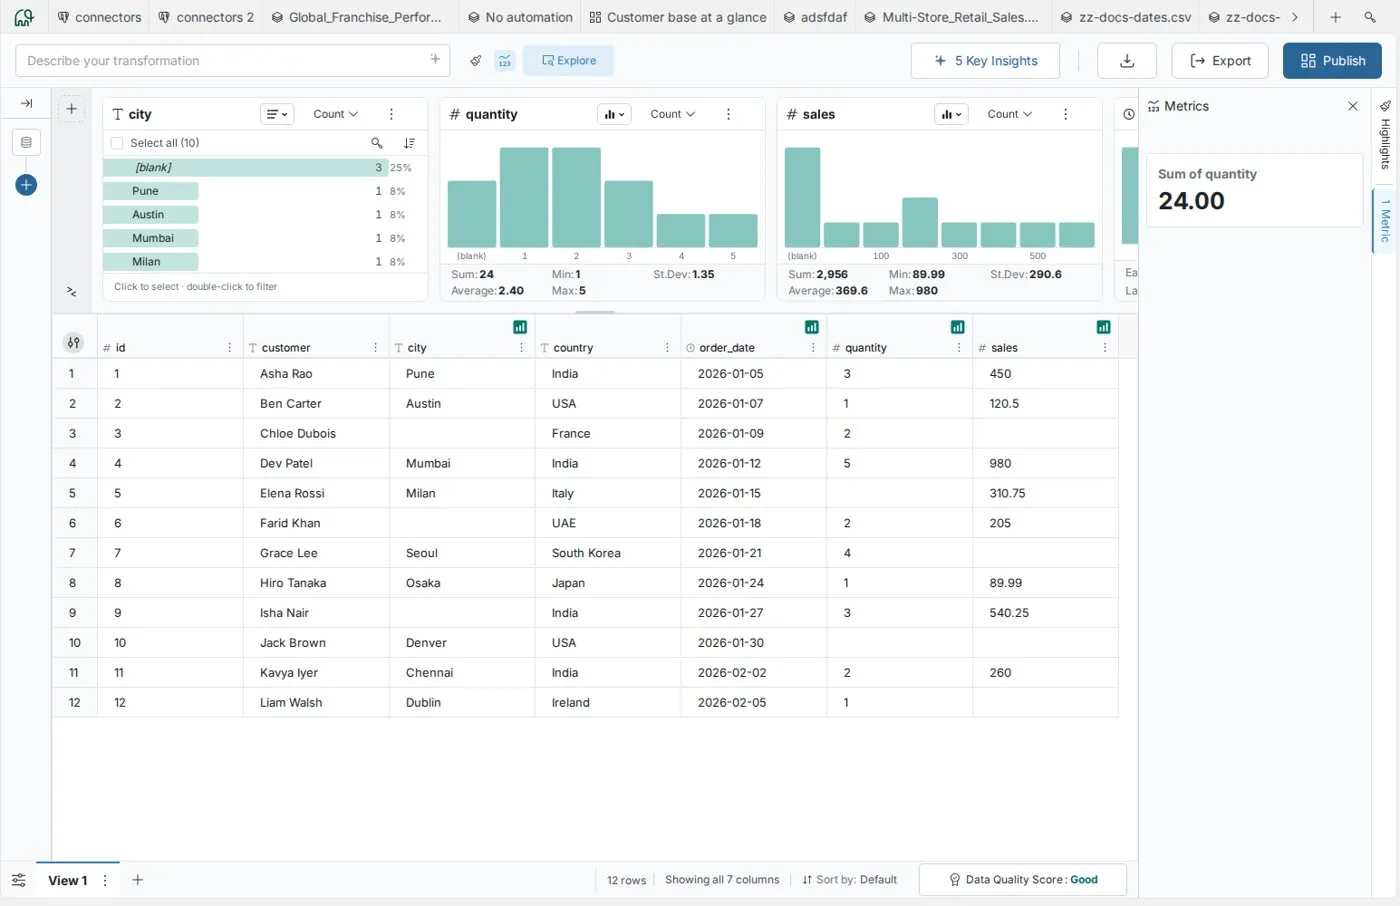
The four explore tools at a glance
| Tool | Question it answers | What it gives you | Who decides | How you use it | What you do with the result |
|---|---|---|---|---|---|
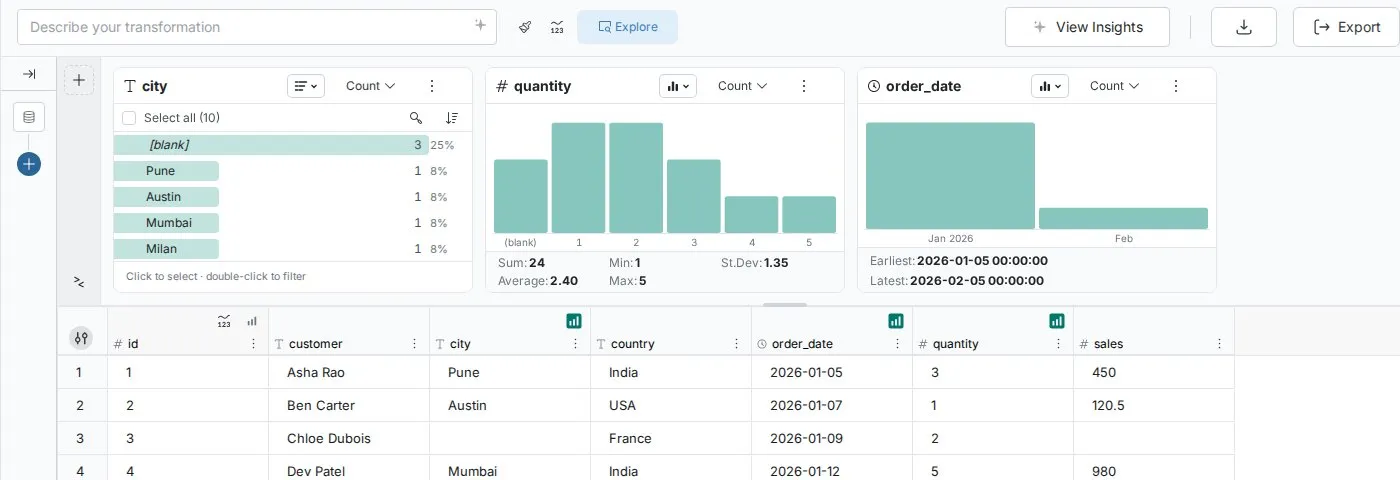
| Explore Cards | "What's in this column?" | Text: a ranked list (or donut, treemap). Number and date: a vertical bar chart (or list; timeline for dates) | You | High interaction: click values to filter | Turn filters into a pipeline task or a new View; add a card's chart to a dashboard |
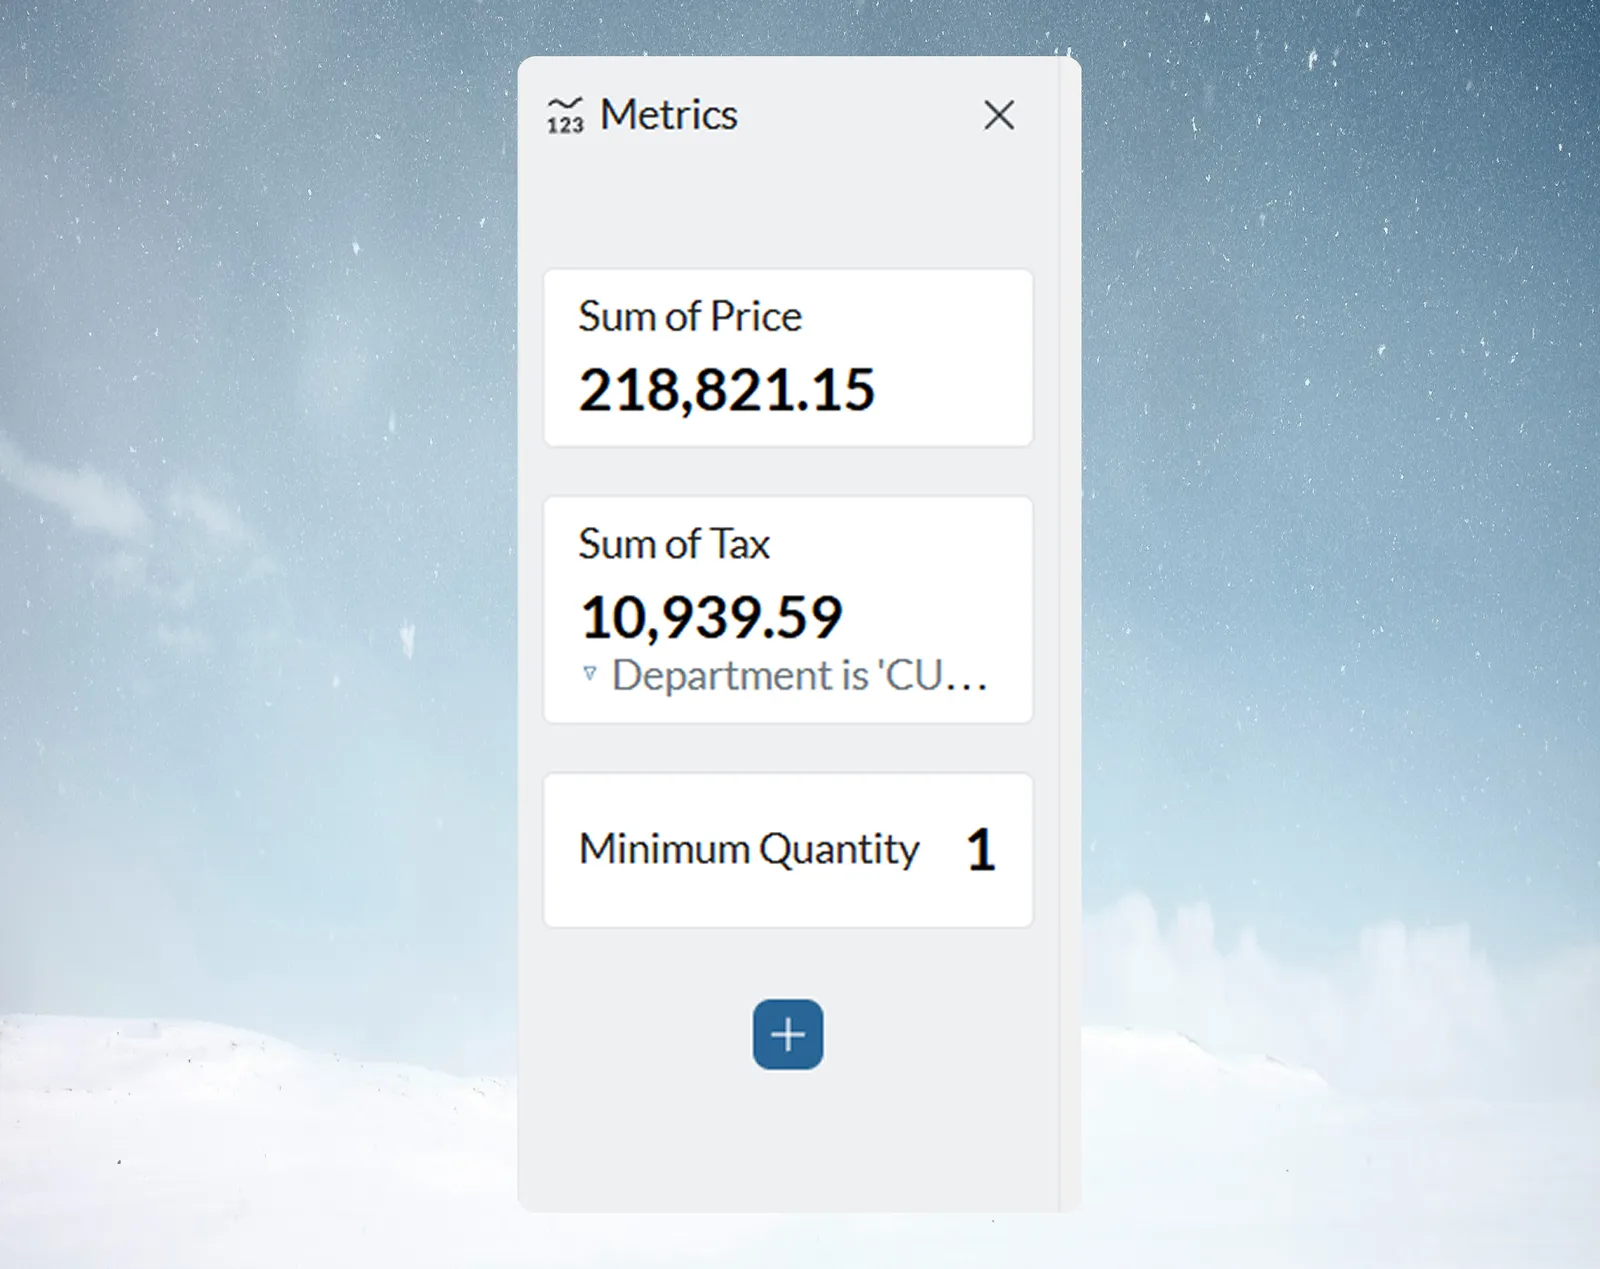
| Metrics panel | "What do I want to measure?" | Single numbers you define (Count, Sum, Average, formulas) | You | High interaction: formulas and conditions. Open it from the action bar | KPI calculations and dashboard preparation |
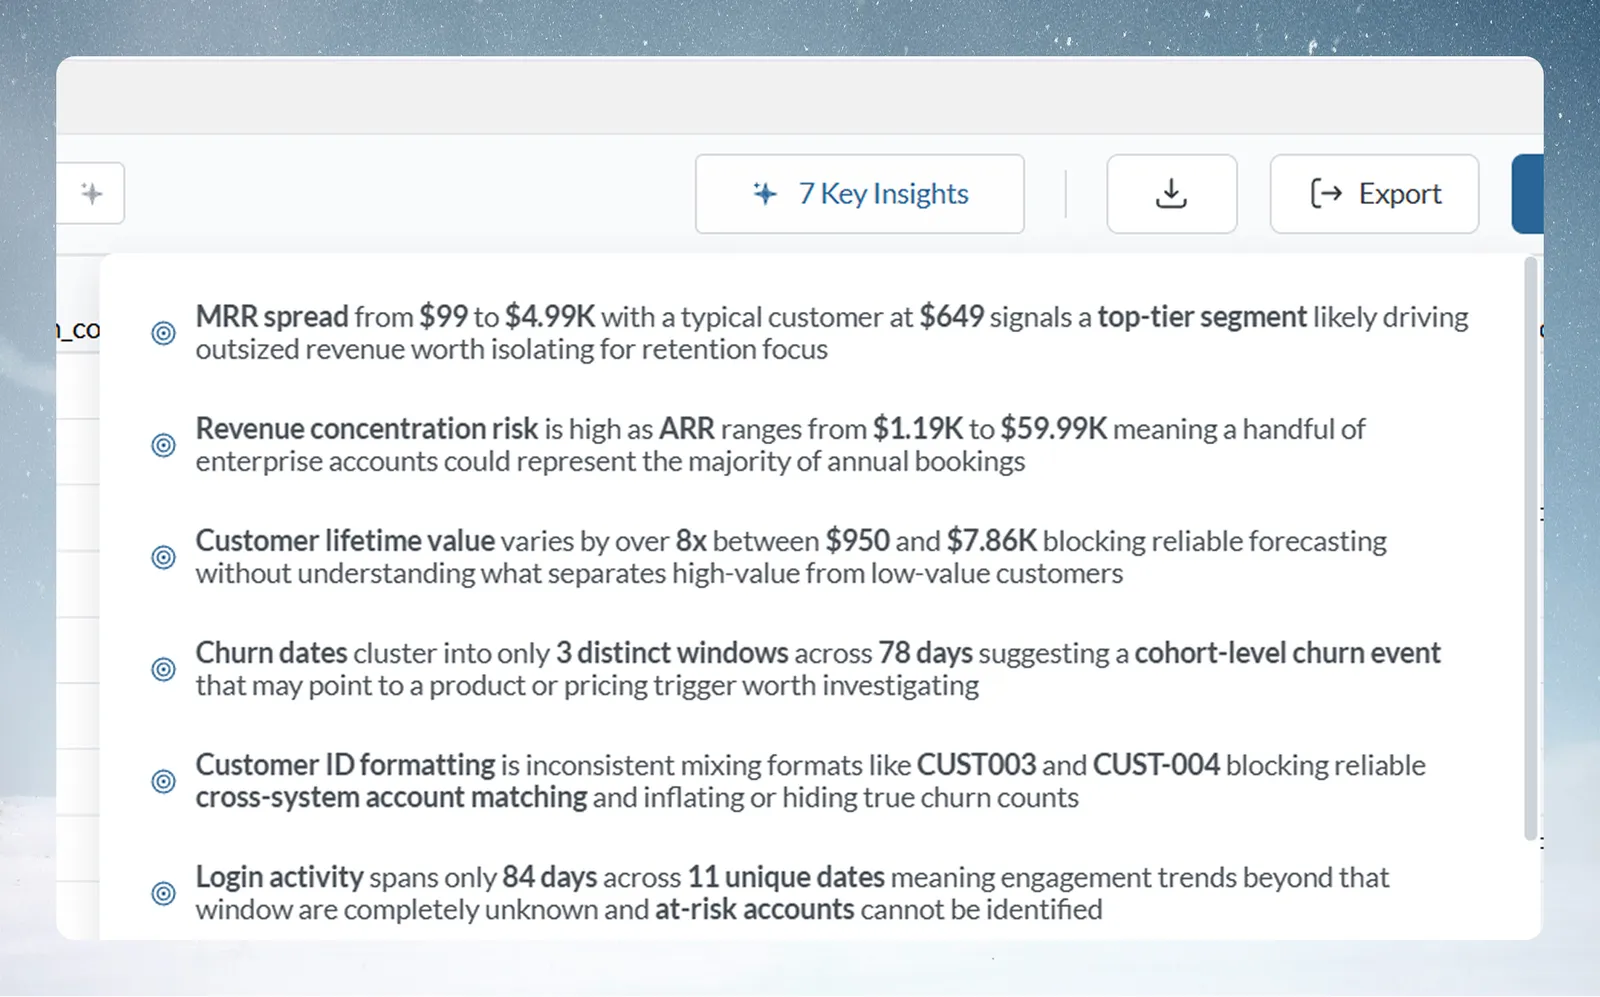
| View Insights | "What's interesting here?" | 3–7 AI-written business observations | The AI | None: read only. Click the button | Informational only |
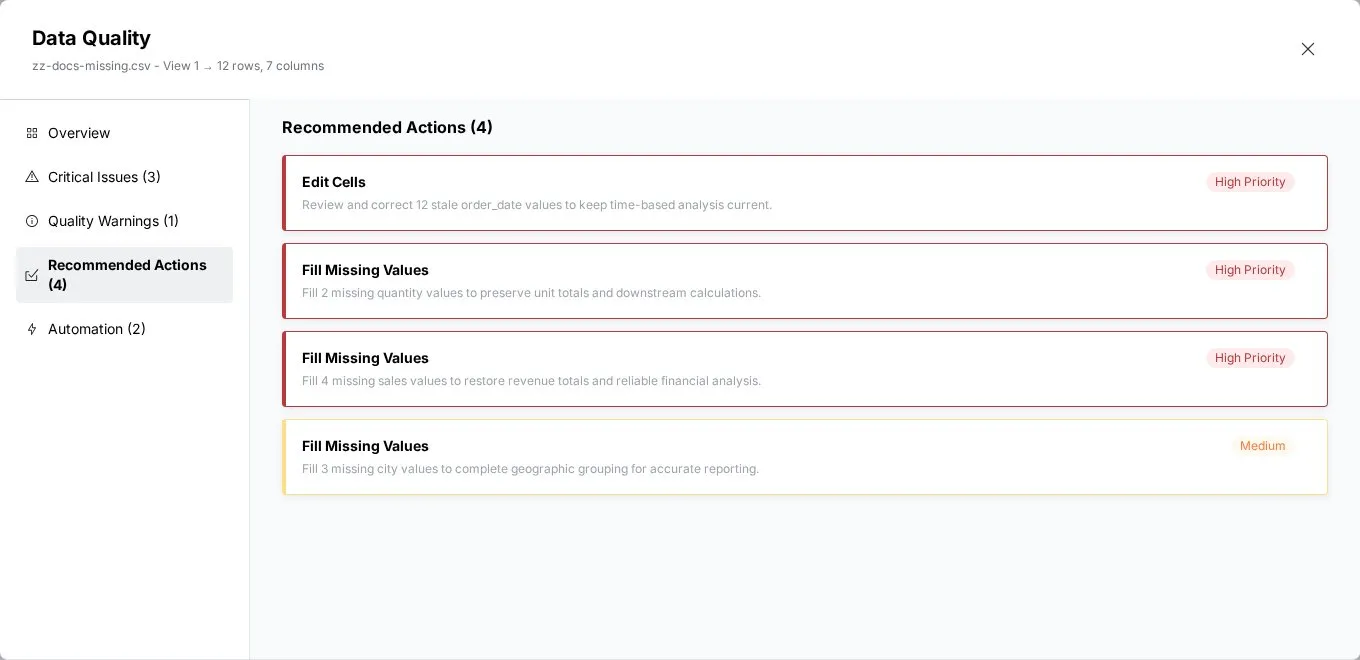
| Data Quality Report | "What needs fixing?" | A quality score, six dimension scores, issues and recommended pipeline tasks | DAMA quality rules, with AI help | Low: read only. Click the button | You build the recommended tasks in the pipeline yourself |
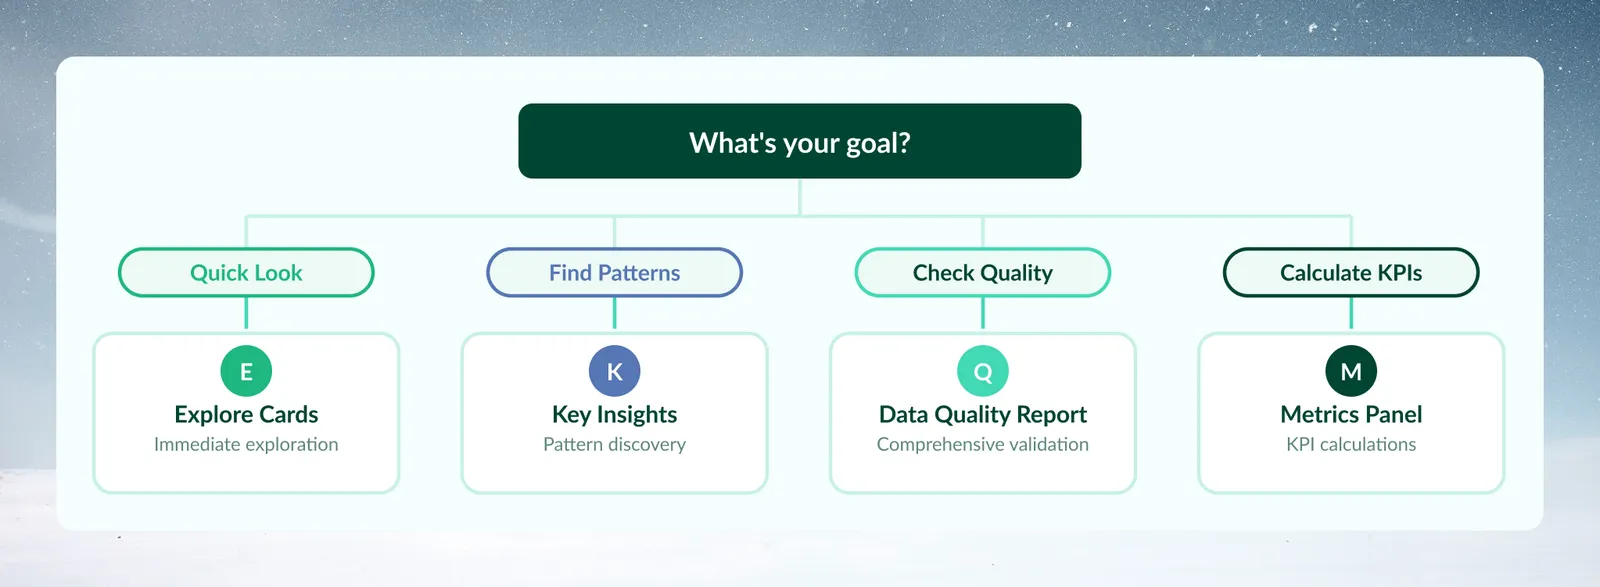
Pick an explore tool by your goal
| Goal | Start with | Then |
|---|---|---|
| I loaded new data and want to understand it | Explore Cards | |
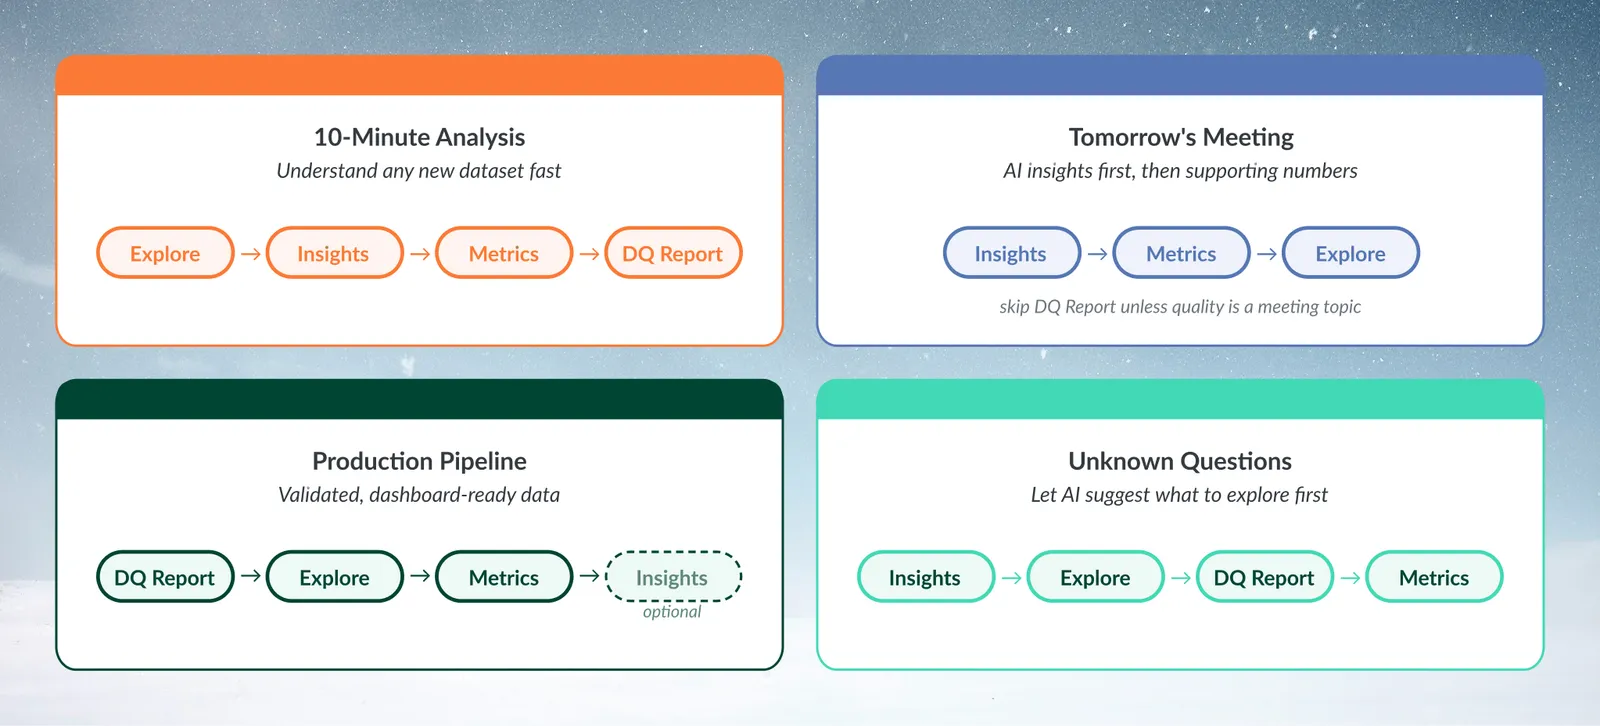
| "I have 10 minutes to understand this dataset" | Explore Cards | View Insights, a few metrics, then the Data Quality Report. Use any time left to plan next steps |
| I need to check data quality before building a pipeline | Data Quality Report | |
| "This data feeds our production dashboard" | Data Quality Report | Explore Cards for thresholds, Metrics for exact KPIs. View Insights is optional |
| I want a quick summary of key numbers | Metrics panel | |
| "My boss needs insights for tomorrow's meeting" | View Insights | Metrics for the numbers, Explore Cards if questions come up. Skip the Data Quality Report unless quality is on the agenda |
| I want AI to tell me what's interesting in my data | View Insights | |
| "I'm not sure what questions to ask" | View Insights | Explore Cards to follow its leads, the Data Quality Report for limits, then Metrics for ratios you find |
| I want to investigate a specific pattern or segment | Explore Cards | Filter by clicking values |
For a full analysis, use all four in sequence: see Use the explore tools together.
What each tool is good for, and not for
| Tool | Good for | Not for | Example |
|---|---|---|---|
| Explore Cards | A first look at new data, value distribution checks, spotting outliers, testing filter logic before you automate it | AI business observations, a full quality score, or calculations beyond the card statistics (Sum, Min, St.Dev, Avg and Max for numbers; Earliest and Latest for dates) | "I uploaded sales data and want to see the spread by geography before I build regional reports." |
| Metrics panel | Specific KPIs, ratios and percentages, watching a number as you filter, comparing aggregations. It prepares numbers for dashboards but does not create dashboards | Basic column statistics (Explore Cards already show them) or full data profiling | "I'm building a sales dashboard and need conversion rate, average deal size and quota attainment." |
| View Insights | Briefings, finding trends you didn't know to look for, "what should I know about this data?" | Quality scores or interactive exploration | "I need to present quarterly results to the board and want the main trends highlighted." |
| Data Quality Report | Checks before production, audit and compliance evidence, planning which cleaning steps to build. Run it as soon as you connect a new data source, and fix critical issues before you spend time on a pipeline | Quick exploration, or issues you already know and accept | "This data feeds our finance dashboard. I need to check it before executives see it." |
View Insights limits (no follow-up questions, no export, current View only) are on View Insights.
The Data Quality Report recommends tasks but has no one-click apply; its limits are on Check data quality.
What each explore tool sees and when it refreshes
| Tool | Data it reads | When it refreshes |
|---|---|---|
| Explore Cards | The View after its pipeline, narrowed by your explore filters | As you filter and as the View's data changes |
| Metrics panel | The same, unless a metric is locked | As you filter and as the View's data changes |
| View Insights, Data Quality Report | The whole View after its pipeline; explore filters don't change it | Only when you click the button. A saved result is cleared when the View's data changes |
To make View Insights or the Data Quality Report look at a subset, add a Conditional Filter task to the pipeline. See Filter rows.
Troubleshooting explore tool choices
| Symptom | Cause | Fix |
|---|---|---|
| "I used View Insights but need specific numbers" | View Insights gives observations, not calculations | Use the Metrics panel |
| "The button showed 5 Key Insights but now I get 3" | The AI sets the count each time, between 3 and 7, and it can differ on the same data | Nothing to fix. You can't set the count |
| "The Data Quality Report found issues but I need quick insights" | Patterns on dirty data can mislead | Build the recommended tasks for critical issues first, then run View Insights |
| "Explore Cards don't show the patterns I expected" | A card to the right of a filtered card shows only the filtered rows (its header notes this), or the column has no card | Use Clear filters, and check you added the columns you want |
| "The tools give different numbers" | Explore Cards and Metrics follow your explore filters; View Insights and the Data Quality Report don't | Clear the explore filters, or add a Conditional Filter task so every tool reads the same rows |
Related
- Use the explore tools together: sequences for a new dataset, a briefing or a production pipeline.
- Explore Cards: filter the grid by clicking values.
- View Insights: get an AI summary.
- Data quality report: score the View and get suggested fixes.
Something wrong? support@mammoth.io