Create test data with AI or a sample file
When you don't have real data yet, Mammoth gives you two options in the New dataset dialog. Generate with AI builds a dataset (up to 500 rows) from a plain-language description. Sample Files loads one of the built-in sample datasets. Both give you an ordinary dataset to test pipelines, prototype dashboards, train people or run demos.
Generate a dataset with AI
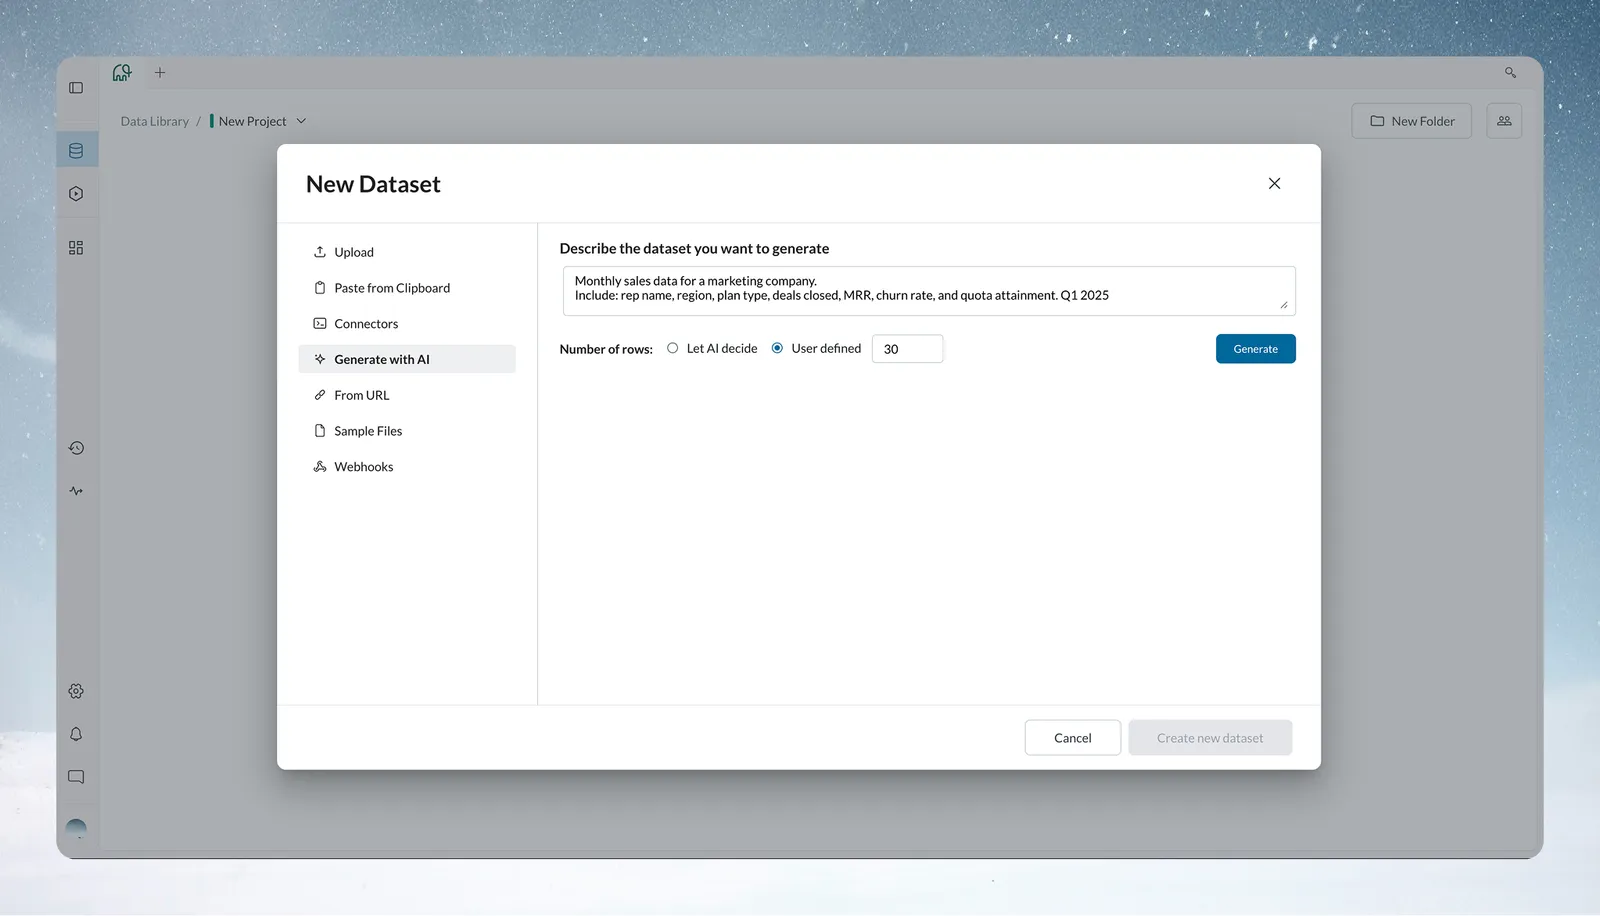
- In the Data Library, click New dataset, then Generate with AI.
- Describe the dataset you want in plain language.
- Set the row count. User defined is selected by default with 30 rows. Enter an exact number from 1 to 500, or choose Let AI decide.
- Click Generate and wait for the preview to load.
- Check the suggested dataset name (you can edit it), the columns and the sample records. The preview is read-only. Select the X button in the preview bar to discard it.
- Click Create new dataset. To change the result instead, click the collapsed prompt to edit it (this discards the preview), then click Generate again.
The new dataset appears in the Data Library.
From your prompt, the AI works out column names and data types, realistic value ranges (sensible dates and prices), relationships between columns (defects rise with temperature, sales peak in holidays) and industry patterns (financial quarters, manufacturing shifts, appointment types).
When to use AI-generated data
| Use | Example |
|---|---|
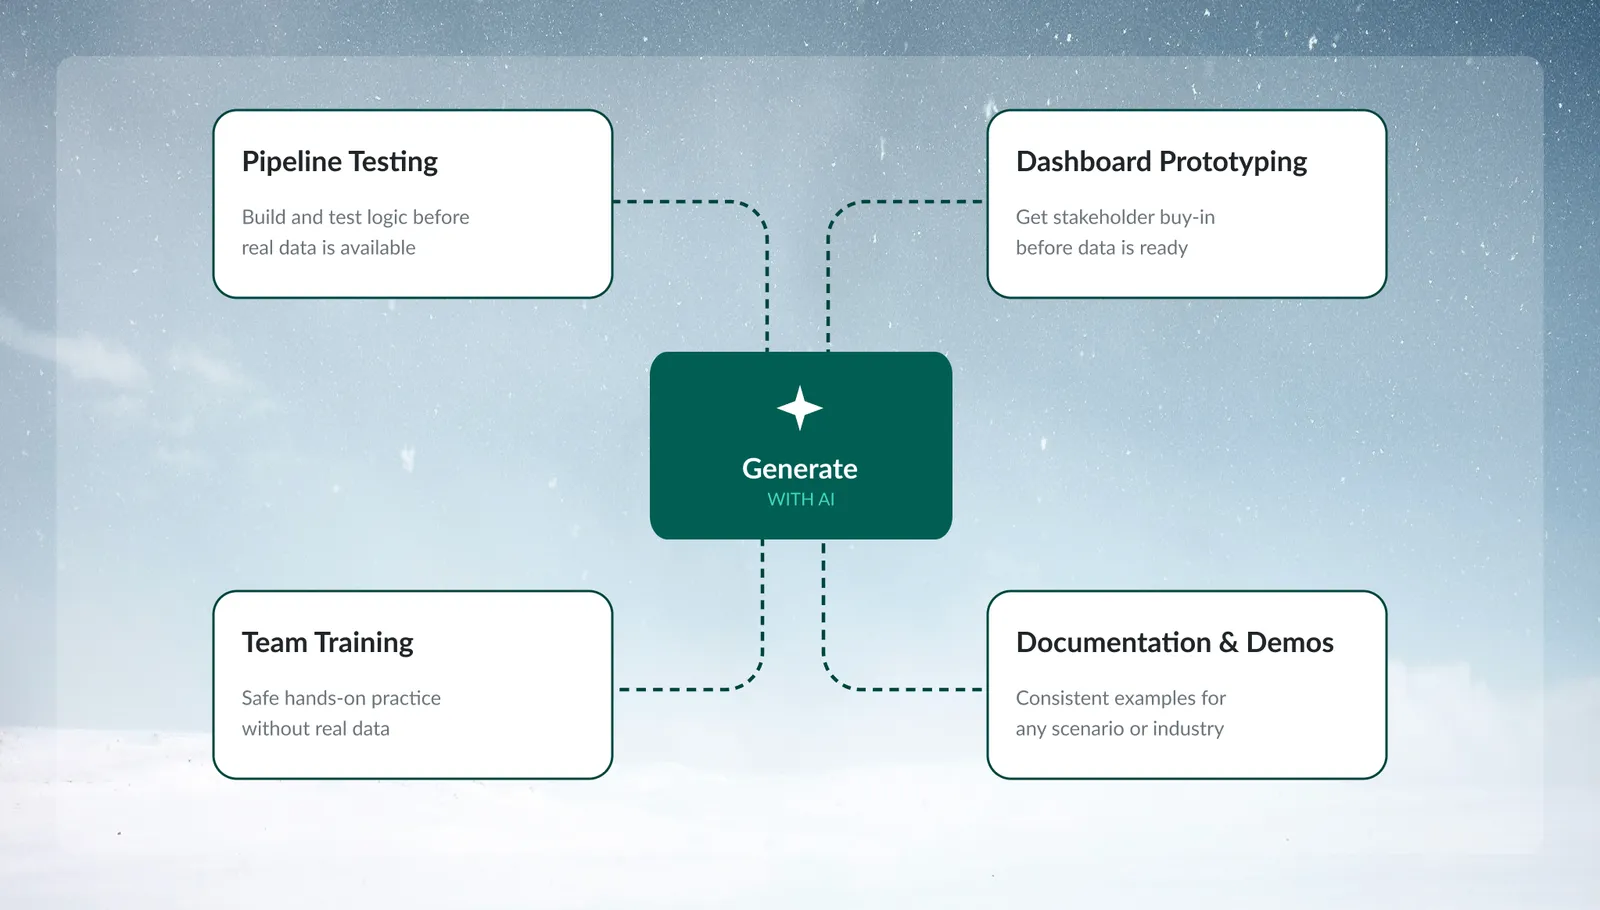
| Pipeline testing | IT is still setting up database access, but you need to start the monthly sales report. Generate sales data with the expected columns, build the pipeline, then swap in real data. |
| Dashboard prototyping | The board meets in 2 weeks and the warehouse is a month away. Generate executive metrics, build the layout and get the design and KPIs approved. |
| Team training | New analysts can't see customer data during training. Generate customer transactions for hands-on practice. |
| Documentation and demos | Generate industry-specific datasets for tutorials, guides and sales demos. |
Write prompts that generate useful data
| Instead of | Write |
|---|---|
| "Generate sales data" | "Generate sales data with date, salesperson, product, quantity, unit price, total amount, and customer region" |
| "Include dates and amounts" | "Include order dates from January-March 2024, dollar amounts between $100-$5000" |
| "Add temperature and defect columns" | "Add temperature readings and defect counts, where defects increase when temperature exceeds 80°F" |
| "Include employee data" | "Include employee data with ID, department, hire date, salary - where IT department salaries are 20% higher" |
Tip: Start with a broad prompt to get the basic structure, then regenerate with more specific constraints.
Example prompts and results
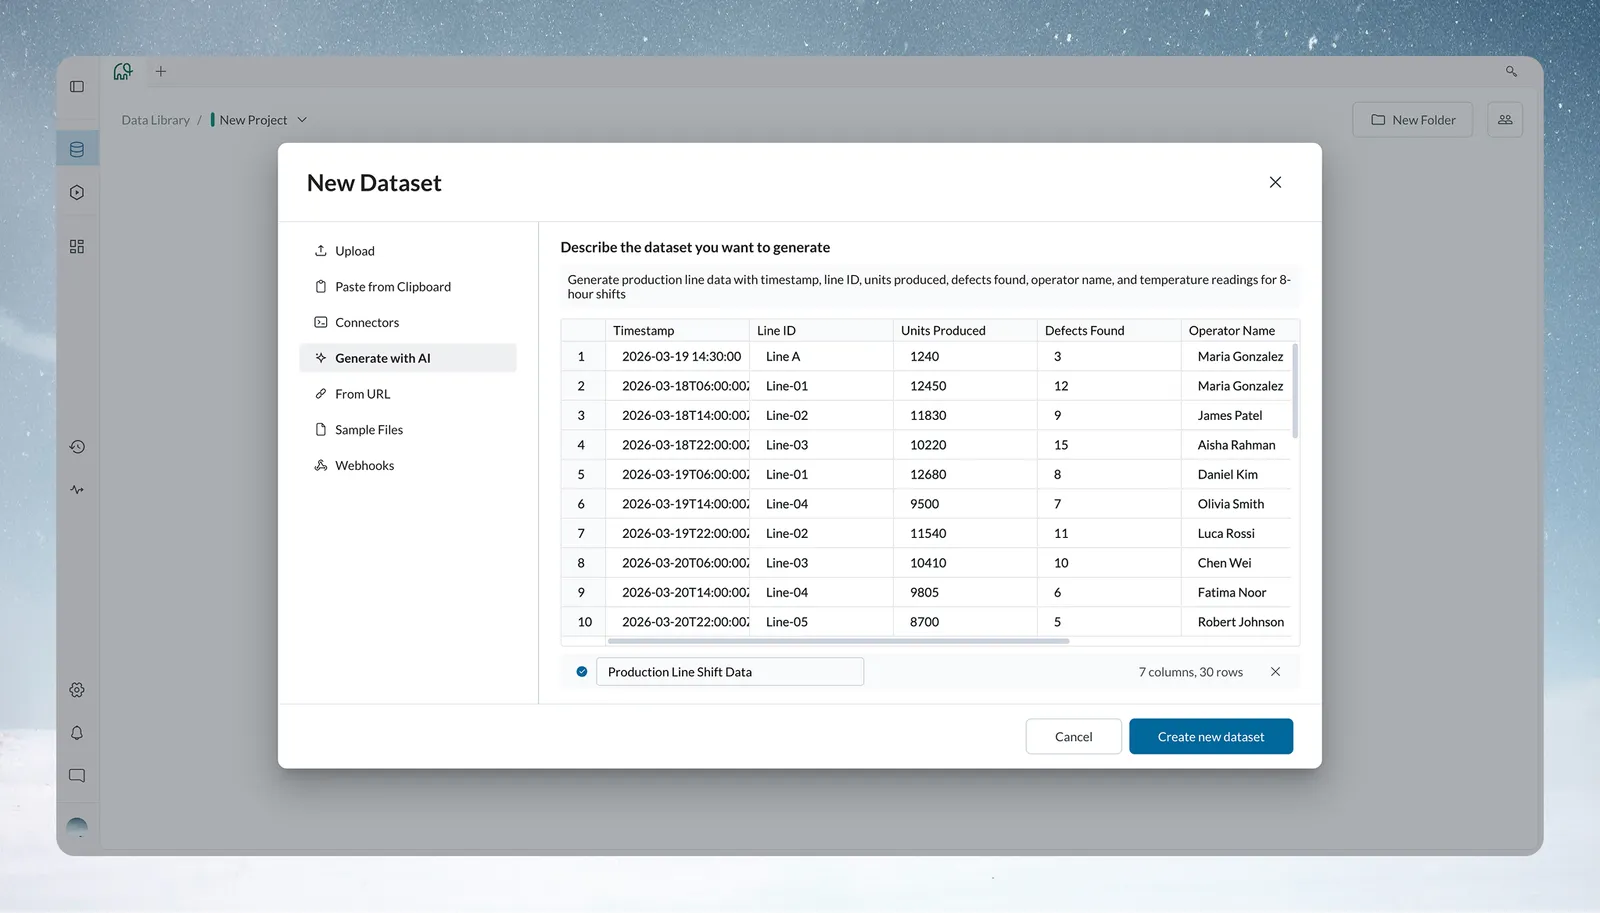
Manufacturing. Prompt:
Generate production line data with timestamp, line ID, units produced,
defects found, operator name, and temperature readings for 8-hour shifts
Result: 30 rows; average, minimum and maximum temperature per shift (°C); 8 hours per record; realistic operator names rotating across records; temperatures of 20–26°C with natural variation; a shift-level production summary.
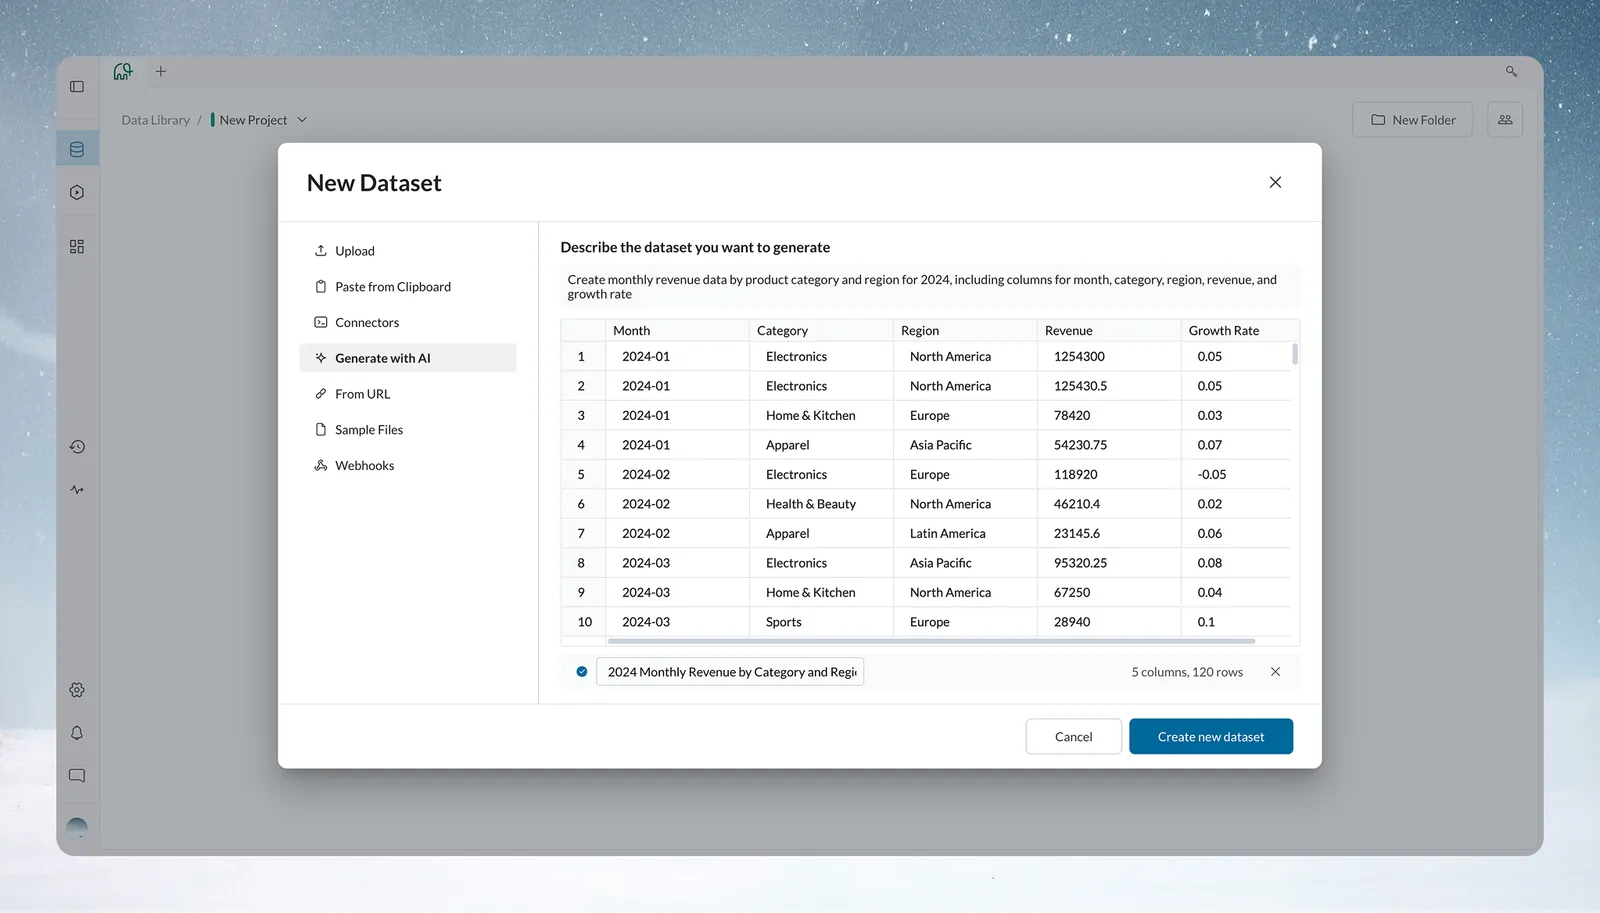
Financial services. Prompt:
Create monthly revenue data by product category and region for 2024,
including columns for month, category, region, revenue, and growth rate
Result: 120 rows (an AI-chosen size); columns Month, Category, Region, Revenue and Growth Rate; months of 2024 in YYYY-MM format; revenue with decimals; growth rates such as -0.05 to 0.05; categories and regions chosen from the prompt.
Healthcare. Prompt:
Generate patient appointment data including appointment ID, patient demographics,
appointment type, provider name, insurance type, and appointment date/time
Result: sequential appointment IDs (APT-2024-0001); a realistic age and gender spread; types such as Physical, Specialist, Lab Work and Follow-up; providers with matching specialties; insurance such as Medicare, Blue Cross, Aetna and Self-Pay; times in business hours.
E-commerce. Prompt:
Create customer transaction data with order ID, customer name, product,
quantity, price, order date, and shipping address for online retail
Result: order IDs in ORD-20240001 format; realistic customer names (no actual people); electronics, clothing and home goods; 1-5 items per order; prices of $15-$300 matched to category; recent dates with weekend and holiday patterns; realistic US addresses (no real locations).
Refine a first generation
Check the first result: do the column names, types and value ranges make sense, and are the columns related the way they should be? Then refine:
Original: "Generate customer data"
Refined: "Generate customer data with ages 18-75, email addresses,
phone numbers, and purchase amounts between $25-$500"
Original: "Include sales rep and revenue"
Refined: "Include sales rep and revenue, where senior reps
(5+ years experience) have 30% higher average deals"
Original: "Generate order data"
Refined: "Generate order data including some cancelled orders (10%),
partial refunds, and missing shipping addresses for pickup orders"
Regenerate when column names don't match your expected schema, values look wrong for your industry, or important relationships or business rules are missing. Accept when the structure is close enough for testing and the goal is pipeline testing, not analysis.
Swap generated data for real data later
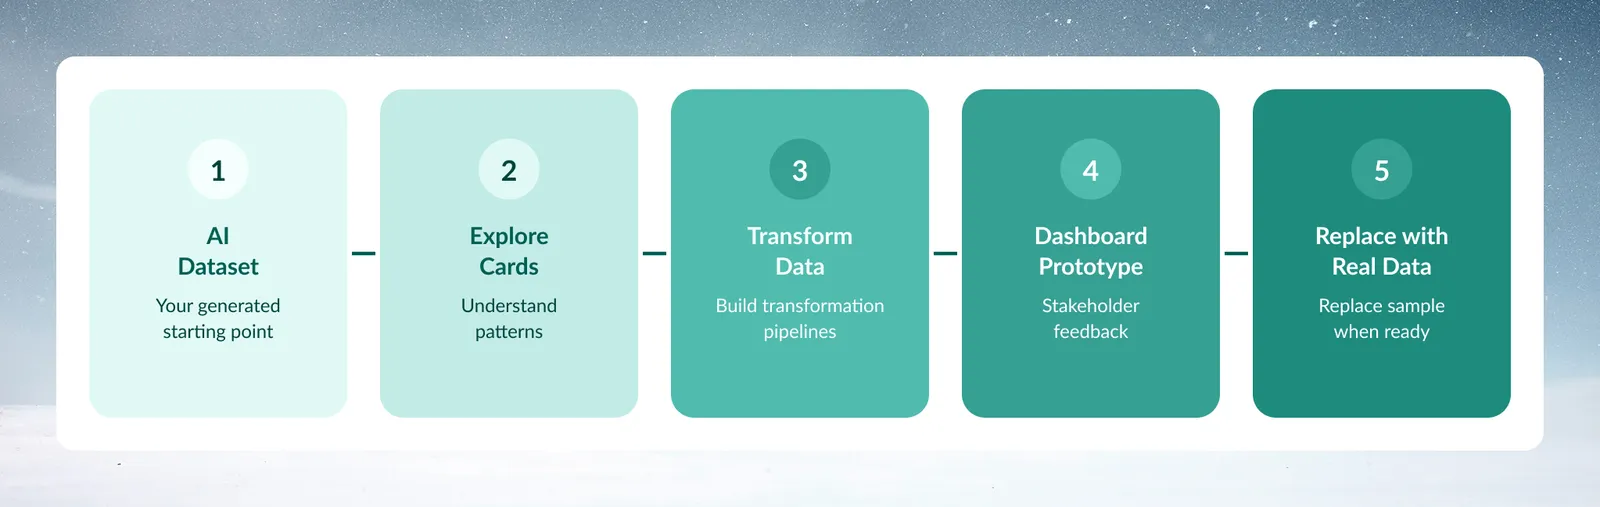
Generated datasets work as placeholders in a generate, build, replace workflow:
- Generate sample data that matches the schema you expect.
- Build the transformation pipeline on it.
- Test the logic and business rules.
- Validate the output format and dashboard fit.
- Replace it with a connector or a file upload when real data arrives.
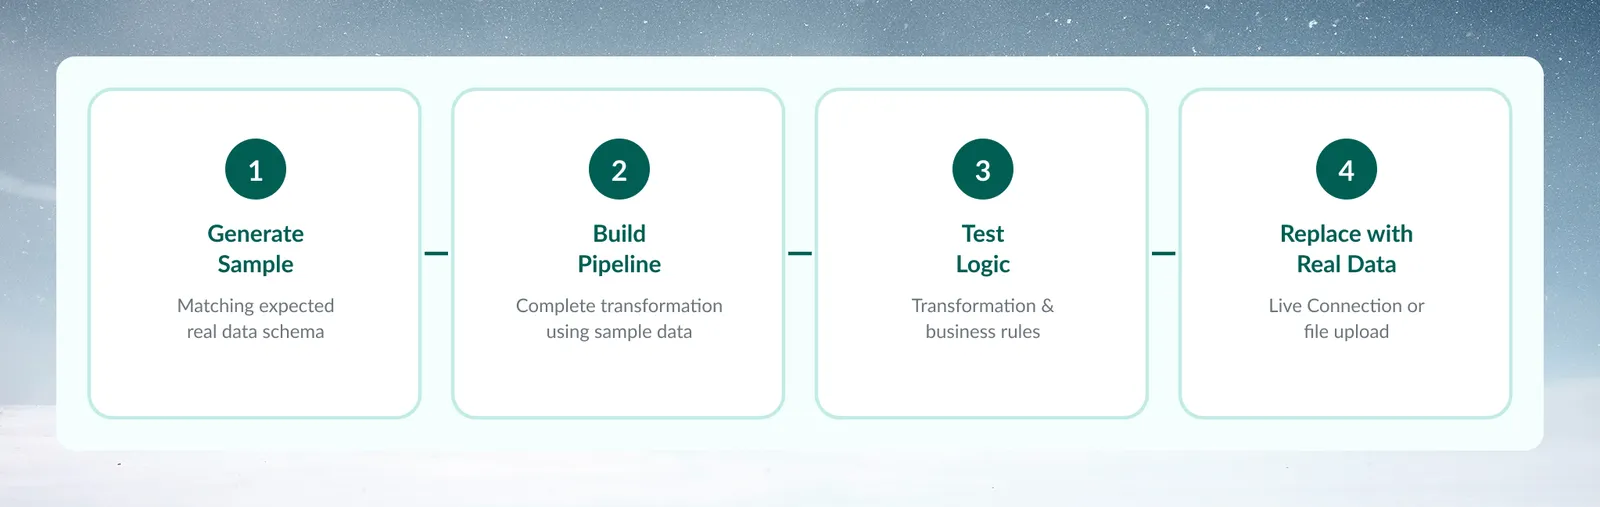
To keep the schema close to production, name exact columns, formats and relationships in the prompt:
Good prompt: "Include columns named customer_id, order_date,
product_sku, quantity, unit_price"
Good prompt: "Use YYYY-MM-DD date format, decimal prices
with 2 decimal places, integer quantities"
Good prompt: "Each customer should have 1-5 orders,
each order should have 1-3 line items"
See Add or replace data in a dataset for replacing the rows.
What AI-generated data can't do
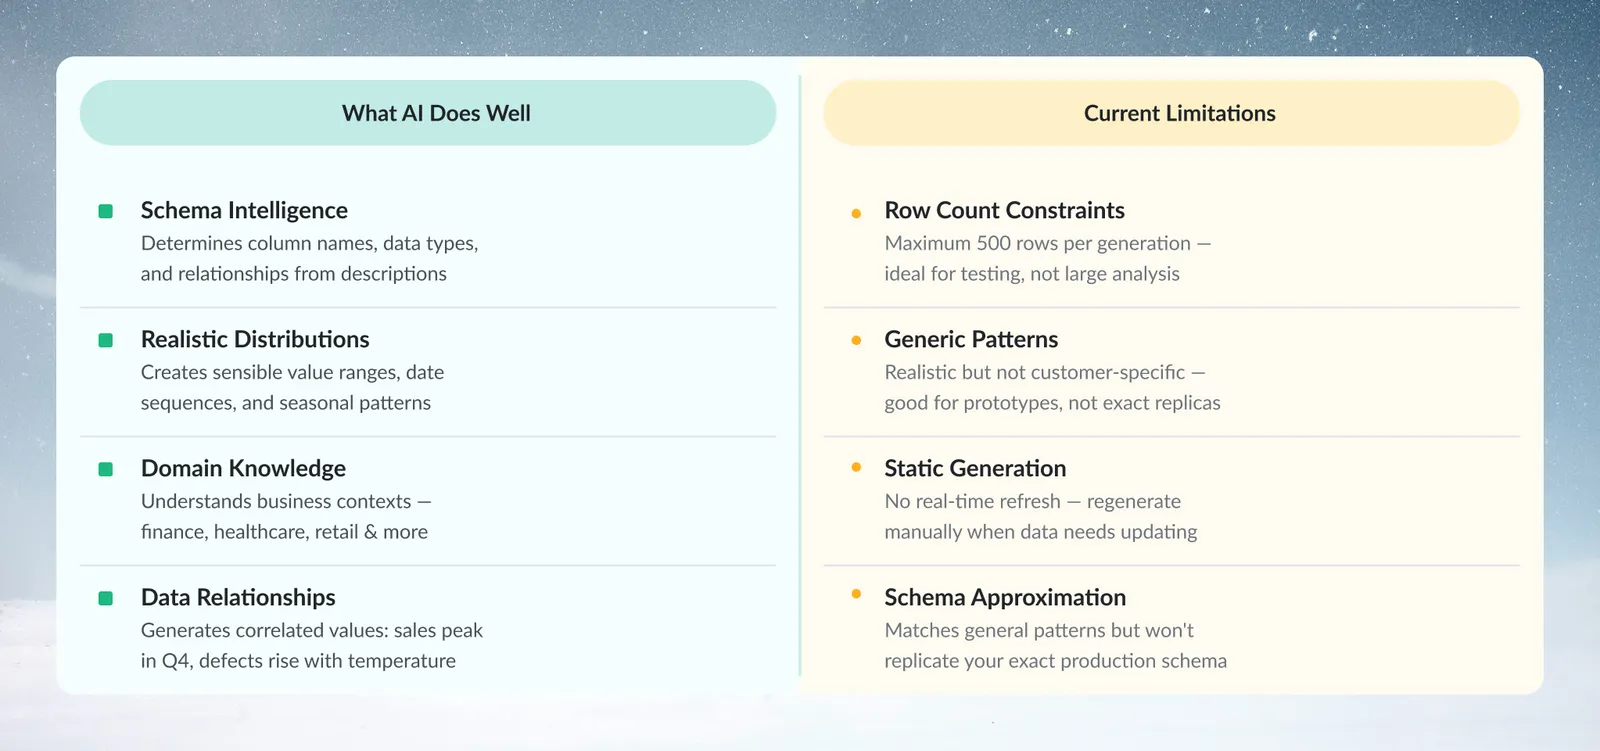
- Row count: with User defined, the maximum is 500 rows per generation (see Limits and quotas). That suits testing, not analysis.
- Generic patterns: distributions are realistic but not specific to your business.
- Static: no refresh. Generate again if you need new data.
- Approximate schema: it follows general patterns but won't exactly copy your production schema.
Troubleshooting AI-generated data
| Symptom | Fix |
|---|---|
| Column names or types aren't what you expected | Name the exact columns and formats in the next prompt |
| Values look unrealistic (prices, date ranges, patterns) | Add constraints: "prices between $X-$Y", "dates in 2024 only", "include seasonal patterns" |
| Columns that should be related look independent | Describe the relationship: "higher prices should correlate with luxury categories" |
| Your production schema is too complex | Generate the core columns needed for testing first, then add detail through refinement |
Load a built-in sample dataset
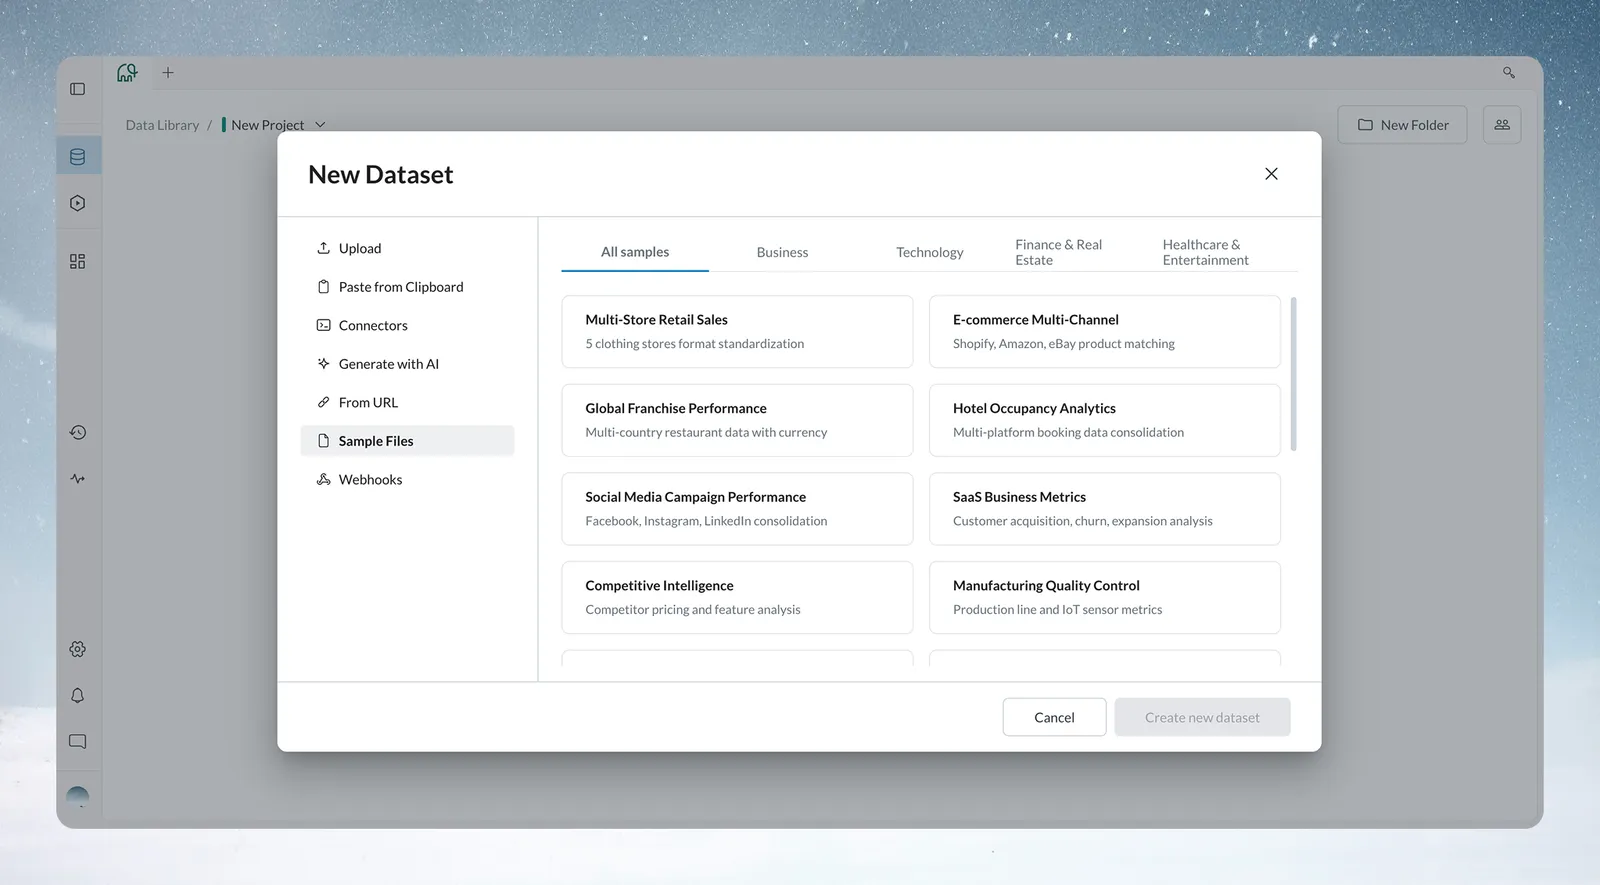
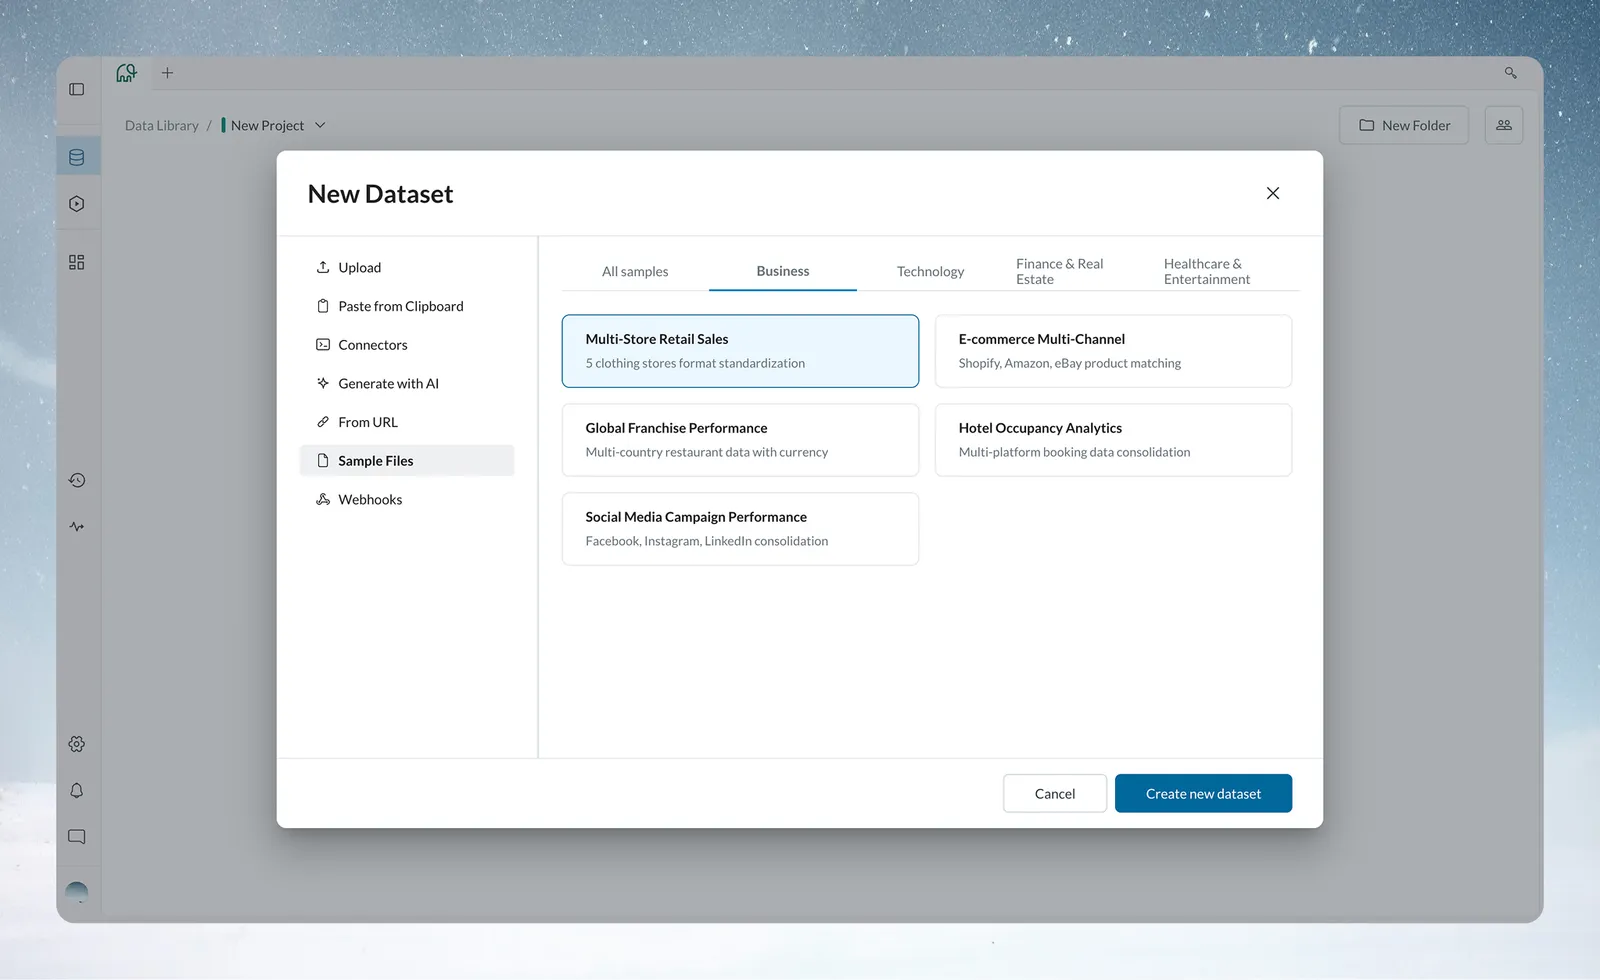
- Click New dataset in your project.
- Select Sample Files.
- Choose the All samples tab, or one of the Business, Technology, Finance & Real Estate, or Healthcare & Entertainment tabs, and read the descriptions.
- Click the card of the dataset you want. The card is highlighted; there is no data preview.
- Click Create new dataset. The dataset appears in the project, ready to explore.
Sample files need no preparation, hold no sensitive data, and give a team identical data to practise on. They are also useful for demos with familiar patterns.
Sample datasets you can load
Each sample is a CSV file of 25 to 63 rows, so it loads quickly and is easy to inspect.
Business samples
| Dataset | Description |
|---|---|
| Multi-Store Retail Sales | 5 clothing stores format standardization |
| E-commerce Multi-Channel | Shopify, Amazon, eBay product matching |
| Global Franchise Performance | Multi-country restaurant data with currency |
| Hotel Occupancy Analytics | Multi-platform booking data consolidation |
| Social Media Campaign Performance | Facebook, Instagram, LinkedIn consolidation |
Technology samples
| Dataset | Description |
|---|---|
| SaaS Business Metrics | Customer acquisition, churn, expansion analysis |
| Competitive Intelligence | Competitor pricing and feature analysis |
| Manufacturing Quality Control | Production line and IoT sensor metrics |
| Supply Chain Optimization | Global vendor performance and delivery |
| Media & Entertainment ROI | Cross-platform content performance |
Finance & Real Estate samples
| Dataset | Description |
|---|---|
| Financial P&L Consolidation | Multi-subsidiary revenue with currency conversion |
| Credit Risk Assessment | Multi-bureau loan data risk scoring |
| Real Estate Portfolio Analytics | Multi-market property performance and occupancy |
| Construction Project Tracking | Multi-site timelines, costs, resources |
Healthcare & Entertainment samples
| Dataset | Description |
|---|---|
| Patient Outcome Tracking | Clinical data ID standardization and metrics |
| Educational Institution Analytics | Student performance, enrollment, resource data |
| Non-Profit Fundraising Analytics | Multi-platform donor and campaign data |
| Sports Team Performance | Player stats, financials, fan engagement |
| Event Management Analytics | Multi-venue ticket sales and attendance |
Pick the right sample for your goal
| Goal | Sample | Why |
|---|---|---|
| First look at Mammoth | Multi-Store Retail Sales | Familiar sales, products and regions; suits several transformations, data quality checks, aggregation and filtering |
| Advanced features | E-commerce Multi-Channel or Supply Chain Optimization | Multi-source scenarios, standardization problems, harder calculations |
| Team training | Match your industry (Manufacturing to Quality Control, SaaS to Business Metrics) | People recognise the patterns and problems |
| Client demos | An industry-specific dataset | Stakeholders recognise the data and the business problem |
Tip: Choose sample data that matches your team's domain, for example a manufacturing quality dataset for an operations team.
Practise with a sample dataset
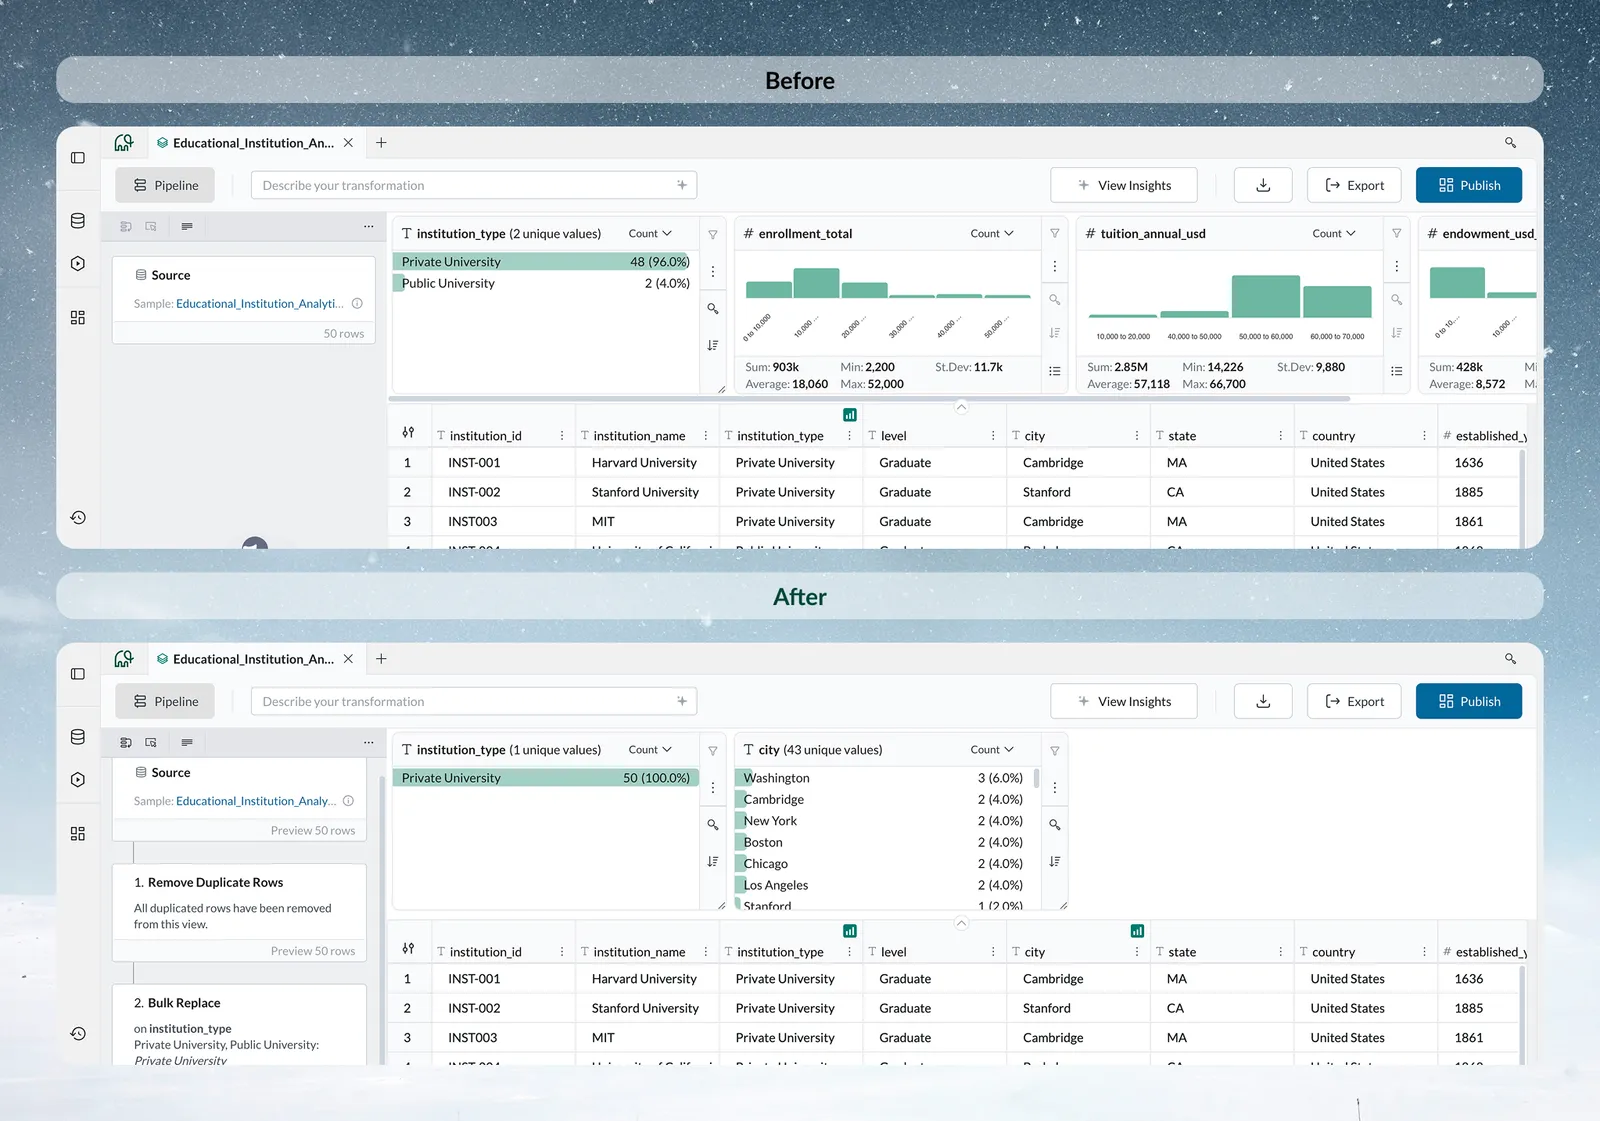
- Check data quality with Explore Cards: distributions, missing values, outliers and inconsistencies.
- Try several transformation types: cleaning (standardize company names), filtering (remove test data, focus on a region or period), aggregating (totals, averages, growth rates) and joining.
- Build an example pipeline: monthly sales reports (Multi-Store Retail), customer lifetime value (SaaS Business Metrics), campaign ROI (Social Media Campaign Performance) or quality tracking (Manufacturing Quality Control).
A first session takes about 15 minutes: pick Multi-Store Retail Sales (2 minutes), explore it with Explore Cards (5 minutes), build a filter pipeline (5 minutes), and generate a sales-by-region dashboard (3 minutes).
Tip: Build your demo pipeline on sample data before a client meeting. You can then repeat the same transformations on their actual data.
What sample files are not
- They aren't your business data or production-ready datasets. They are learning tools and starting points.
- They are smaller than production data, may not include every edge case, and are clean enough to focus on learning Mammoth rather than cleaning.
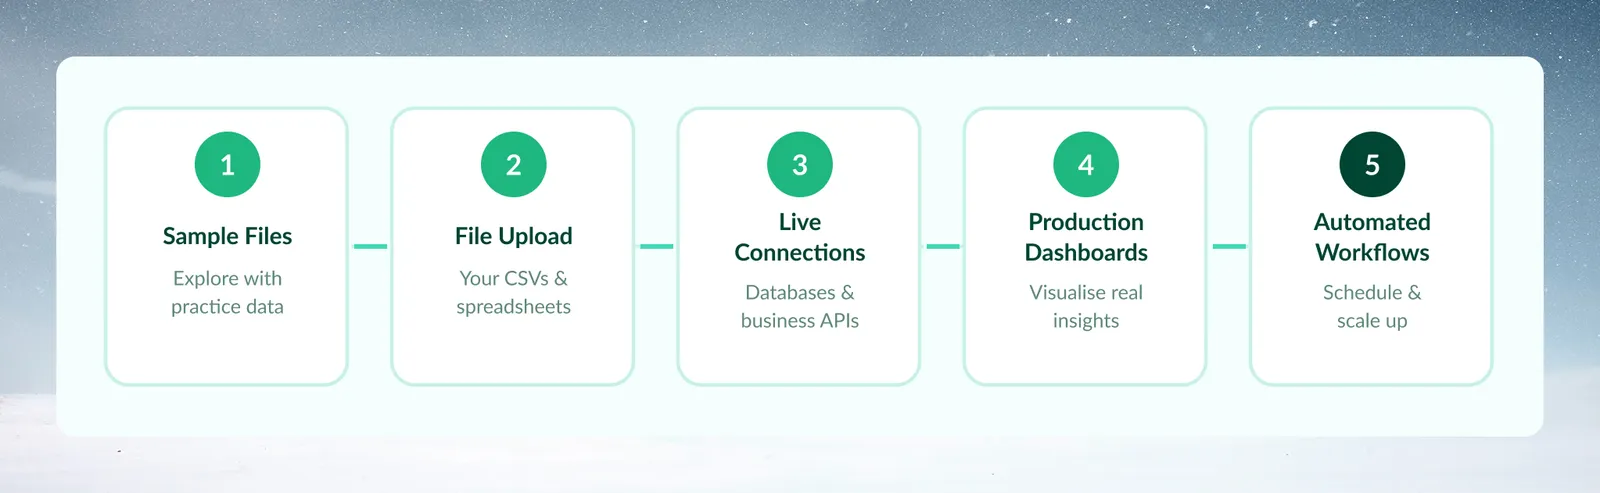
Move to your own data when you are comfortable with basic transformations, need to solve a specific business problem, or want to build production dashboards. Note which transformations worked on the sample, and start with a subset of your real data.
Related
- Upload files: bring in your own CSV or Excel files.
- Connect a database or app: connect your real systems.
- Add or replace data in a dataset: swap generated rows for real ones.
- Explore cards: explore the new dataset.
- How the pipeline works: build your first pipeline.
- Create a dashboard: visualize the results.
Something wrong? support@mammoth.io