Set up a dashboard chart: measures, groups and axes
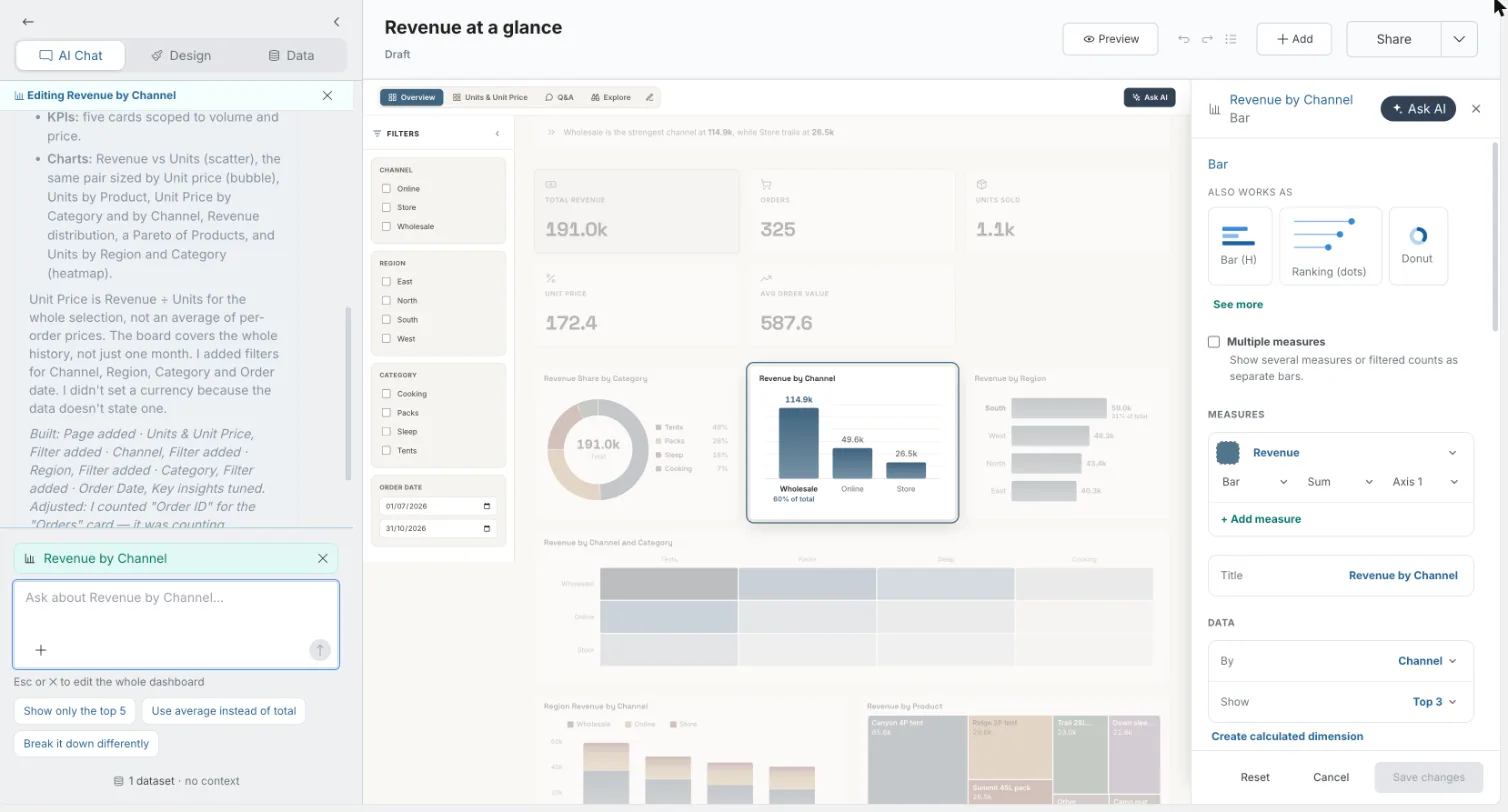
Every chart on a Mammoth dashboard can be edited by hand, as well as through the AI chat. In the dashboard editor, click a chart and its edit panel opens beside the canvas, with its fields, measures and options. Anyone who can edit the dashboard can change its charts, and every change redraws the chart straight from your data: no AI is involved in the field and style controls.
Open a chart's edit panel
- Open the dashboard in the editor.
- Click the chart on the canvas, or hover over it and click Edit in its toolbar.
The panel opens on the right, docked beside the live canvas, so the canvas is your preview. The panel's title is the chart's title, with the chart type under it. Edits show on the canvas as you make them.
The panel is one scrolling column. Its sections, top to bottom:
- The chart type, with Also works as and See more to switch type. See Switch a chart to another chart type.
- Multiple measures (Bar and Bar (H) only).
- Measures (charts that can mix bars, lines and areas).
- Title.
- Data: the field pickers and Create calculated dimension.
- Annotations.
- Options for this chart type, under the headings Data, Style, Labels, Axes and Annotations. See Chart style, annotations and captions.
- Readers can. See What readers can do with a chart.
- Add a caption.
Only the sections that apply to the chart type appear. The same controls appear in the studio when you first add a chart, except Readers can, which is only in the edit panel.
The Ask AI button in the panel header ("Ask AI about this") closes the panel and puts the cursor in the AI chat, with this chart selected. See Ask the AI about one chart or block.
Save or discard your chart changes
If you close the panel with changes, Mammoth asks Save your changes?: "Save the changes you made in this panel, or discard them and restore how things looked when you opened it."
| Button | What it does |
|---|---|
| Keep editing | Returns to the panel. |
| Discard | Puts the chart back the way it was when you opened the panel, including its caption. |
| Save changes | Keeps your edits. |
Rename a chart with the Title field
Type in Title to rename the chart. A title you type stays when you later change the measure, the By field or the chart type. If you leave the automatic title, it updates to match the fields.
Choose the chart's fields: Measure, By, Split by and Show
The Data section points the chart at your columns. Each row is a dropdown of the dataset's fields. Only the rows the chart type uses appear.
| Field | What it does |
|---|---|
| Measure | The number to chart. Count of records counts rows. An empty measure reads Choose a measure…. |
| X, Y | Replace Measure on Scatter and Bubble charts. And is a second measure on charts that take two. |
| By | The category to break the measure down by. Pick a date field under Over time to turn the chart into a time axis, or a calculated dimension under Calculated. KPI, Big number, Icon stat, Gauge and Histogram have no By. |
| Rows, Columns | The two categories of a Heatmap, Sankey, Sunburst or Network. |
| Split by | A second category that splits each bar or area. Only on Stacked bar, 100% stacked, Stacked area and Marimekko. |
| Aggregate | How rows are rolled up: Sum, Average, Minimum, Maximum, Count, Distinct or Median. On charts with a Measures section, each measure has its own aggregation instead. |
| Show | How many categories to show: All, Top 5, Top 8, Top 10, Top 15, Top 20 or Custom… (type any number up to 200). |
Show only the top 10 categories in a chart
Use Show with Sort. For example, to show revenue for the top 5 regions:
- Set Measure to Revenue.
- Set Aggregate to Sum.
- Set By to Region.
- Set Show to Top 5.
Two options in the Data group below control order:
| Option | Choices | What it does |
|---|---|---|
| Sort | High → low (default), Low → high, A → Z, Z → A | The order of the categories. It also decides which rows a Top N keeps. |
| Display as | By rank (default), A → Z, Z → A | Shows the kept rows in another order. For example, the top 5 by revenue, displayed A to Z. |
Both are hidden when the chart's By is a date.
Show several measures as separate bars
On a Bar or Bar (H) chart, switch on Multiple measures ("Show several measures or filtered counts as separate bars."). Each measure becomes one bar, so the bars are the measures themselves and there's no By. Use it for charts like "how many records are flagged A, B or C". A chart that already has several measures opens with the switch on.
Each row in Measures has:
| Control | What it does |
|---|---|
| Measure | Count of records (the default for a new row) or any number field. |
| Aggregation | Sum, Average, Minimum, Maximum, Count, Distinct or Median. |
| Move up, Move down | Change the bar order. |
| × | Removes the measure (when there's more than one). |
| Label | The bar's name. |
| Conditions | Count or sum only the rows that match. Click + Add condition, then pick a field (Choose a field), an operator and a value. |
Condition operators:
| Operator | Value |
|---|---|
| equals | One Value |
| is one of | Values (comma-separated) |
| is between | Min and Max |
- For a text field, sample values show as chips you can click to fill in.
- A condition with no field or no value is ignored until you complete it.
- Click + Add measure for another bar.
- Chart conditions, below the measures, apply the same kind of condition to the whole chart. They combine with each measure's own conditions: a row must match both.
Example: to compare open, overdue and closed tickets, add three measures, each Count of records. Label them Open, Overdue and Closed, and give each a condition on Status.
Group a number column into ranges (calculated dimension)
A calculated dimension cuts a number column into named ranges, such as a "Spend band" of 0–100, 100–500 and 500+. You can then use it as a category in By.
- In the Data section, under the field pickers, click Create calculated dimension. It appears when the chart has a By field and the dataset has a number field.
- Fill in the dialog (table below).
- Click Create. It stays disabled until there's a name, a source measure and a label on every band.
| Field | What it does |
|---|---|
| Name | The dimension's name, for example "Spend band". |
| Source measure | The number column to cut. |
| Bands | One row per range: a Label, a Min and a Max. Add band adds a row and × removes one. |
| Uncovered rows | With Show as ticked (the default), rows outside every band are grouped under a name, Other by default. Untick it and those rows are Excluded. |
How bands work:
- Each band includes its Min and excludes its Max, so 100 falls in 100–500, not 0–100.
- Leave Min or Max empty for no lower or upper limit.
- Bands keep the order you entered them in.
The new dimension is saved to the dashboard, not only this chart. It appears in every chart's By list under Calculated. Readers can't open the rows or drill into a band. You can't edit or remove a calculated dimension from this panel after you create it, so check the bands before you click Create.
Combine bars and a line on two axes
On Bar, Bar (H), Line, Area, Grouped bar and Combo charts, the Measures section lists every measure on the chart. Each one can be drawn as bars, a line or an area, and placed on its own axis. Use it to show revenue as bars and margin % as a line on one chart.
Each measure row has:
| Control | What it does |
|---|---|
| Colour swatch | Set series color for this measure. × does Reset to auto color. |
| Measure | The field. |
| Draw as | Bar, Line or Area. |
| Aggregation | Sum, Average, Minimum, Maximum, Count, Distinct or Median. |
| Axis | Axis 1, Axis 2 and so on. Pick + New axis to give the measure its own scale. A chart can have up to 3 axes. |
| × | Removes the measure (when there's more than one). |
+ Add measure adds the next unused number column, drawn as a Line, on an axis that matches its unit.
- A second measure on a second axis turns the chart into a Combo.
- On a chart with more than one axis, each reference line and event in Annotations asks "Which axis this value belongs to".
Example: to plot revenue against margin:
- Set the first measure to Revenue, drawn as Bar on Axis 1.
- Click + Add measure and choose Margin %.
- Set Draw as to Line and the axis to + New axis.
Why Mammoth won't draw a forecast chart
Charts show what's in your data. They don't project it forward. If you describe a forecast or projection in the Add a chart describe box ("project next year's revenue"), Mammoth doesn't draw an invented line. The studio explains why in a sentence and previews the closest chart your data can show. A button adds it, such as "Add a Bar instead". You can add that chart, or describe another one.
Limits
| Item | Limit |
|---|---|
| Show → Custom… | Up to 200 categories |
| Axes per chart | Up to 3 |
| Calculated dimensions | Can't be edited or removed from the panel after you create them |
Troubleshooting chart field messages
| Message | What it means |
|---|---|
| "Choose a field for By to draw this chart." | You can't add the chart until By is set. |
| "Loading this dataset's fields…" | The field list is still loading. |
| "Couldn't load this dataset's fields. Reopen the panel to try again." | Close the panel and open it again. |
| "No measure resolved for this chart yet — try another type, or reload the dashboard." | Try another chart type, or reload the dashboard. |
| "Couldn't build a preview. Try a different chart or description." | Pick another chart type or change the description. |
| "No data matches the current filters." | The filters leave no rows. Change or clear them. |
Related
- Chart style, annotations and captions: colours, number formats, target lines and captions.
- What readers can do with a chart: filter, see the rows and drill down.
- Add and change charts: the chart picker and every chart type.
- Custom charts: draw a chart the library doesn't have.
- Filters: board filters that charts respond to.
Something wrong? support@mammoth.io