Views, pipelines and tasks in Mammoth explained
A view is where you explore and transform a dataset, its pipeline is the ordered list of tasks that run again on new data, and a task is one operation such as a filter or a join. Open a dataset from the Data Library to work in its view; Project Editors and Project Admins add tasks. For the whole hierarchy, see Core ideas.
View: where you explore and transform data
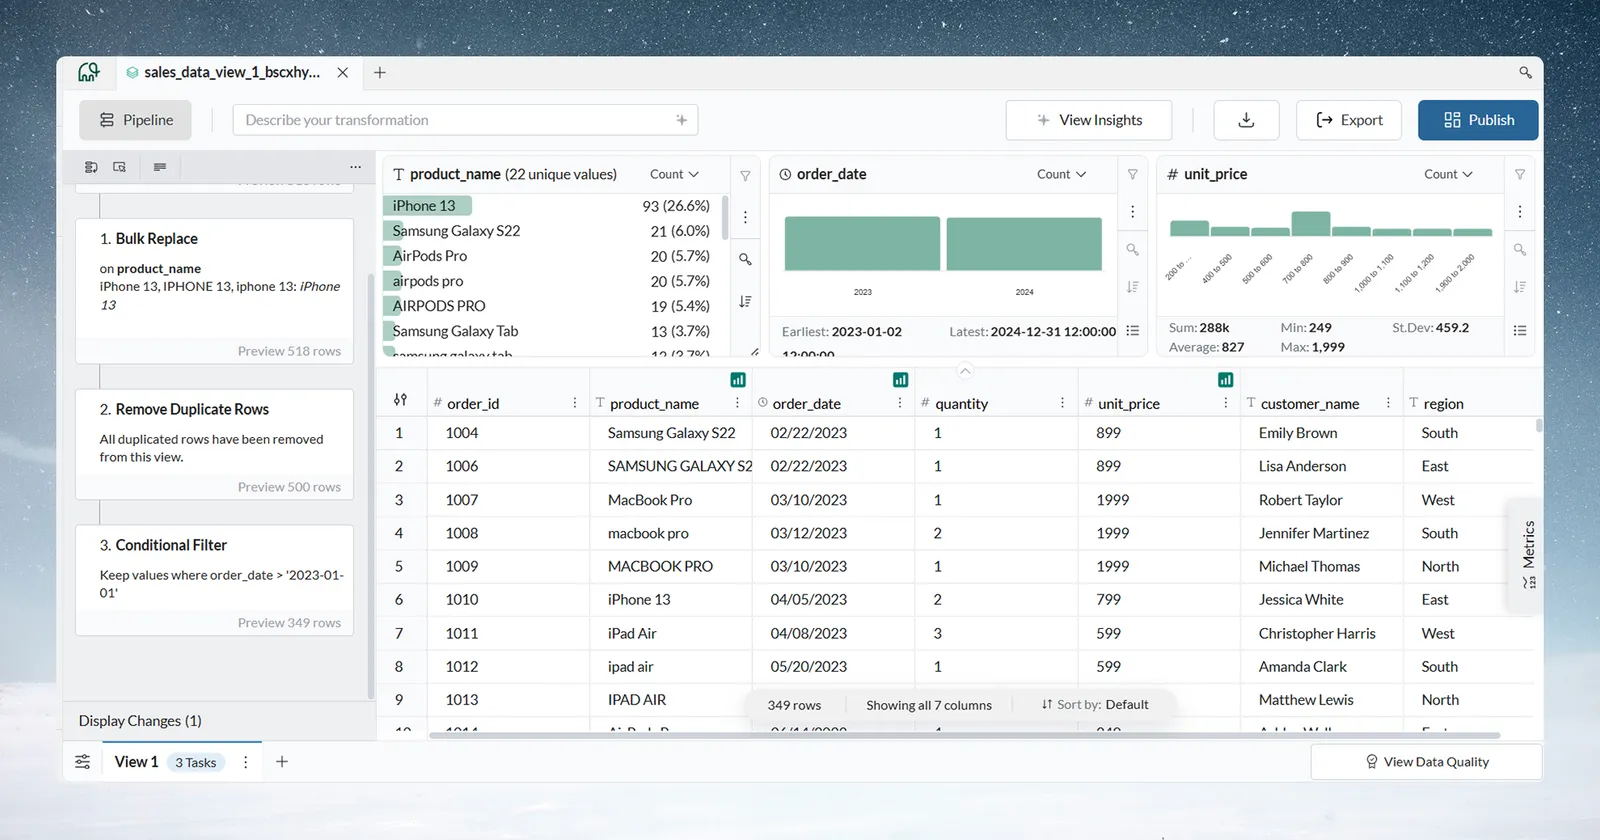
A View is the data editor for a dataset. It shows all active batches together in a data grid, with Explore Cards above it, a metrics panel for calculations, and the Pipeline panel on the left.
Every dataset opens in a default view. You can create more views of it, each with its own pipeline, for example one for executive reporting and one for detailed analysis. So one dataset can have several pipelines. A view never changes the source data. See Views: create, rename and delete.
Display changes versus pipeline tasks
| Display changes | Pipeline tasks | |
|---|---|---|
| Examples | Sorting, hiding or renaming a column, formatting a number or date column | Filters, joins, calculations |
| What they change | How the data looks in this view only | The view's output |
| Saved | With the view, but not as tasks | As tasks in the pipeline |
| On refresh, exports, dashboards | Not part of the output | Run again on refresh, feed exports and dashboards built on the view, and can be copied into another view |
A display change is like formatting an Excel sheet; a pipeline task is like a Power Query step that reshapes the data before anyone opens the sheet. See Rename, format and sort columns.
Pipeline: steps that run again on new data
Each transformation you apply in a view is added to its Pipeline as a task. Like a recipe, you write it once and cook it many times: when you add new data, it runs through the same steps without manual work.
| Property | Meaning |
|---|---|
| Sequential | Tasks run top to bottom, each on the output of the one above |
| Reusable | The same tasks run again on new data |
| Readable | Each task card shows its function and key settings |
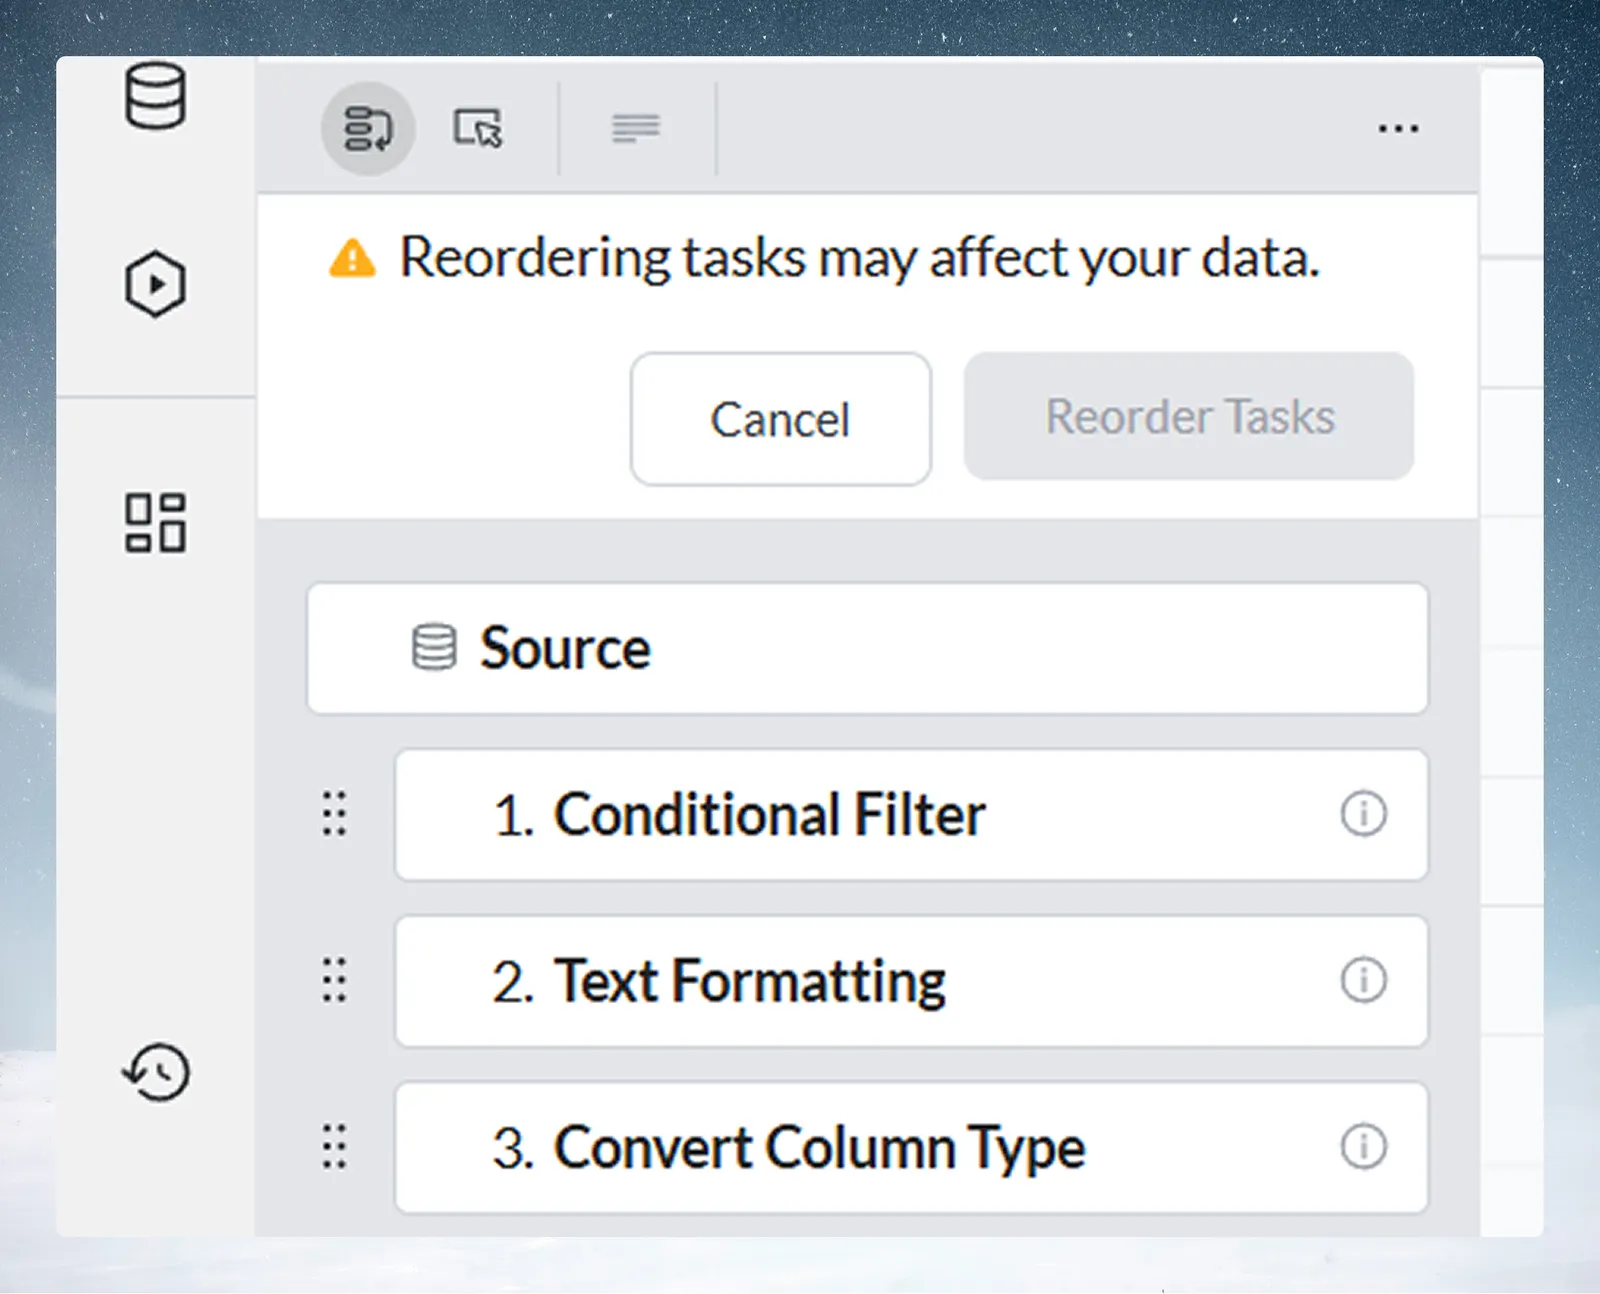
| Editable | Edit, suspend, reorder, copy or delete tasks at any time |
| Previewable | See the data as it was right after any task |
Pipeline Version history keeps earlier versions. See Edit, reorder and copy tasks.
Run tasks right away or in Draft mode
By default (Draft mode off), each task runs as soon as you apply it and the data grid updates. With Draft mode on, the tasks you add or change are queued, the Pipeline panel shows "Pipeline has Pending Updates", and the changes run together when you click Apply now. Turn Draft mode on from the More Pipeline options (...) menu.
Start with it off to see each result straight away; turn it on for large datasets or long sequences of changes.
Common pipeline patterns
| Purpose | Typical tasks in order |
|---|---|
| Cleaning | Filter, remove duplicates, standardise values, convert types |
| Combining | Join datasets, select columns, calculate new fields |
| Reporting | Filter to a period, group and aggregate, pivot for layout |
Task: one operation in a pipeline
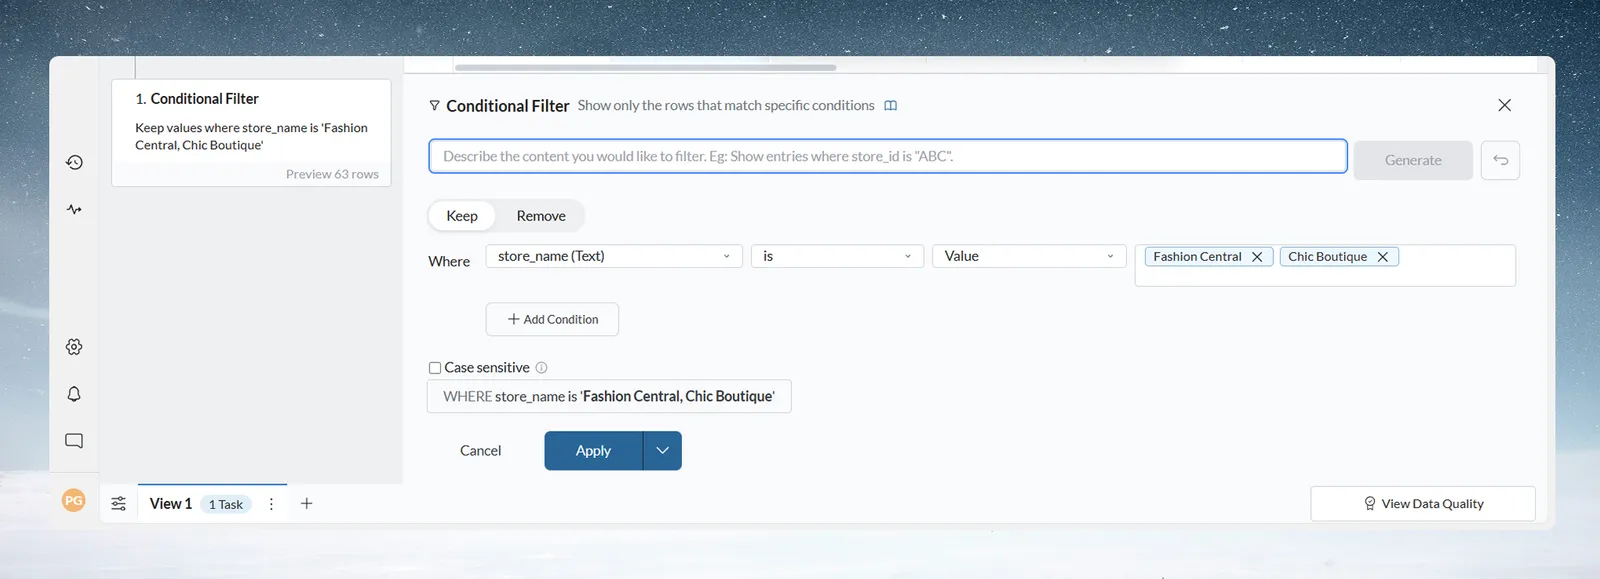
A Task is one operation, such as a filter, a join or a calculation: like one step in an Excel formula, but visual and reusable. Its position decides when it runs.
The Transform menu opens from the + button (tooltip "Add a task") or the Describe your transformation box, which searches the functions and always offers Ask in plain words with your text as its prompt. It has seven categories:
| Category | Functions |
|---|---|
| AI Powered | Ask in plain words and Generative AI, plus shortcuts to Extract Text, Bulk Replace and Conditional Filter |
| Filter, Label & Replace | Conditional Filter, Remove Duplicate Rows, Show Top/Bottom Rows, Edit Cells, Label & Insert Values, Fill Missing Values, Bulk Replace, Find & Replace |
| Date, Numeric & Text | Add/Subtract Date Values, Extract Date Part, Financial Year, Calculate Date Difference, Math Function, Window Function, Obtain Large or Small Values, Extract Text, Text Formatting, Extract JSON |
| Reshape, Group & Pivot | Group & Pivot, Unpivot |
| Column Management | Add Column, Copy Columns, Combine Columns & Text, Convert Column Type, Remove Column, Split Into Multiple Columns |
| Unify | Send to Dataset, Join, Lookup, Repeat Rows |
| Controls | Data Check, Checkpoint Alert |
The function panel shows a task's settings. Many functions preview the result before you click Apply, and the panel tells you when a setting is missing or wrong. See Calculate with formulas and the other pages in Clean and shape data.
Related
- Build your first pipeline: put these ideas to work on sample data.
- How the pipeline works: how tasks run, previews and Draft mode.
- Datasets and batches: the data a view reads.
Something wrong? support@mammoth.io