Read a number Explore Card: ranges, statistics, outliers
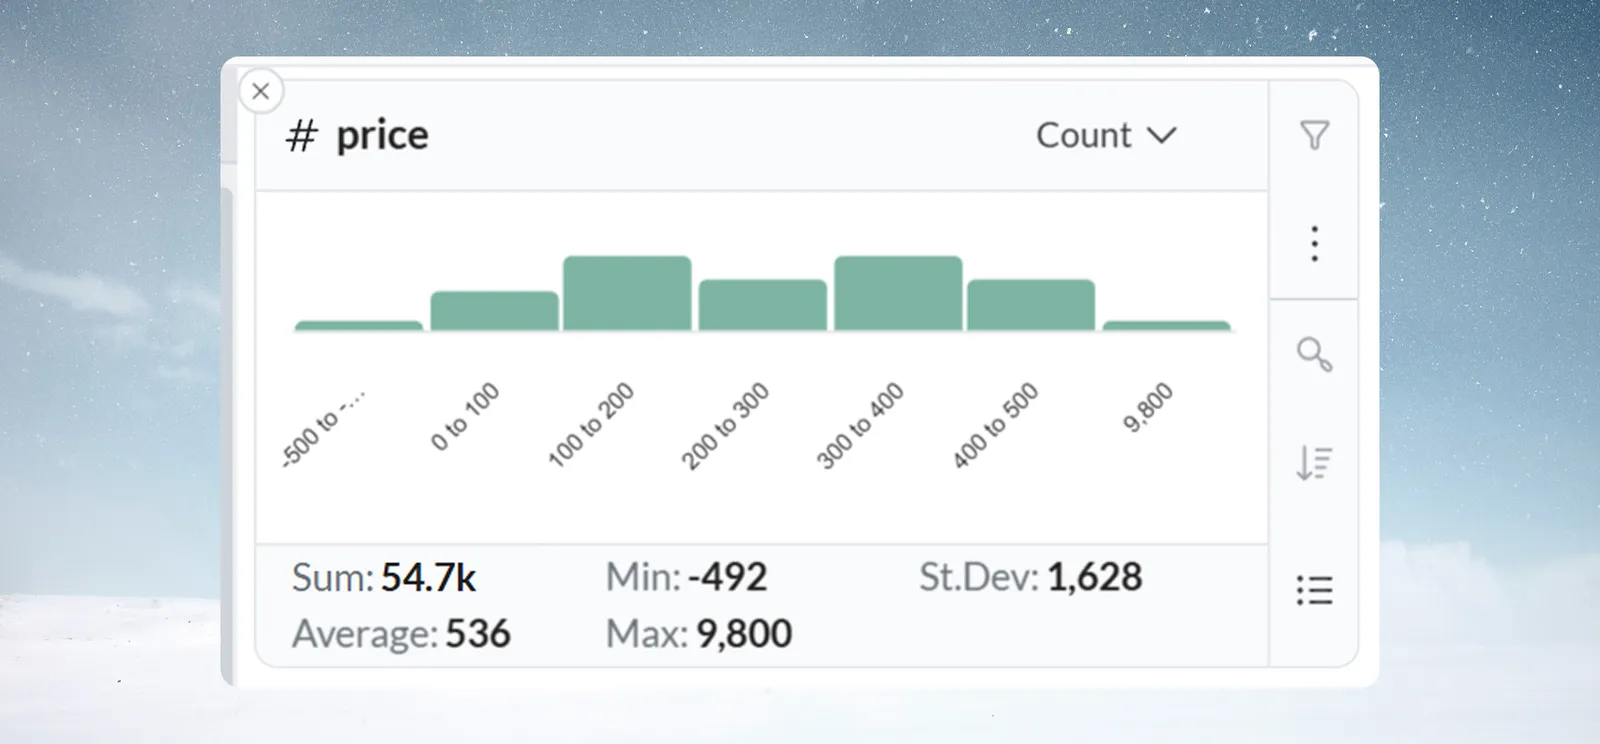
A number card shows a vertical bar chart. Each bar is a range of values, and its height shows how many rows fall in it; five statistics sit below. Add one with Add card in the Explore panel; the shortcuts that change values need edit access to the View.
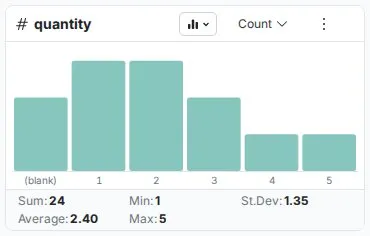
What a number card shows
- Range labels sit below each bar, for example "100 to 200". Blank values appear as a
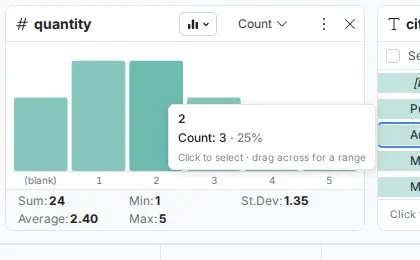
(blank)entry. - Hover a bar for its exact range, its count and its share of the rows, with the hint "Click to select · drag across for a range".
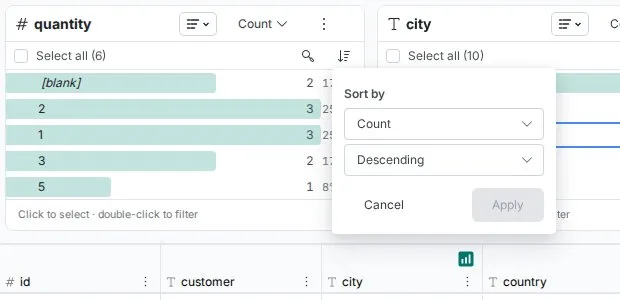
- Columns (default) shows the shape; List shows the same ranges as rows, for reading exact counts. In list view, Sort by sorts by the card's measure or by the values in numeric order.
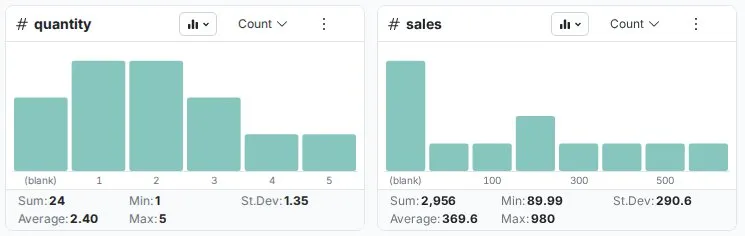
| Statistic | What it tells you |
|---|---|
| Sum | Total of all values, useful for revenue, quantities and weights |
| Average | Arithmetic mean, your typical value |
| Min | Smallest value |
| Max | Largest value |
| St.Dev | Standard deviation: high means a wide spread, low means consistent values |

How Mammoth picks the range size (granularity)
Mammoth picks the bar width for you, so you don't configure bins. The width is always a power of ten, one power below the order of magnitude of the column's range (max − min). A column where every value is the same gets 0.1-wide buckets, and ranges under about 1 get finer buckets still.
| Approximate data range | Auto bucket width | Example ranges | Typical use |
|---|---|---|---|
| ~1–3 | 0.1 | 0.0–0.1, 0.1–0.2 | Percentages, yield rates, ratios |
| ~3–32 | 1 | 0–1, 1–2, 2–3 | Small whole-number counts |
| ~32–316 | 10 | 0–10, 10–20, 20–30 | Ages, temperatures, small counts |
| ~316–3,162 | 100 | 0–100, 100–200 | Sales amounts, order quantities |
| ~3,162–31,623 | 1,000 | 0–1k, 1k–2k | Monthly revenue, transaction volumes |
| ~31,623–316,228 | 10,000 | 0–10k, 10k–20k | Annual revenue, enterprise metrics |
| ~316,228–3,162,277 | 100,000 | 0–100k, 100k–200k | Large aggregate totals |
Each tenfold increase in range gives a tenfold wider bucket. The transition points are approximate because Mammoth rounds to the nearest power of ten. When a filter narrows the range, the width is recalculated for the remaining rows.
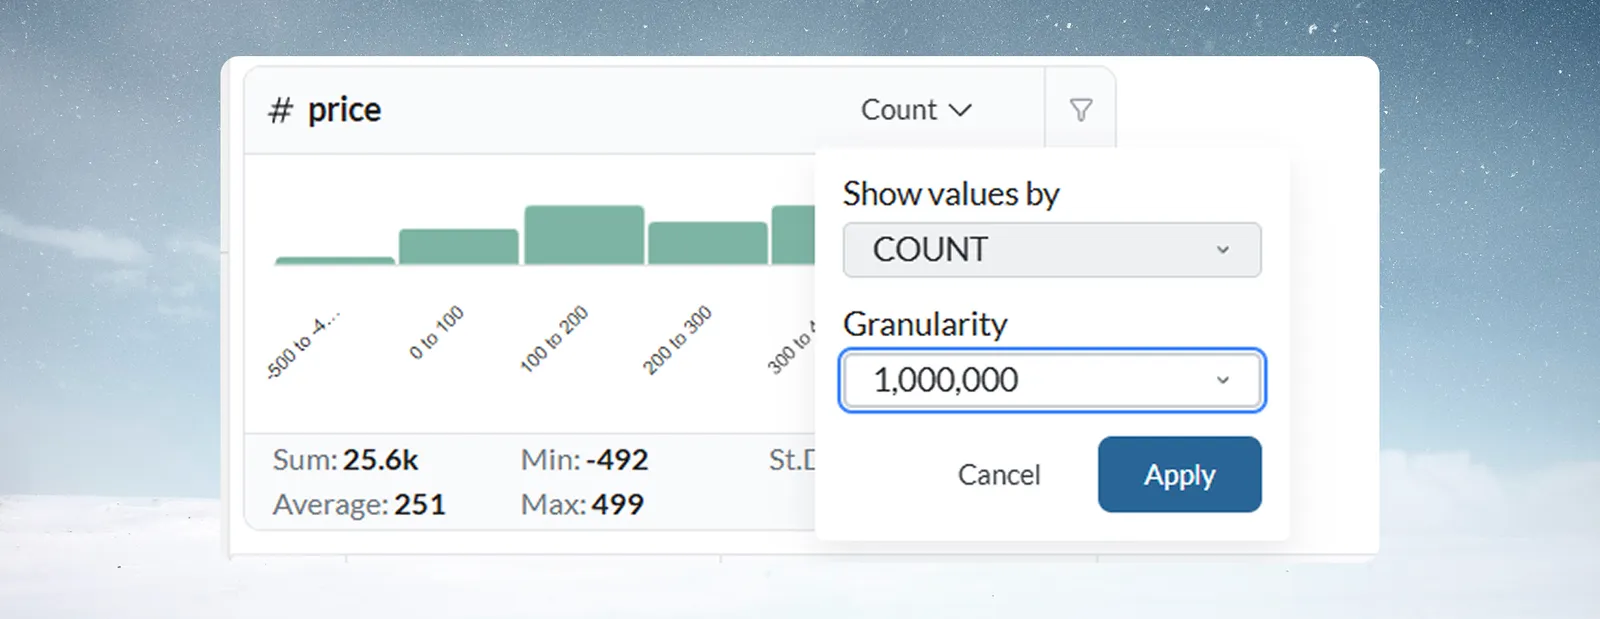
To override it, open the aggregation menu, change Granularity to a finer or coarser power of ten (for example from 10 to 100), and click Apply.
Distribution shapes to recognize
| Shape | What you see | What it suggests |
|---|---|---|
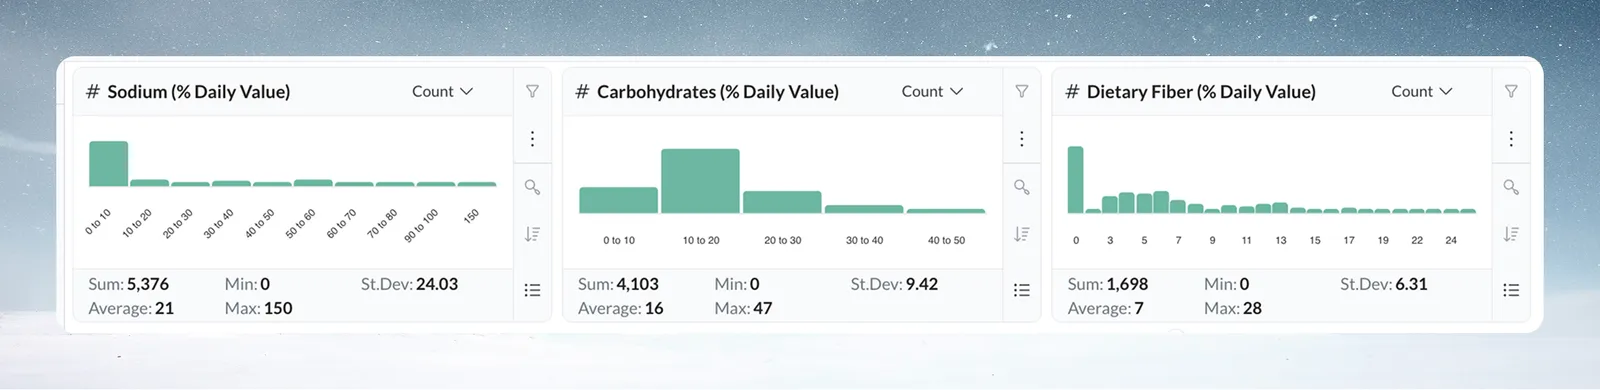
| Normal | Tallest bars in the middle, tapering to the edges. Common in salaries, product weights and measurements | An abrupt drop at an edge may mean missing data |
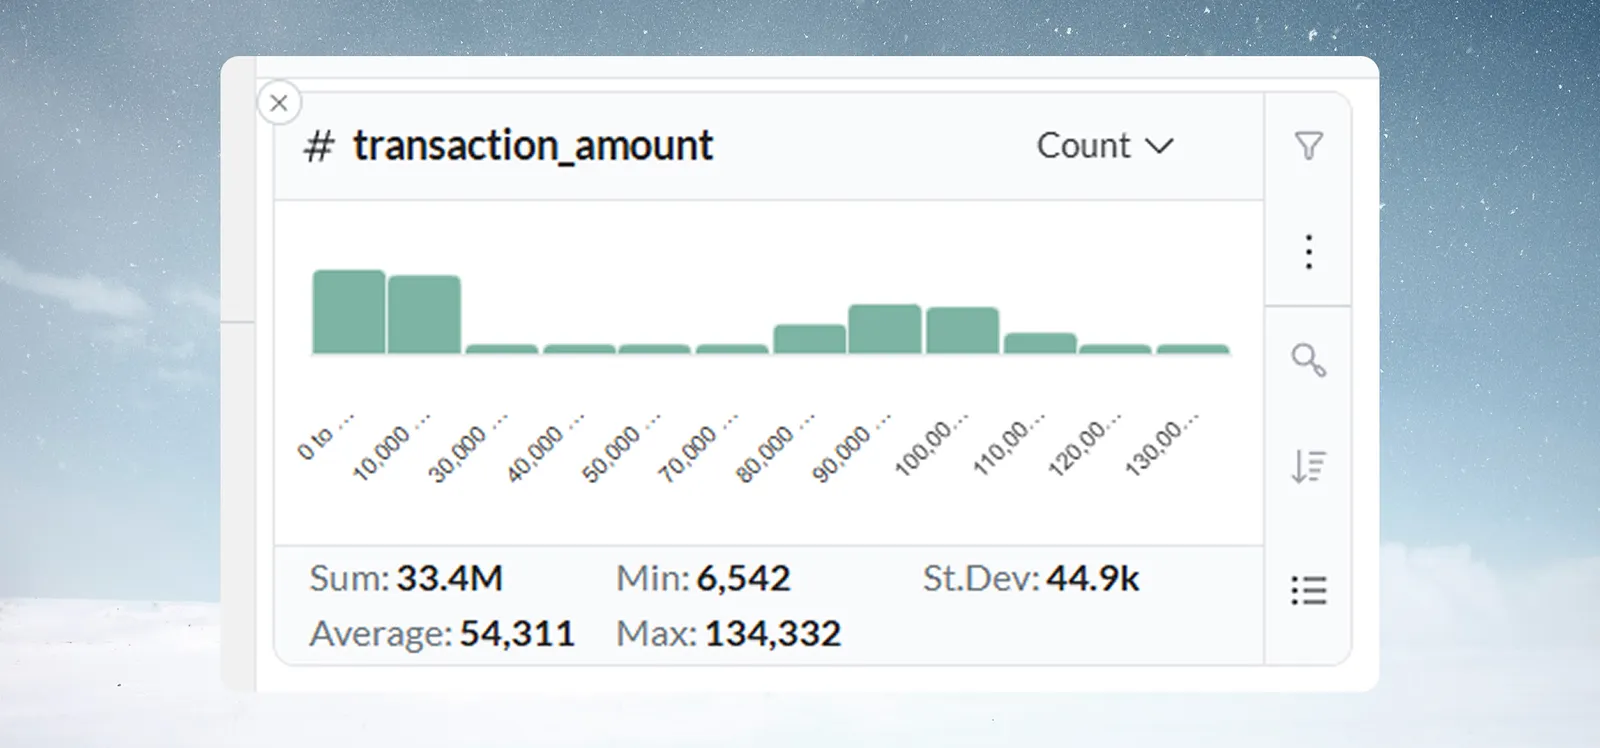
| Skewed | Values pile up at one end with a long tail. Common in transaction amounts and response times | The tail is worth a look |
| Bimodal | Two clusters with a gap, such as SMB and Enterprise deal sizes, or day and night shift temperatures | Usually two segments to analyze separately |
Find outliers and placeholder values in a number column
The card shows every value, including negatives, and doesn't flag any as invalid: whether a value is out of range is your business judgment. Look for:
- An isolated bar far from the rest, such as one bar at $10,000 when prices sit between $10 and $100.
- Values outside the expected range, such as negative prices or quantities, ages above 120, or percentages above 100.
- A spike at one value such as 0, 999 or -1, which often means a system default used in place of real data.
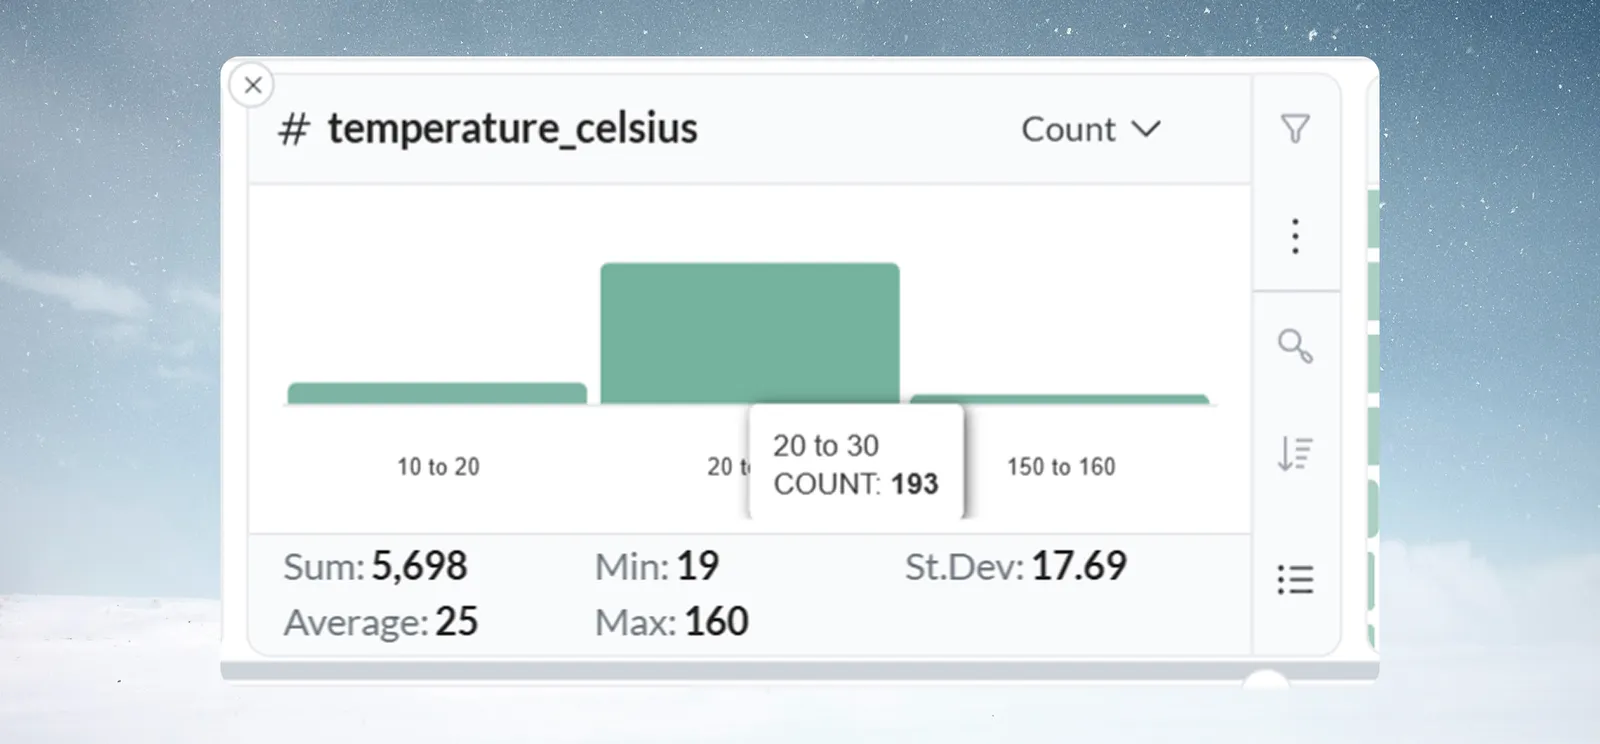
Hover the bar to confirm the count, then click it and use Filter to see those rows before you decide to remove them.
Worked example: temperature readings cluster around 22°C, with one bar at 150–160°C. Hovering shows COUNT: 3. Filtering shows all three come from one batch, from a faulty sensor. A Conditional Filter task now flags readings above 50°C.
Troubleshooting number cards
| Symptom | Cause | Fix |
|---|---|---|
| Number statistics don't change after filtering | The value was selected but not filtered | Click Filter or double-click; check the filter badge |
| Too many bars | The range is wide for the granularity | Raise Granularity (for example from 10 to 100). A very high bar count can itself signal a quality problem |
| Chart jumps to a coarser granularity | Automatic granularity follows the rows currently counted, so a filter can change it | Set the granularity you want and click Apply |
| Number statistics look wrong | Numbers stored as text, or hidden characters or currency symbols | Check the column type and the raw values in the grid. See Column types |
Related
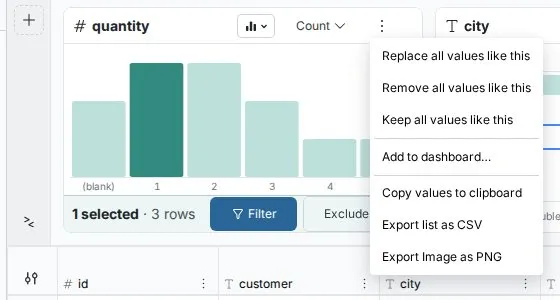
- Text, number and date cards: Show values by, sorting and the More options menu.
- Label rows and insert values: the task Replace all values like this opens on a number card.
- Filter rows: remove or flag outlier rows for good.
Something wrong? support@mammoth.io