Get AI insights about your data with View Insights
View Insights writes 3–7 short, plain-language observations about a View, such as revenue concentration, trends or gaps. Click View Insights on the right of the data editor's action bar; afterwards the button shows the count, for example 6 Key Insights. It is unavailable in preview or edit mode, while the pipeline runs, and in View-only workspaces.
How View Insights works
When you click the button, Mammoth collects column statistics for the View (distributions, date ranges, concentrations and gaps) and asks an AI model to turn them into business observations. It reads the whole View after its pipeline. Filters you apply in Explore Cards don't change it.
The AI gives priority to:
- Revenue risks: concentration, declining trends and weak segments.
- Growth opportunities: high-value segments and untapped patterns.
- Decision blockers: missing data that prevents segmenting, forecasting or targeting.
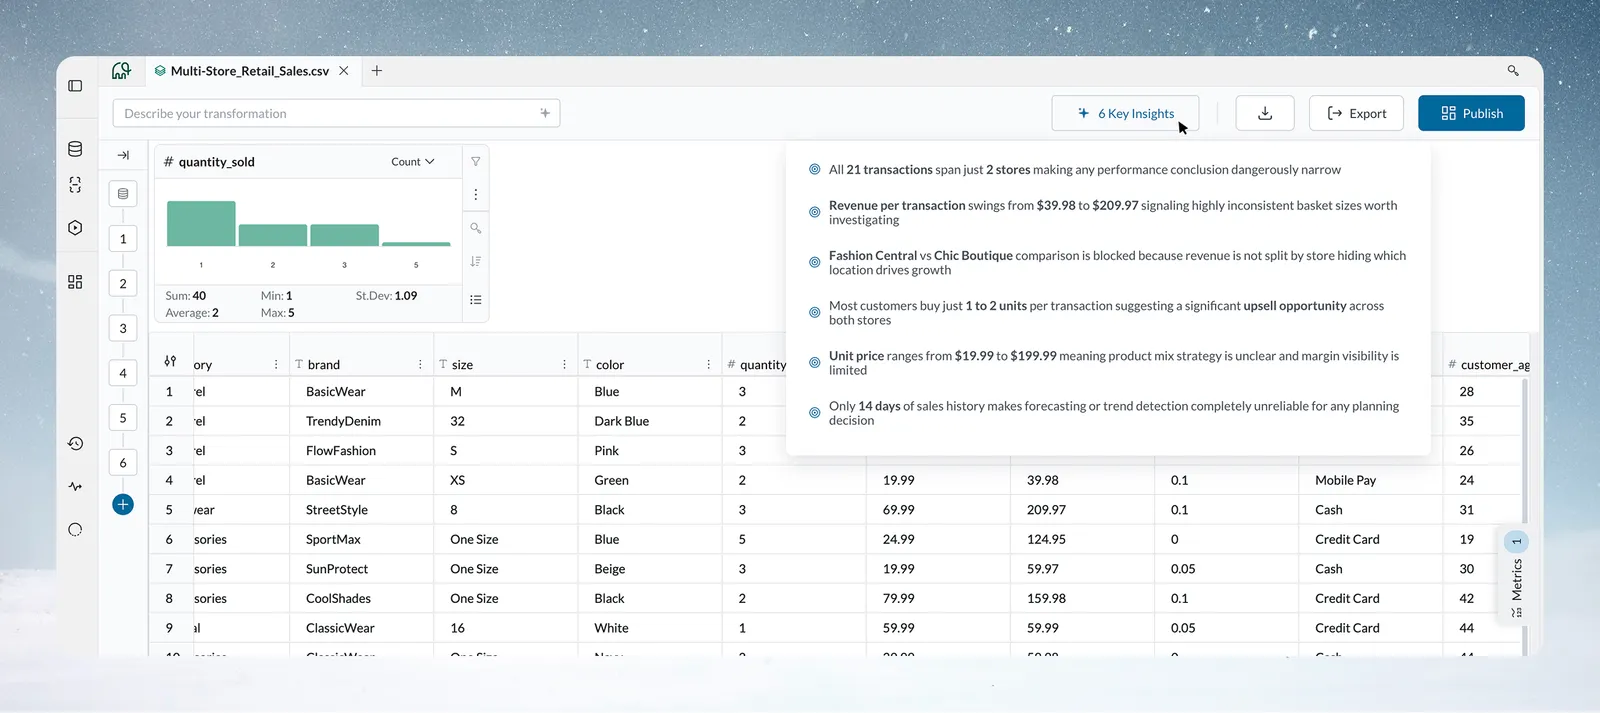
What a set of insights looks like
You get 3–7 insights, more when several patterns or risks are present. Each is one sentence, with key numbers and terms in bold. For example:
- Revenue concentration: "67% of revenue is concentrated in Q3-Q4 period, with significant seasonal variation pattern detected"
- Regional differences: "East region accounts for 45% of sales volume but only 32% of revenue, suggesting lower average order values"
- Time patterns: "Order processing time increased 23% in recent data compared to historical average"
- Data gaps: "Customer contact details are missing for 15% of records, blocking personalized outreach"
- Risk signals: "Shipments span from near-zero to 20.99K kg suggesting extreme order size variance that may indicate a fulfillment concentration risk"
Insights explain what the data means, not only what it contains. They are not instructions to change your data: that judgment stays with you.
Before you start
- The View must contain data. Any column types work, on raw uploads or transformed data.
- The pipeline must not be running.
- You must not be in preview or edit mode, and the workspace must not be View-only.
To focus on a subset, such as Q4 only, add a Conditional Filter task to the pipeline first. See Filter rows.
Generate View Insights for a View
- Open the View.
- Find View Insights on the right side of the action bar, before the download button and Export.
- Click it. Insights don't generate on their own when you open a View.
- Wait while the button shows "Analyzing Insights" and "This will only take a moment."
- Click the button again (now, for example, 6 Key Insights) to open the list below it. A long list scrolls.

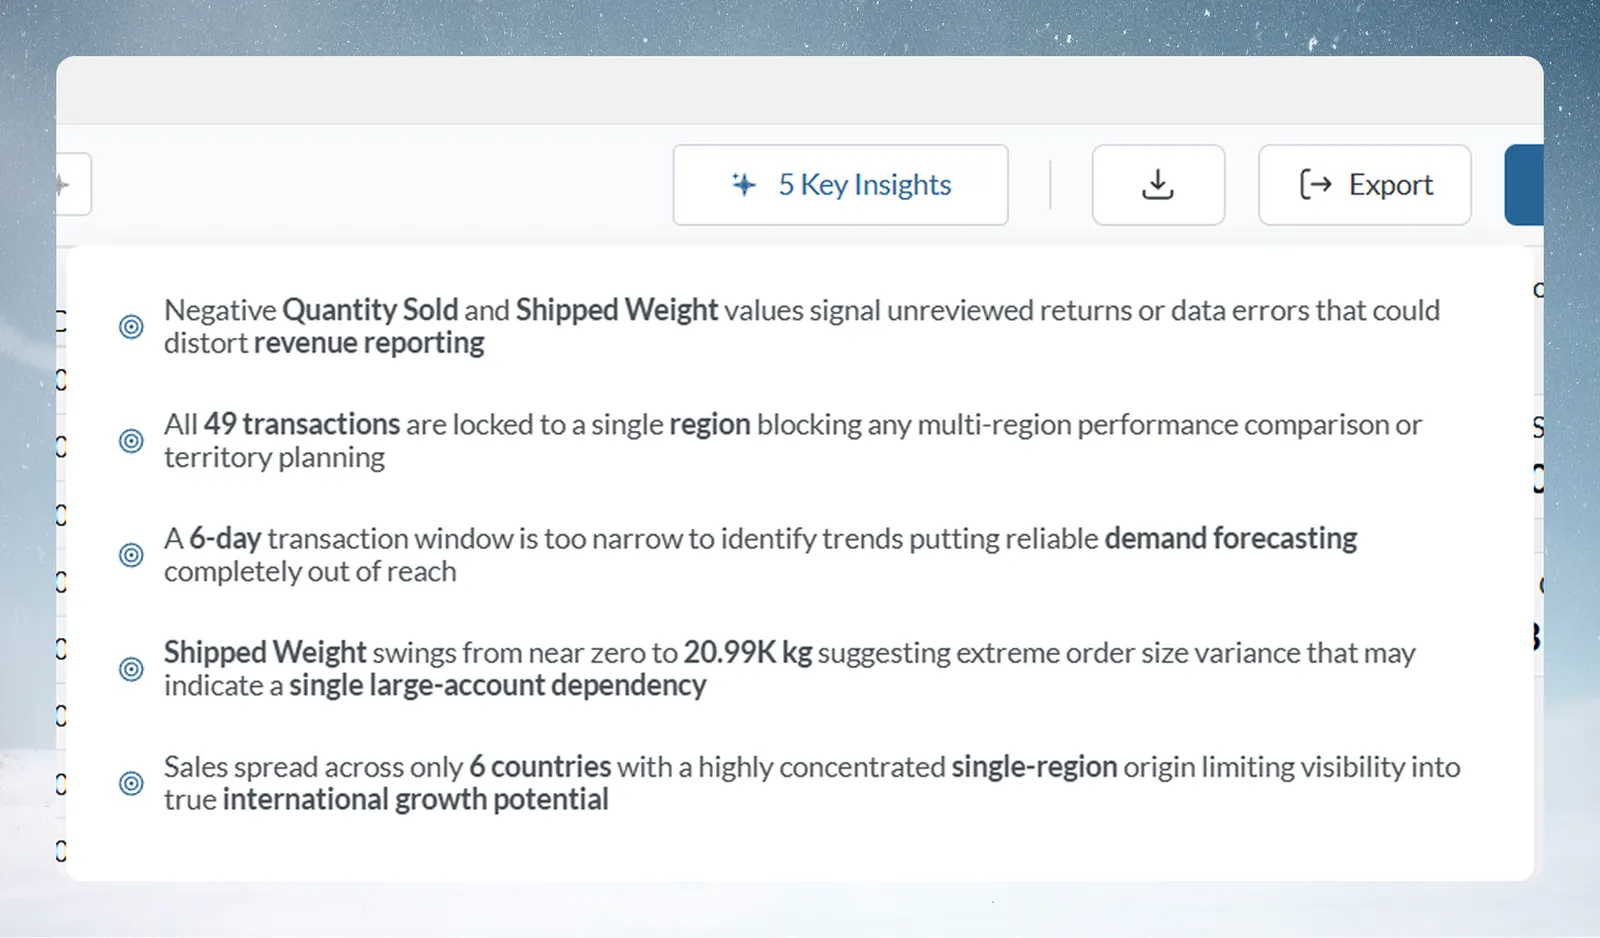
If generation fails, Mammoth shows an error message and the button returns to View Insights.
When View Insights clears and how to regenerate
Insights are saved with the View, so reopening it doesn't run them again. When the View's data changes, the saved insights are cleared and the button returns to View Insights. That happens:
- after pipeline changes (insights don't update when you add or run tasks);
- when the dataset receives new batches;
- when columns are added or data types change.
To regenerate, click View Insights again. The new set replaces the old one; only the latest set is kept. Copy the text or take a screenshot first if you want to compare.
Generate insights before and after big pipeline changes. The first set helps you choose which tasks to build; the second shows whether they changed the patterns as intended.
Use View Insights in your work
- Briefings: copy insights into slides or notes. They use business language with specific values.
- Pipeline planning: if the AI flags inconsistent formatting or negative values, investigate those before you build tasks.
- Dashboards: turn significant patterns into KPIs and charts.
- Further digging: follow up a pattern with Explore Cards filters, or quantify it with Metrics.
Review insights with your business knowledge. The AI detects statistical patterns but lacks your context, so some may not apply to you.
Worked example: check a vendor file before building a pipeline
You upload vendor inventory data and generate insights before any task. The AI reports that one SKU holds 12,500 units while most sit at 125; that expiry dates fall in only 2 windows; and that last stock updates span 1,036 days with only 13 distinct dates. You raise these with the vendor before building anything.
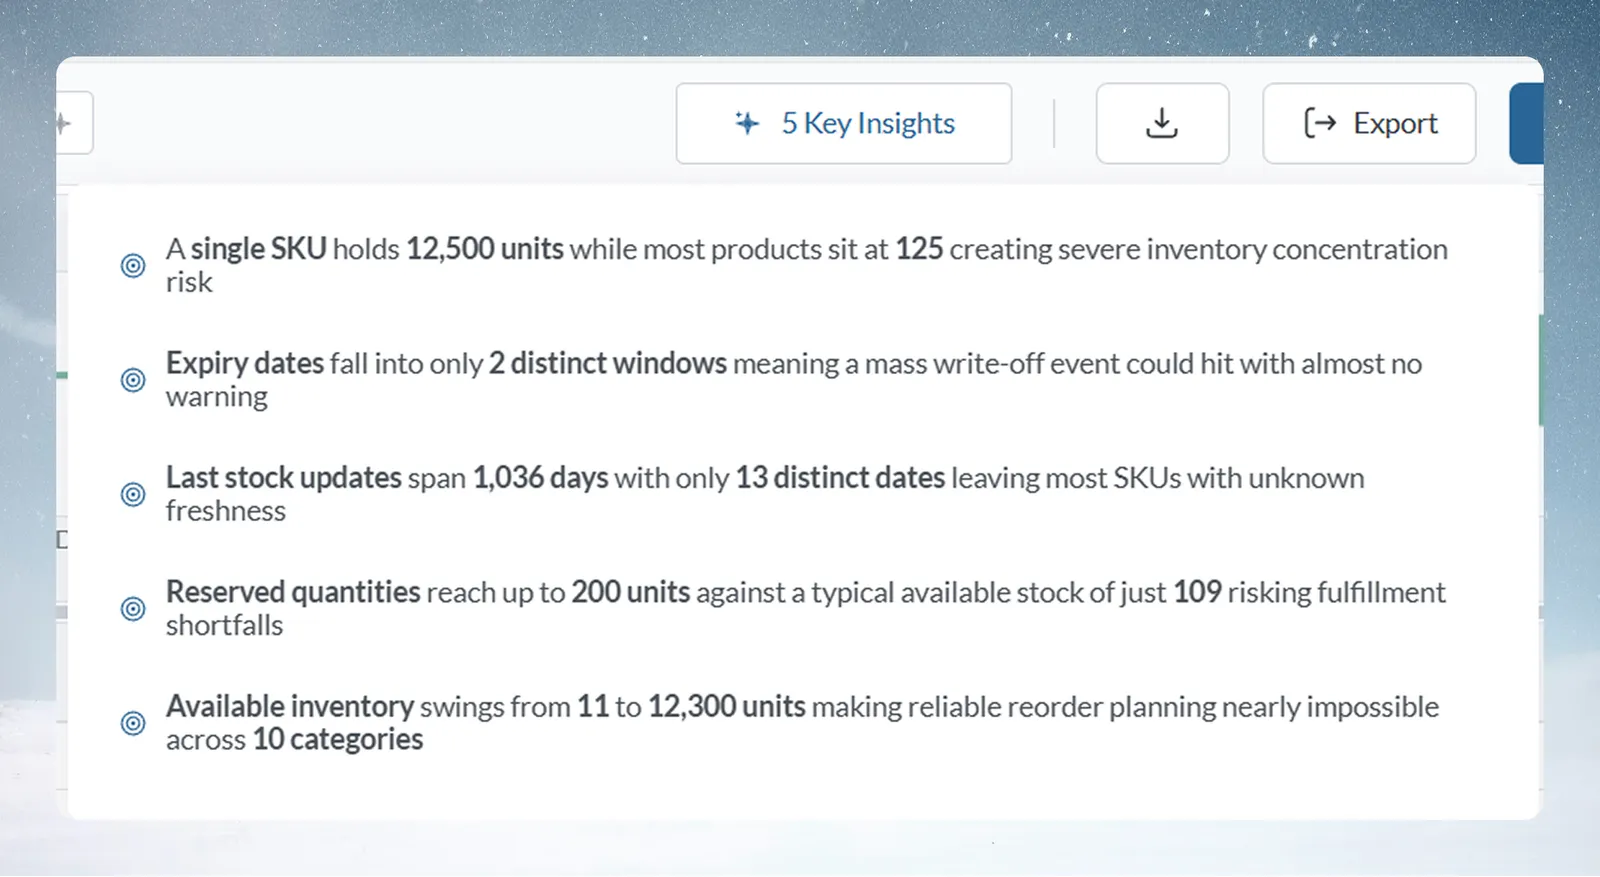
Other uses: preparing a briefing from 280,000 engagement records; a first look at a 150,000-row, 23-column sales file; a check after an 8-task pipeline (the Data quality report scored 82% "Good", but insights spotted 23% of amounts at exact $1,000 steps, a truncation bug in the source); and budget planning on 2.3M rows of sales history.
View Insights compared with Metrics and the Data Quality Report
| View Insights | Metrics panel | Data Quality Report | |
|---|---|---|---|
| What it gives | 3–7 business observations | Numbers you define (Count, Sum, Average, formulas) | Quality score, issues and recommended pipeline tasks |
| Who decides | The AI | You | DAMA quality rules, with AI help |
| How you start it | Click the button | Open from the action bar | Click the button |
| Question it answers | "What's interesting here?" | "What do I want to measure?" | "What needs fixing?" |
Run the Data Quality Report first so the patterns rest on sound data, then use View Insights.
View Insights limits
- 3–7 insights per run. The AI sets the count; you can't.
- You can't choose which insights appear or ask follow-up questions.
- No export button: copy the text manually.
- The current View only. To compare Views, combine the data in one View first, or generate insights for each and compare by hand.
- Only the latest set is kept.
Troubleshooting View Insights
| Symptom | Cause | Fix |
|---|---|---|
| The count changes between runs | The count reflects what the AI found that time | Nothing to fix. You can't set it |
| Generation seems stuck | Connection problem, or the View is empty | Check your connection, refresh the browser and try again; make sure the View has data |
| Fewer insights than expected, or "No data to show" | Very uniform data, columns of only IDs or constants, or data still loading | Check the columns hold meaningful data, wait for the load, and try again |
| Insights seem obvious or irrelevant | The AI lacks your business context | Add a Conditional Filter task to focus on a subset; use the insights as starting points |
| Insights still reflect old data | The pipeline is still running, or the button hasn't been clicked since the change | Wait for the tasks to finish, then click View Insights |
| Insights disappeared | The View's data changed, which clears them | Click View Insights to generate a new set |
| The button is unavailable | Preview or edit mode, a running pipeline, or a View-only workspace | Exit the mode or wait for the pipeline |
Related
- Which explore tool to use: how View Insights fits with the other tools.
- Data quality report: check quality before you trust the patterns.
- Explore Cards: dig into a pattern the AI found.
- Metrics: put exact numbers behind an insight.
- How the pipeline works: why pipeline changes clear insights.
Something wrong? support@mammoth.io