Text, number and date Explore Cards explained
Each Explore Card matches its column's type: a text card lists distinct values, a number card shows a histogram with five statistics, and a date card charts time periods with the earliest and latest dates. Add a card with Add card in the Explore panel (the Explore toggle in the action bar), then use the card header to change what it measures and how it looks. The transformation shortcuts on each card need edit access to the View.
Controls every card shares
| Control | Where | What it does |
|---|---|---|
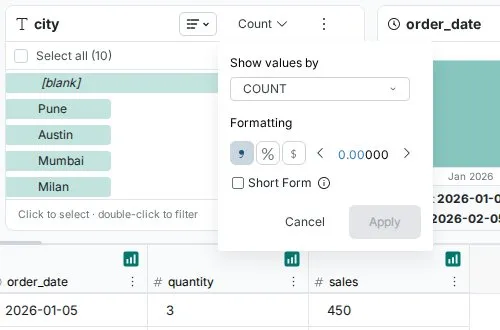
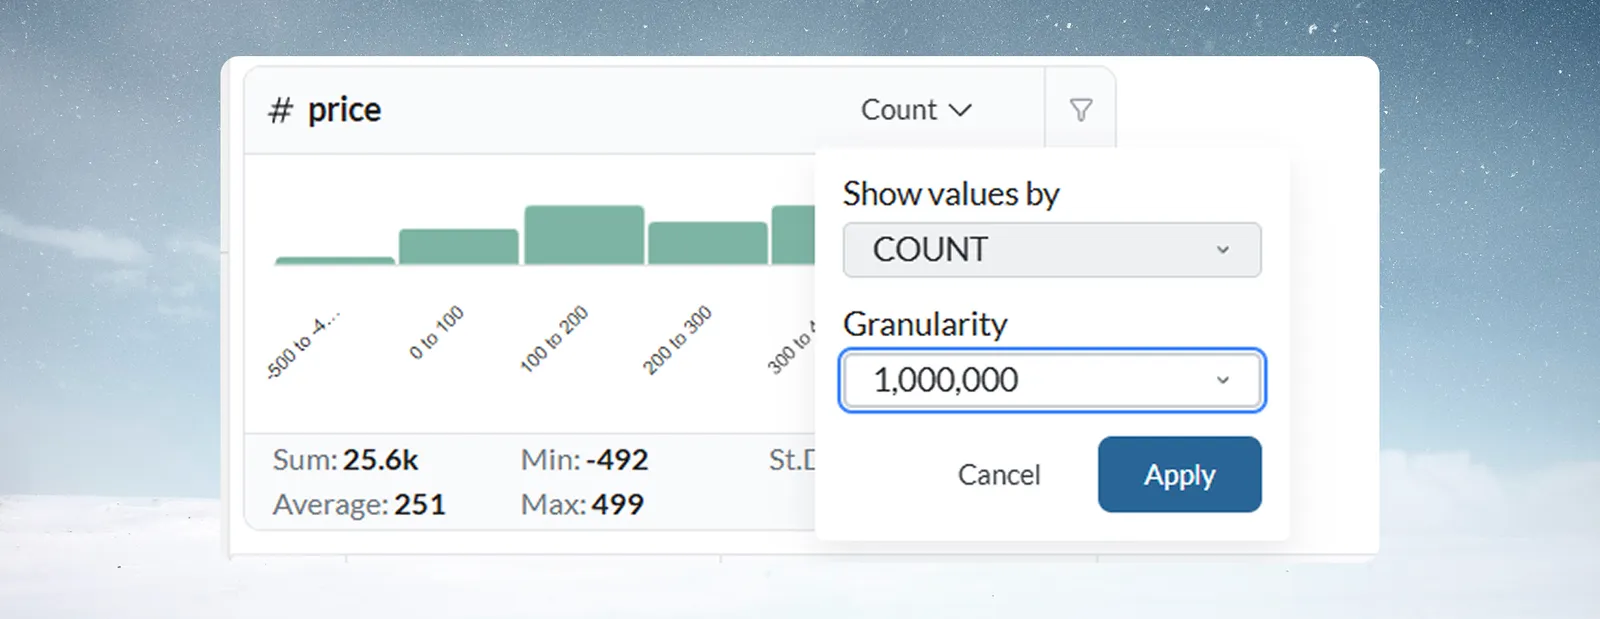
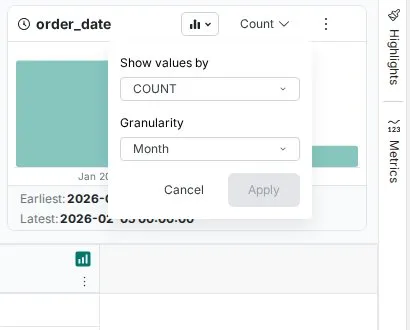
| Aggregation menu (Show values by) | Card header; reads Count by default | Changes what the card measures for each value, range or period. Number and date cards also set Granularity here |
| Chart type dropdown | Card header | Switches the view: List, Donut, Treemap (text); Columns, List (number); Columns, Timeline, List (date) |
| Search values | Above the list (list view only on number and date cards) | Finds a value, range or period in a long list |
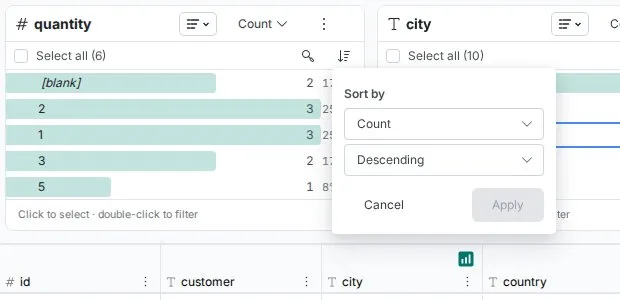
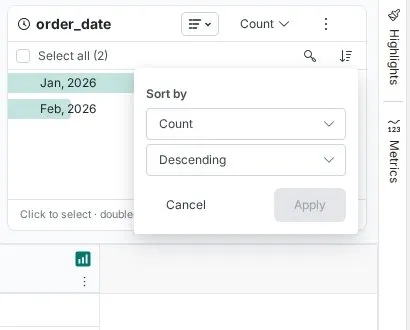
| Sort by | Above the list (list view only on number and date cards) | Sorts by the card's measure or by the column's values; choose Ascending or Descending, then Apply |
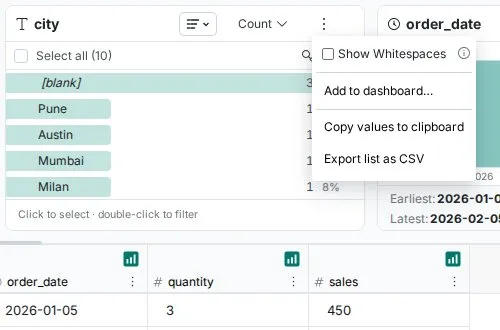
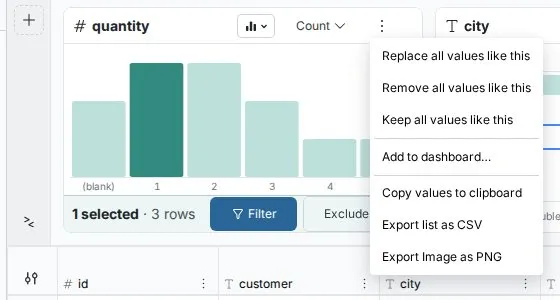
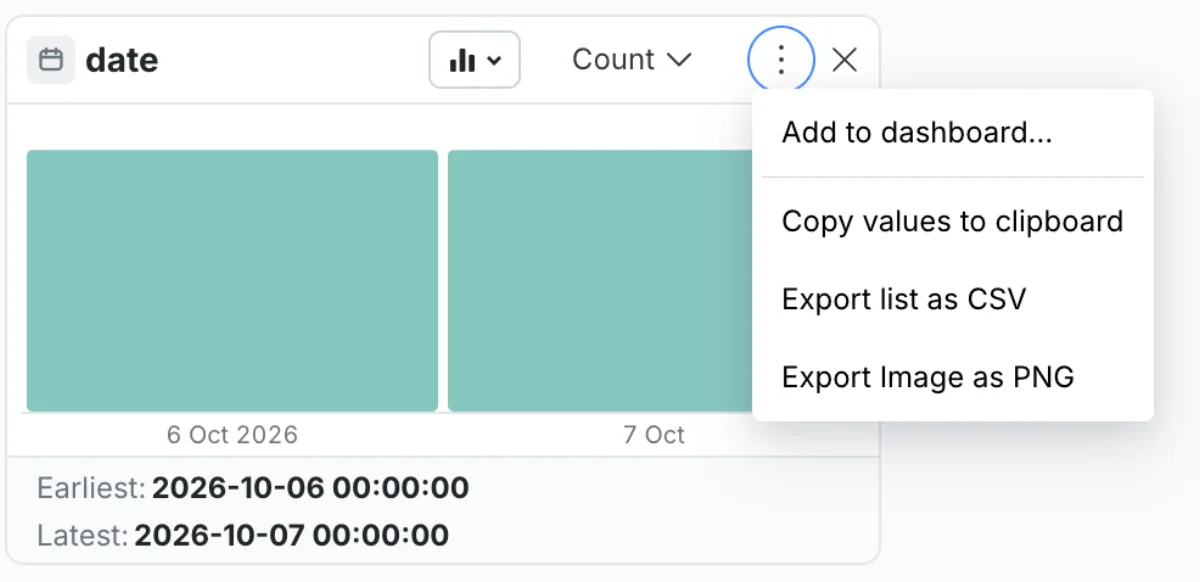
| More options (⋮) | Card header | Shortcuts, Add to dashboard…, copy and export |
Show values by: count, sum, average and more
By default a card counts rows. You can switch to an aggregation of a numeric column in the View instead.
| Function | What it shows for each value, range or period |
|---|---|
| COUNT | Number of rows (default) |
| DISTINCT_COUNT | Number of distinct values of the selected column |
| SUM | Total of the selected numeric column |
| AVG | Average of the selected numeric column |
| MIN | Smallest value of the selected numeric column |
| MAX | Largest value of the selected numeric column |
| STDDEV | Standard deviation of the selected numeric column |
SUM, AVG, MIN, MAX and STDDEV need a numeric column in your View. Set both Show values by and granularity, then click Apply, or Cancel to discard.
Example: on a supplier_name card, switch from Count to Sum of invoice_amount. The card now shows total spend per supplier instead of how many records each has.
More options menu
| Item | When it shows | What it does |
|---|---|---|
| Replace all values like this | Values selected and you can edit | Text: opens Bulk Replace. Number and date: opens Label & Insert Values with the selection as the condition |
| Remove all values like this | Values selected and you can edit | Opens Conditional Filter set to remove the selection |
| Keep all values like this | Values selected and you can edit | Opens Conditional Filter set to keep only the selection |
| Add to dashboard… | Always; greyed out if you can't edit dashboards in the project | Adds the card as a dashboard tile. See Explore Cards |
| Copy values to clipboard | Always | Copies the values (or ranges, or periods) with their counts |
| Export list as CSV | Always | Downloads the values and counts as a CSV file |
| Export Image as PNG | Chart views only: Donut and Treemap (text), Columns (number), Columns and Timeline (date) | Downloads the chart as an image |
| Show Whitespaces | Text cards, list view; at the top of the menu | Shows space characters in values |
Click to select a value; double-click to filter. Details are on Explore Cards.
Read a text column card
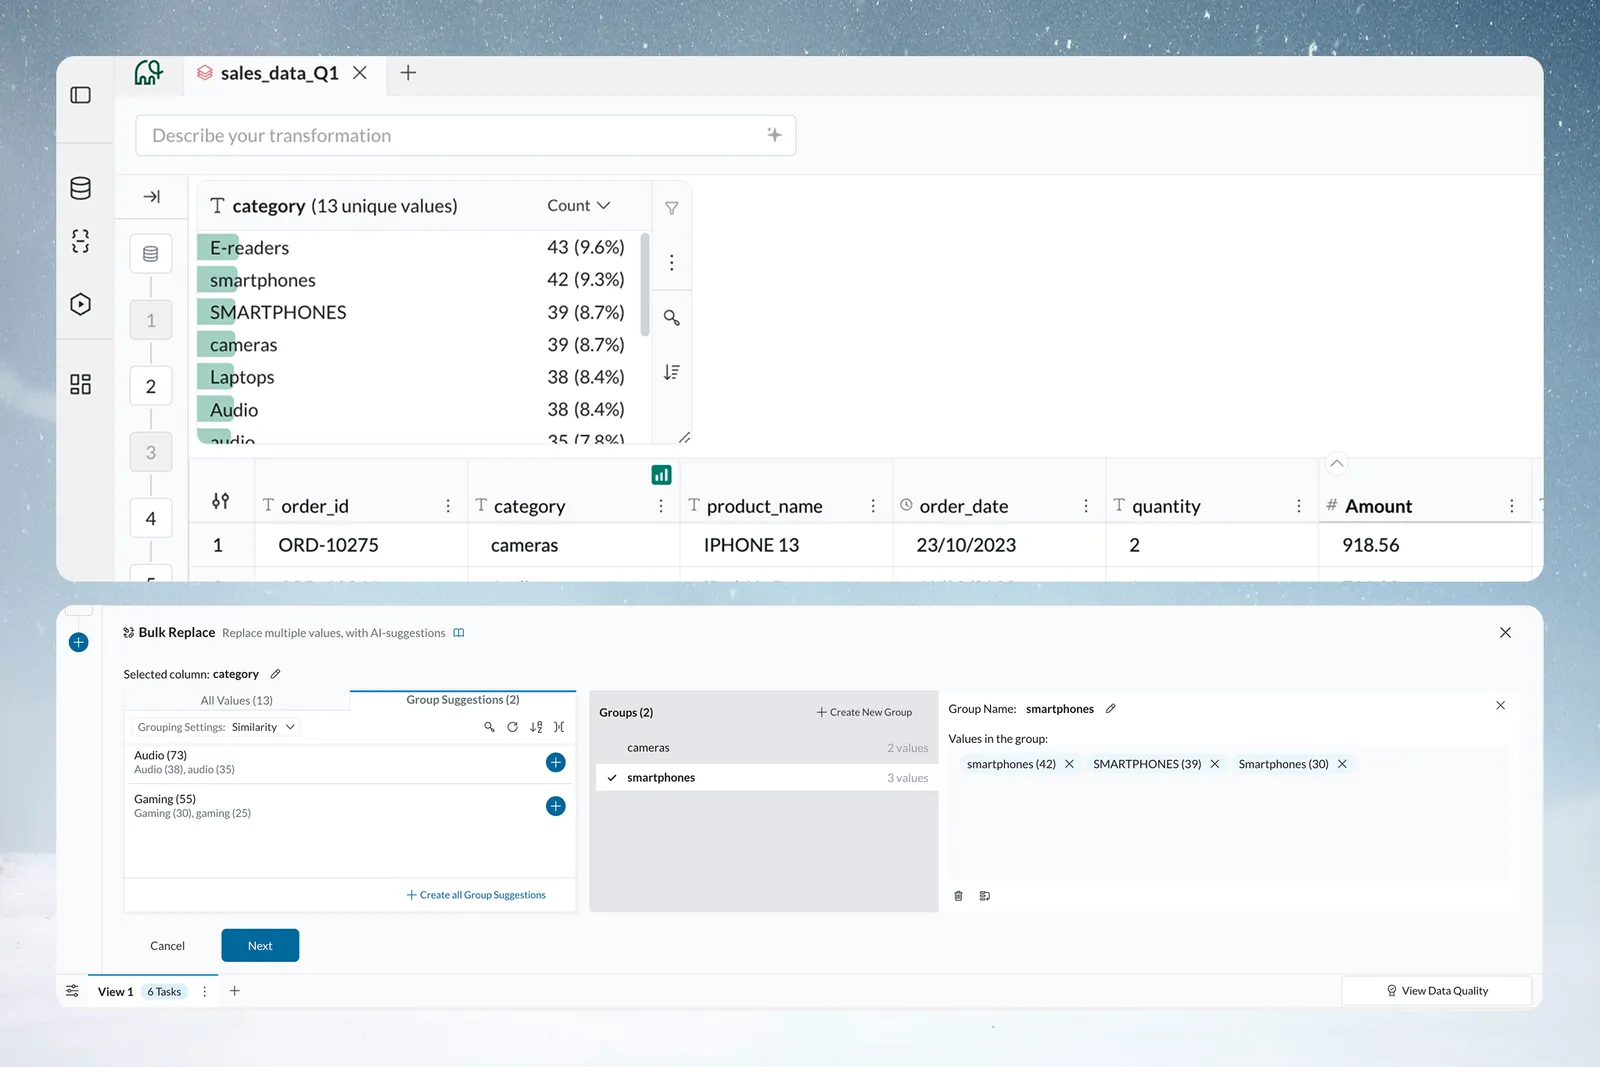
A text card lists the distinct values in a column, most frequent first, with a bar behind each value. Spelling variants, case variants, extra spaces and blanks each appear as their own row, so you see them at once.
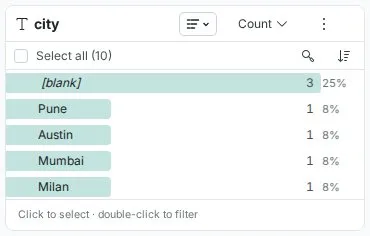
What the card shows:
- Header: the column name and the number of unique values, for example
product_name 9 unique values. - Rows: one per value, most to least frequent by default.
- Bar: sized relative to the largest share in the list.
- Count and percentage: for example
20and20%. The percentage is rounded to a whole number and shows<1%for very small shares. It appears only while the card shows Count. - Blanks: a
(blank)row with its own count and share. - Above the list: Select all, Invert, Search values and Sort by.
Switch a text card to a donut or treemap
Use the chart type dropdown: List (default), Donut or Treemap. Donut and Treemap show each value's share of the total, so they are available only when Show values by is Count or Sum.
Find extra spaces with Show Whitespaces
In list view, tick Show Whitespaces at the top of the More options menu. Space characters become visible, with extra spaces emphasized. Values that look the same, such as "Company" and " Company", are then clearly different. Use it whenever you suspect spaces are making values look like duplicates.
Select values on a text card
Click a value to select it: a checkbox marks it, and a bar shows the number selected with Filter and Exclude. A plain click toggles a value. Hold Shift to select a run from the last value you clicked. Select all selects every value, and Invert flips the selection. Double-click a value to filter to it right away. Click Clear selection, or press Esc, to deselect.
Drag a card's edge to widen it when value names are cut off. Hover a truncated value to see it in full.
Text quality problems a card reveals
| Problem | What you see | Fix |
|---|---|---|
| Spelling variants | "Service", "Services", "service" as separate rows | Bulk Replace to one value |
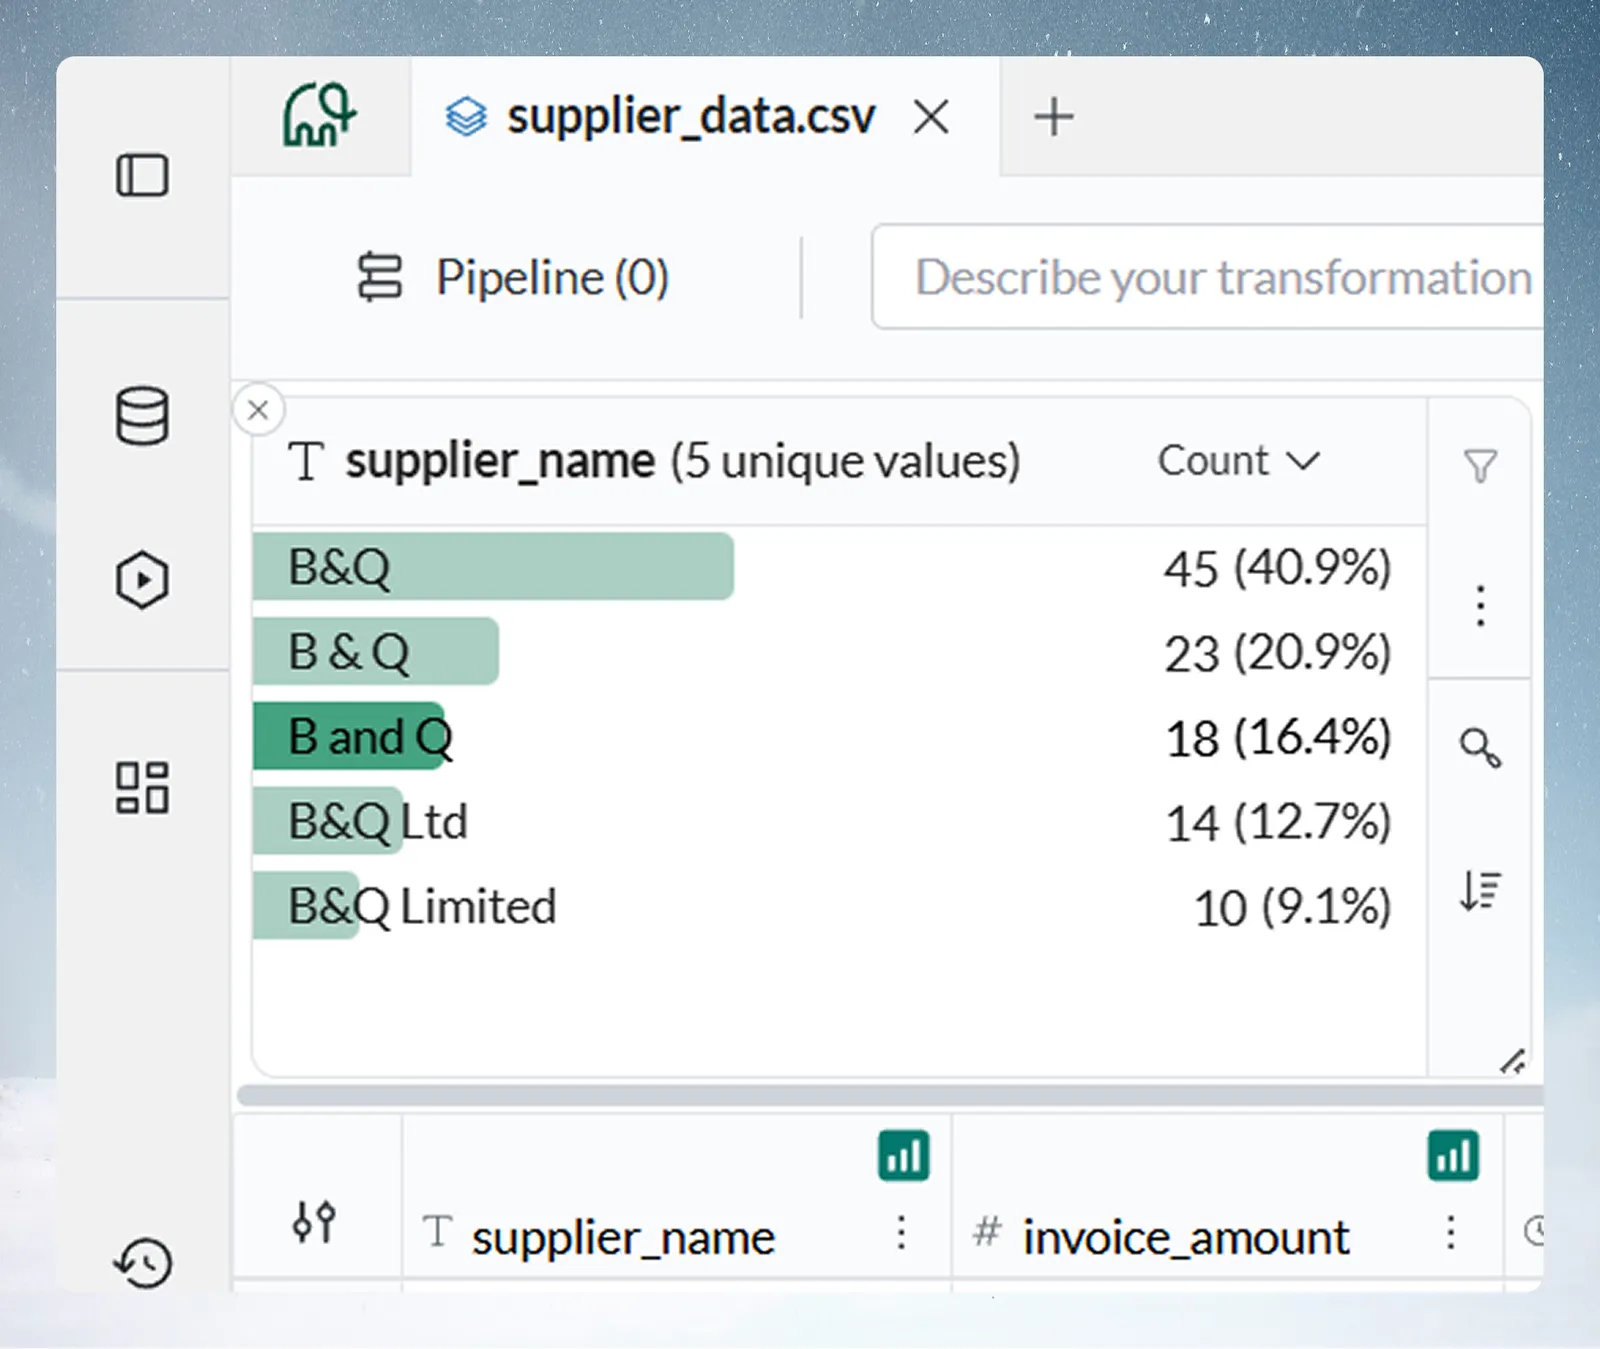
| Formatting variants | "B&Q", "B & Q", "B and Q" | Bulk Replace |
| Case variants | "Travel", "travel", "TRAVEL", each with its own count and percentage | Bulk Replace to one value |
| Extra spaces | " Company" apart from "Company" | Turn on Show Whitespaces to see the spaces |
| Missing data | A (blank) row with its count and share | Read the share to judge completeness |
The percentages show how widespread each variant is, and which one is dominant and should become the standard.
Worked example: a supplier_name card shows "B&Q" 45 (41%), "B & Q" 23 (21%), "B and Q" 18 (16%), "B&Q Ltd" 14 (13%) and "B&Q Limited" 10 (9%). Select the variants, choose Replace all values like this, and map them all to "B&Q". A single Bulk Replace task standardized all 863 records, so supplier spend reports add up.
Other patterns look the same: "Electronic Widget A" 20%, "Electronic Widget-A" 15%, "Elect Widget A" 8%; or "Ad hoc" 52%, "ad-hoc" 26%, "adhoc" 13%, "Ad Hoc" 7%. Consolidate each with Bulk Replace.
Read a number column card
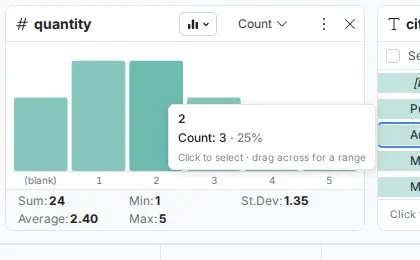
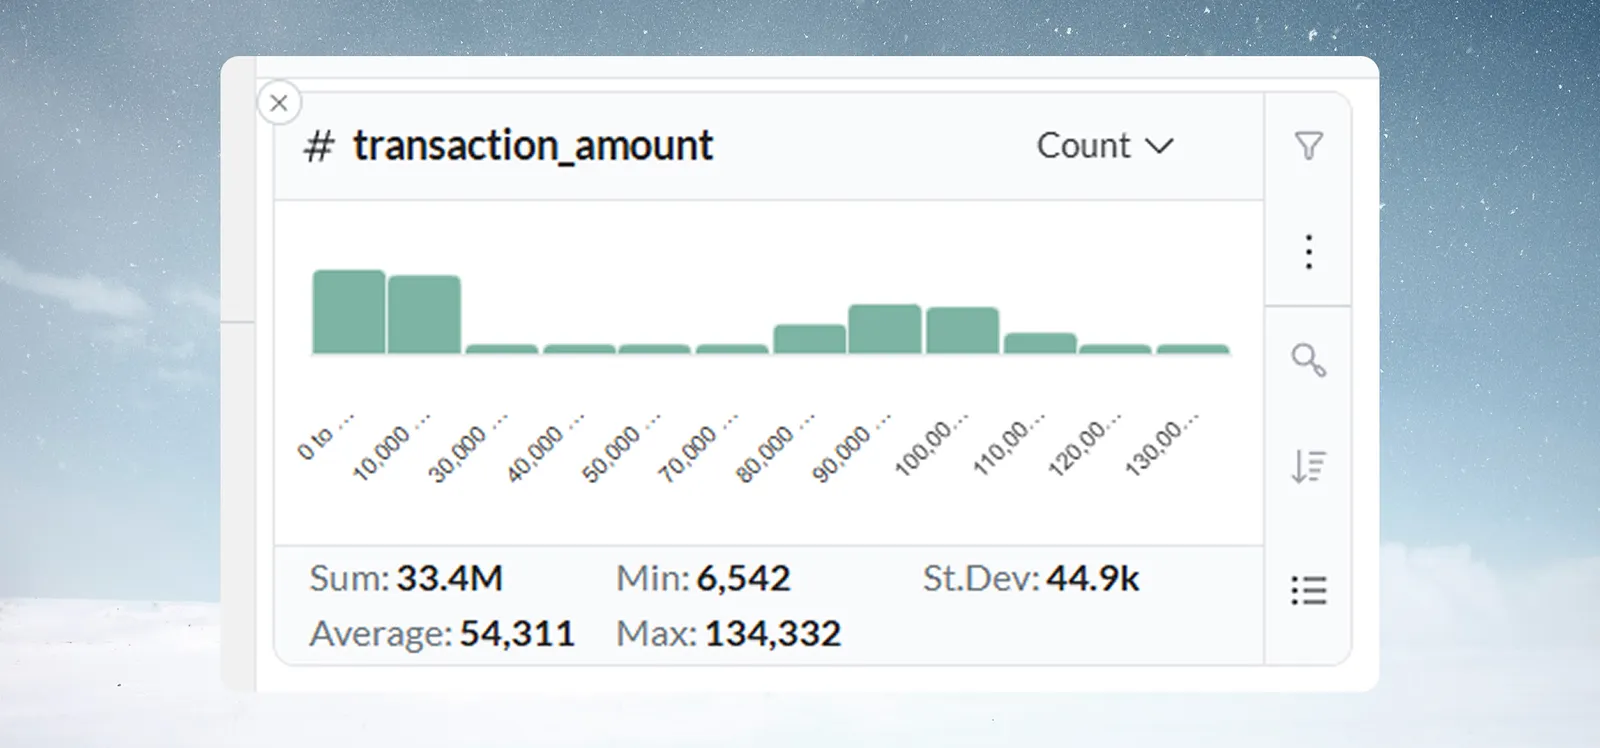
A number card shows a vertical bar chart. Each bar is a range of values, and its height shows how many rows fall in it.
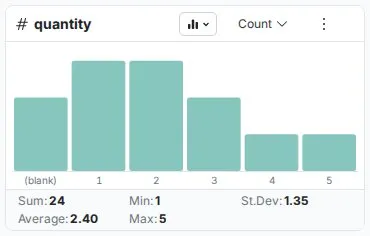
- Range labels sit below each bar, for example "100 to 200".
- Blank values appear as a
(blank)entry. - Hover a bar for its exact range, its count and its share of the rows, with the hint "Click to select · drag across for a range".
- Columns (default) shows the shape; List shows the same ranges as rows, for reading exact counts.
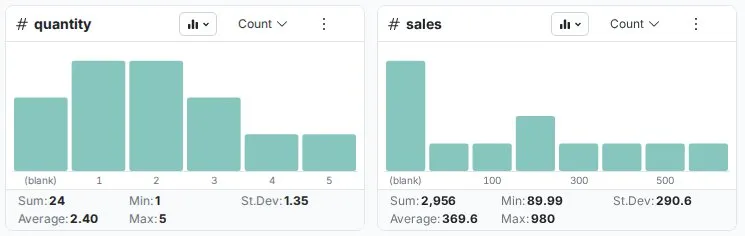
The five statistics on a number card
| Statistic | What it tells you |
|---|---|
| Sum | Total of all values, useful for revenue, quantities and weights |
| Average | Arithmetic mean, your typical value |
| Min | Smallest value |
| Max | Largest value |
| St.Dev | Standard deviation: high means a wide spread, low means consistent values |

How Mammoth picks the range size (granularity)
Mammoth picks the bar width for you, so you don't configure bins. The width is always a power of ten, one power below the order of magnitude of the column's range (max − min). It grows as the range widens. A column where every value is the same gets 0.1-wide buckets, and ranges under about 1 get finer buckets still.
| Approximate data range | Auto bucket width | Example ranges | Typical use |
|---|---|---|---|
| ~1–3 | 0.1 | 0.0–0.1, 0.1–0.2 | Percentages, yield rates, ratios |
| ~3–32 | 1 | 0–1, 1–2, 2–3 | Small whole-number counts |
| ~32–316 | 10 | 0–10, 10–20, 20–30 | Ages, temperatures, small counts |
| ~316–3,162 | 100 | 0–100, 100–200 | Sales amounts, order quantities |
| ~3,162–31,623 | 1,000 | 0–1k, 1k–2k | Monthly revenue, transaction volumes |
| ~31,623–316,228 | 10,000 | 0–10k, 10k–20k | Annual revenue, enterprise metrics |
| ~316,228–3,162,277 | 100,000 | 0–100k, 100k–200k | Large aggregate totals |
The pattern continues: each tenfold increase in range gives a tenfold wider bucket. The transition points are approximate because Mammoth rounds to the nearest power of ten. When a filter narrows the range, the width is recalculated for the remaining rows.
To override it, open the aggregation menu, change Granularity to a finer or coarser power of ten (for example from 10 to 100), and click Apply.
In list view, Sort by sorts by the card's measure or by the values in numeric order.
Distribution shapes to recognize
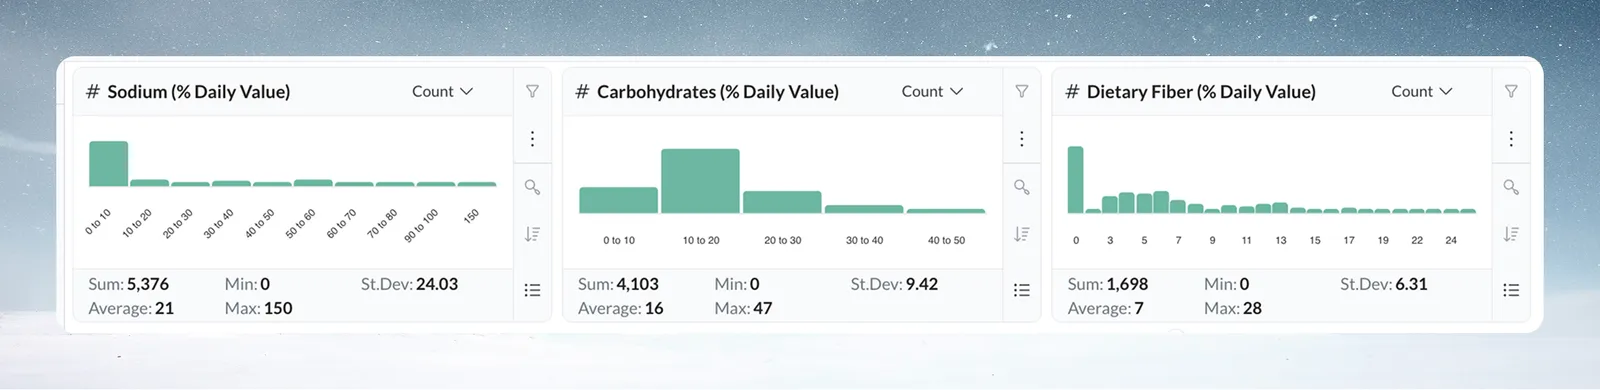
- Normal: tallest bars in the middle, tapering to the edges. Common in salaries, product weights and measurements. An abrupt drop at an edge may mean missing data.
- Skewed: values pile up at one end with a long tail. Common in transaction amounts and response times. The tail is worth a look.
- Bimodal: two clusters with a gap, such as SMB and Enterprise deal sizes, or day and night shift temperatures. It usually points to two segments to analyze separately.
Find outliers and placeholder values in a number column
The card shows every value, including negatives, and doesn't flag any as invalid. Whether a value is out of range is your business judgment. Look for:
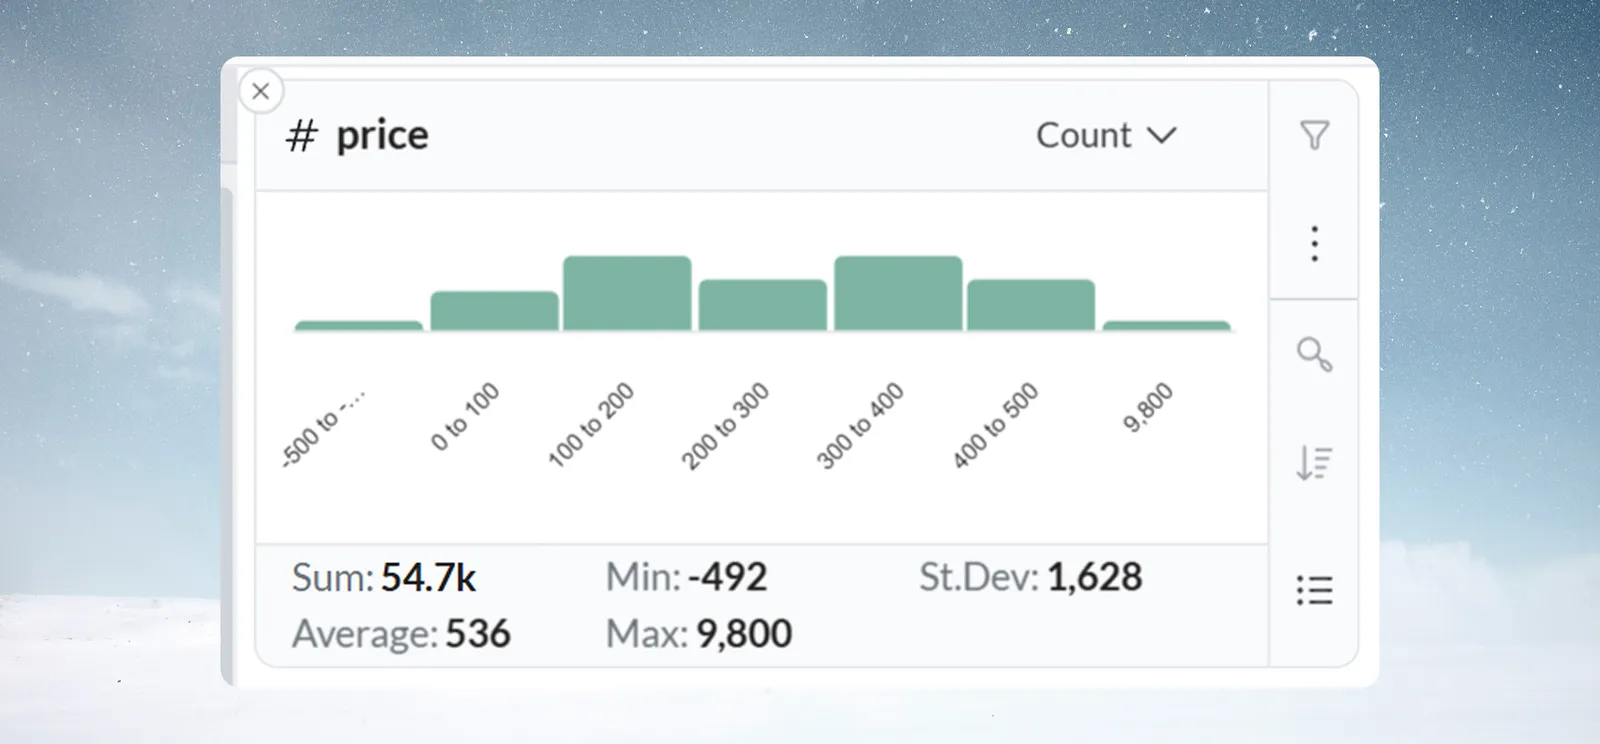
- An isolated bar far from the rest, such as one bar at $10,000 when prices sit between $10 and $100.
- Values outside the expected range, such as negative prices or quantities, ages above 120, or percentages above 100.
- A spike at one value such as 0, 999 or -1, which often means a system default used in place of real data.
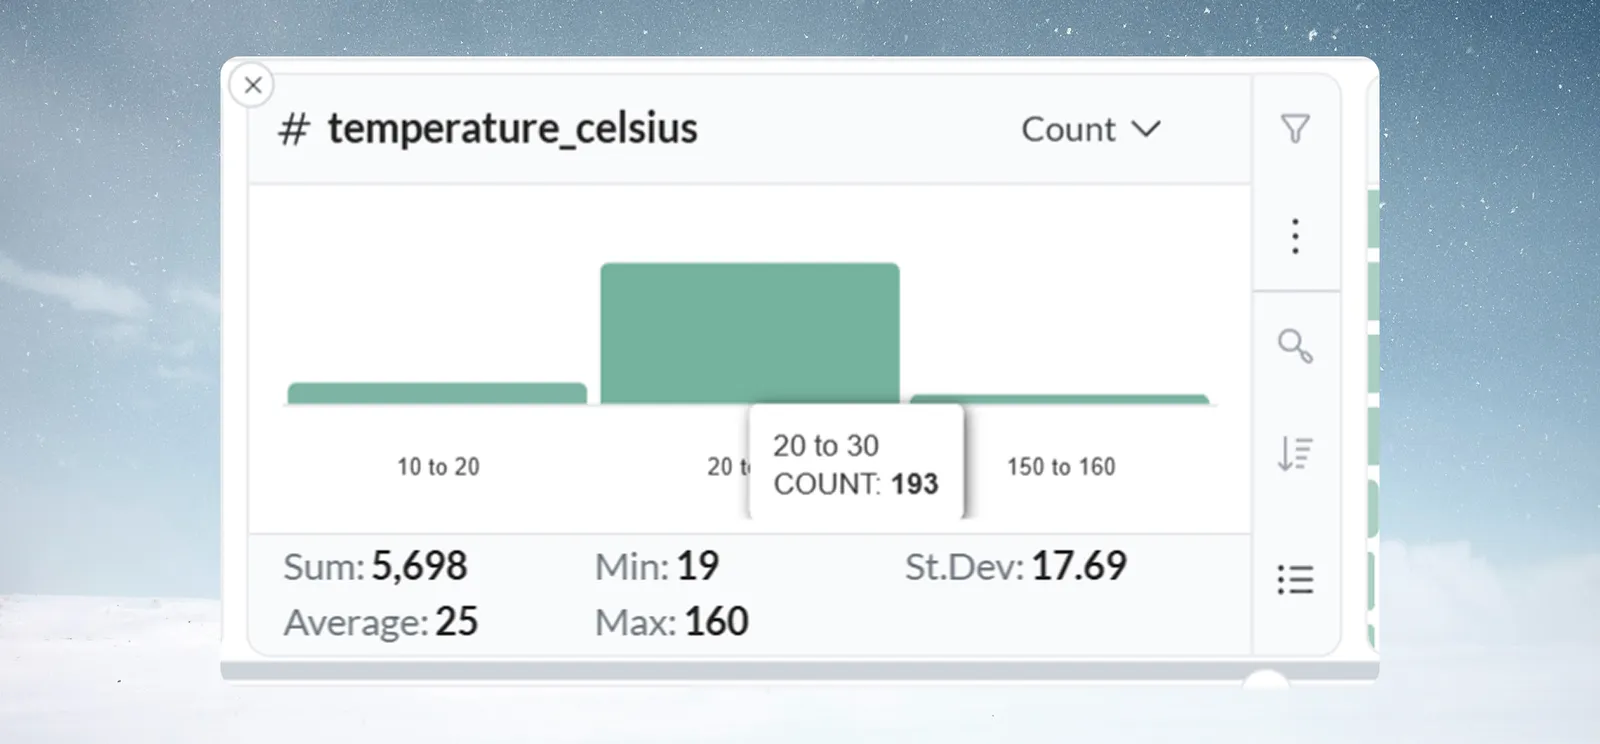
Hover the bar to confirm the count, then click it and use Filter to see those rows before you decide to remove them.
Worked example: temperature readings cluster around 22°C, with one bar at 150–160°C. Hovering shows COUNT: 3. Filtering shows all three come from one batch, from a faulty sensor. A Conditional Filter task now flags readings above 50°C.
Read a date column card
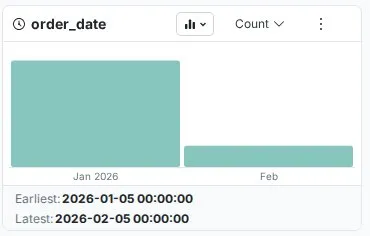
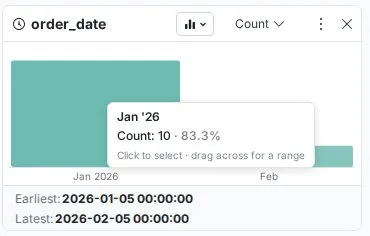
A date card shows a vertical bar chart, oldest period on the left. Each bar is a period, and its height shows how many rows fall in it. Hover a bar for the exact period and value.
| View | Best for |
|---|---|
| Columns (default) | Trends and seasonality |
| Timeline | The same periods drawn as a line over time |
| List | Reading exact counts per period |
Below the chart, Earliest and Latest show the oldest and newest values with full date and time, for example 2024-01-02 12:00:00 and 2024-12-23 12:00:00. A future date in historical data, or a Latest value much older than expected, stands out here.

Change a date card to day, month, year or hour
Mammoth picks the period from the earliest and latest values. If they fall in different calendar years, the card groups by Year. If they fall in different months of the same year, it groups by Month. Otherwise it groups by Day. Automatic selection only ever picks Day, Month or Year, even for data that spans a few hours. It is recalculated when a filter narrows the dates.
To change it:
- Click the aggregation menu in the card header (it reads Count).
- Choose a Granularity.
- Click Apply.
| Granularity | Example labels | Best for |
|---|---|---|
| Day | 01-Aug-2024 (list) or 1, 2 (chart) | Daily operations, short-term trends |
| Month | Jan '24 (list) or Jan-2024 (chart) | Seasonal patterns, monthly performance |
| Year | 2022, 2023, 2024 | Long-term trends, year-over-year |
| Hour | 01-Aug-2024 08:00 (list) or 8 am (chart) | Intraday patterns, shift analysis |
| Minute | 01-Aug-2024 08:15 (list) or 8:15 am (chart) | Process timing, high-frequency data |
| Second | 01-Aug-2024 08:15:00 (list) or 8:15:00 am (chart) | Real-time monitoring, event logs |
Changing granularity doesn't change your data. In list view, Sort by sorts by the measure or by period in date order.
Patterns and problems a date card reveals
- Seasonality: holiday spikes in retail, new-year bumps in subscriptions, summer slowdowns in B2B.
- Trends: rising bars mean growth; falling bars mean decline.
- Operational rhythms: weekday against weekend, month-end spikes, shift patterns.
- Missing periods: absent bars where daily data should appear every day point to a collection problem.
- Future dates: a Latest value after today in historical data.
- Batch artifacts: heavy clustering on one date, such as 90% of rows on the last day of each month.
Worked example: an orders card by month shows 500–700 orders a month from January to October, 2,400 in November and 3,100 in December. Double-click November and read the product category card to its right: "Gifts" dominates. For website visits over one week, switching to Hour shows peaks at 12:00–14:00 and 20:00–22:00 and a lull at 02:00–06:00.
Troubleshooting Explore Card types
| Symptom | Cause | Fix |
|---|---|---|
| Text card is empty or unexpected | The column is entirely null, or isn't typed as text | Check the column type; refresh the View if data was recently updated |
| Too many text values to read | High-cardinality column | Values load in frequency order as you scroll. Use Search values, or group values with a transformation |
| Text percentages don't add up to 100% | Percentages are rounded to whole numbers, and are relative to the rows the card counts | Check for a filter on an earlier card (filter icon in the header); scroll to load lower-frequency values |
| Number statistics don't change after filtering | The value was selected but not filtered | Click Filter or double-click; check the filter badge |
| Too many bars | The range is wide for the granularity | Raise Granularity (for example from 10 to 100). A very high bar count can itself signal a quality problem |
| Chart jumps to a coarser granularity | Automatic granularity follows the rows currently counted, so a filter can change it | Set the granularity you want and click Apply |
| Number statistics look wrong | Numbers stored as text, or hidden characters or currency symbols | Check the column type and the raw values in the grid. See Column types |
| Date column appears as text, not a chart | Dates in mixed formats (for example MM/DD/YYYY and DD-MM-YYYY) | Use Convert Column Type. See Work with dates |
| Seasonal pattern not visible | Data covers less than one full cycle, or the granularity hides it | Check Earliest and Latest; a year is needed for annual seasonality; try another granularity |
| Earliest or Latest looks wrong | Both include the time part, or the data has future or impossible dates | Read the full datetime; check for dates before the business or system existed |
Related
- Explore Cards: add cards, filter, and the Ask, Search and Compare cards.
- Find and replace values: the Bulk Replace task a text card opens.
- Label rows and insert values: the task a number or date card opens.
- Filter rows: the Conditional Filter task for Remove and Keep.
- Data quality report: a scored check of the whole View.
Something wrong? support@mammoth.io