Calculate with formulas, running totals and ranks
The Numeric Tools in Describe your transformation › Date, Numeric & Text add calculated columns. Math Function works out a value row by row from a SQL expression or a formula. Window function adds running totals, ranks and row-to-row comparisons while keeping every row. Obtain Large or Small Values returns the Nth largest or smallest of several columns in each row.
These are pipeline tasks: they change your data and re-run every time the pipeline refreshes.
Create a calculated column step by step
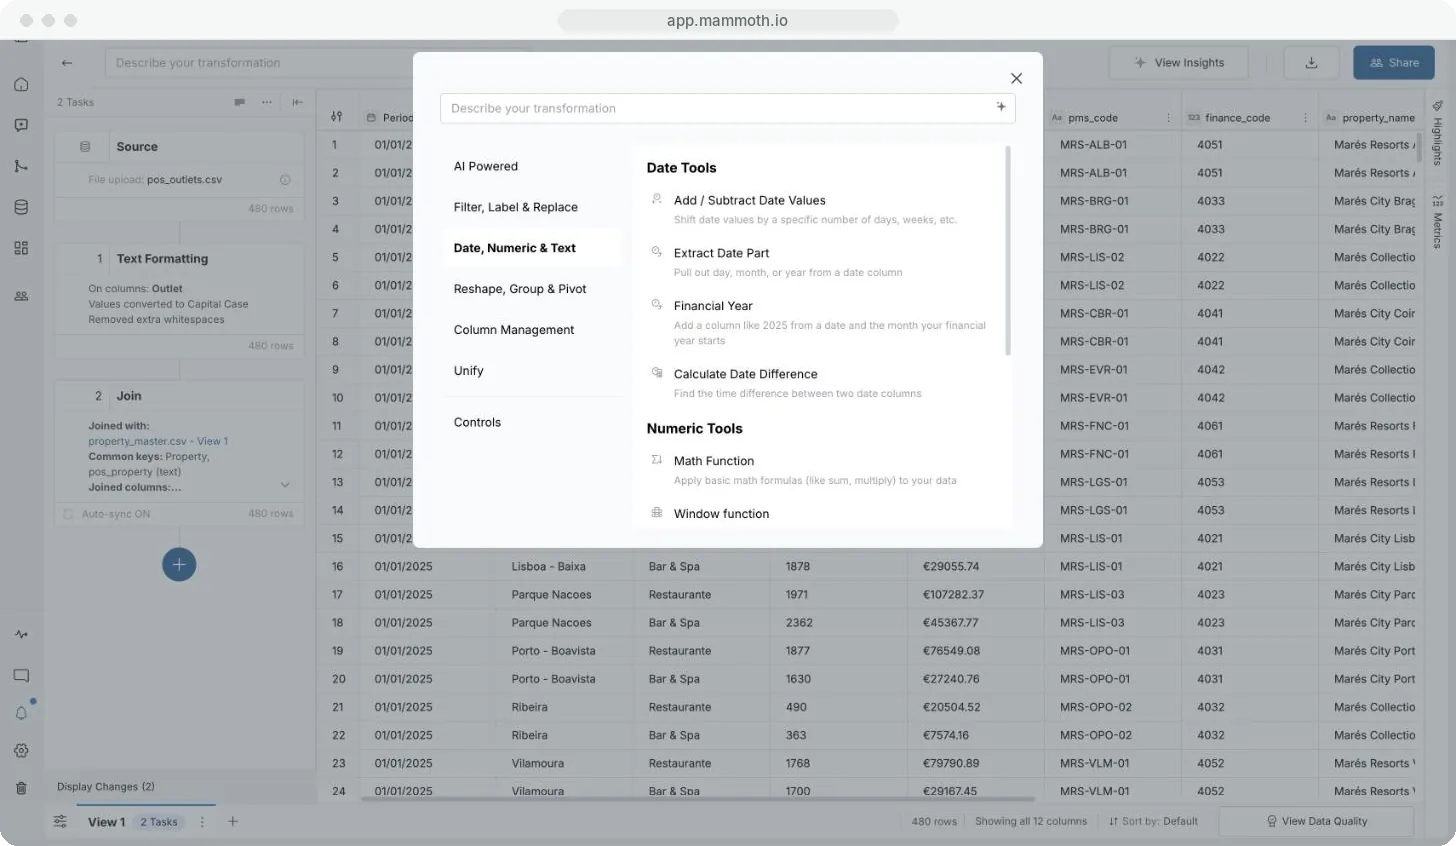
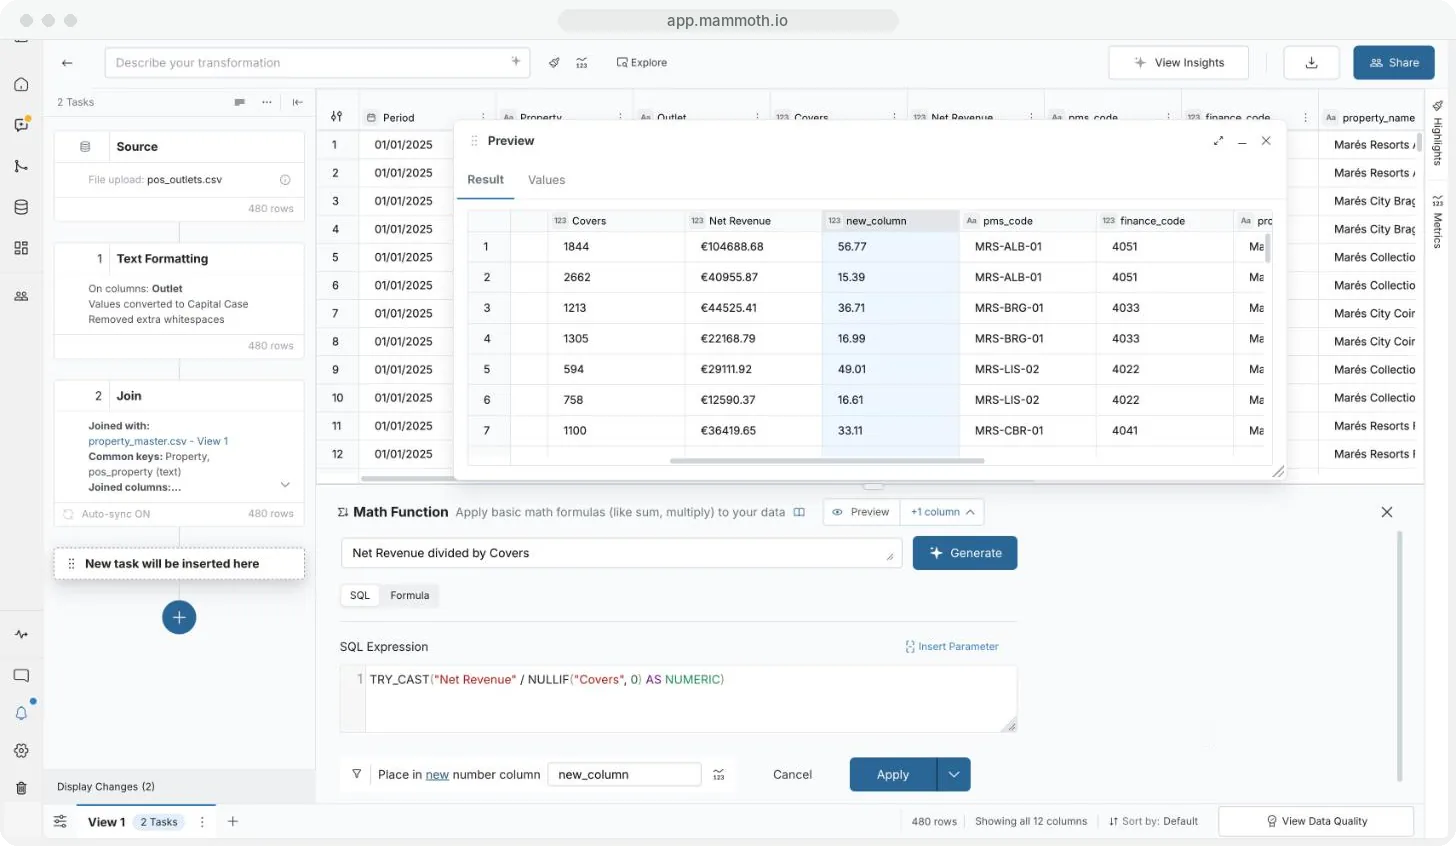
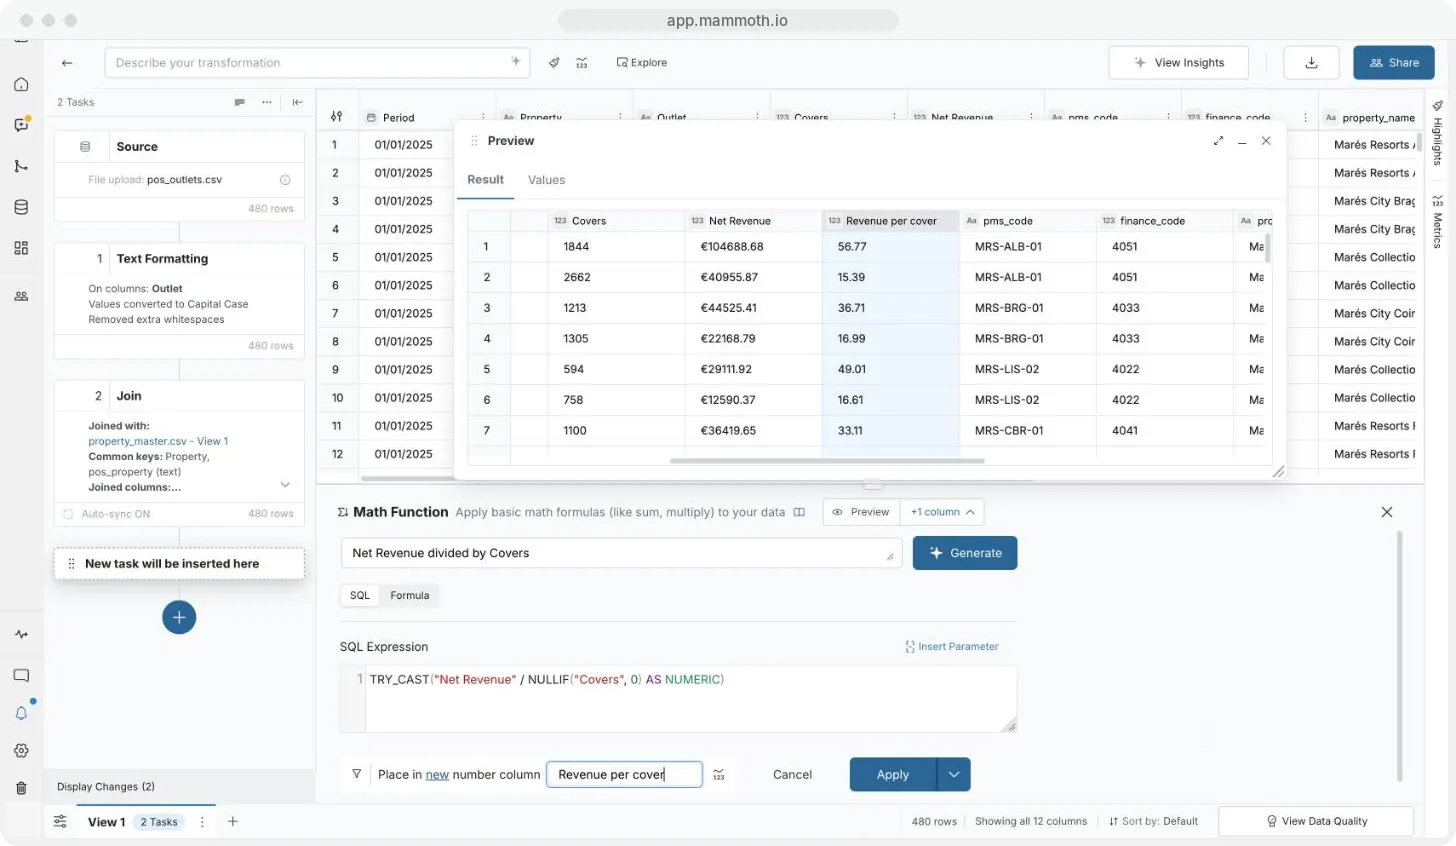
Step 1 of 5: Open Math Function
Write the calculation in SQL mode
- Click Describe what you want to generate and type what you want in plain words, for example "revenue after a 15% discount".
- Click Generate. Mammoth writes a SQL expression into the SQL Expression editor. Review or edit it, or type SQL there yourself.
- If your description also says which rows to change ("double the price where region is Europe"), Mammoth puts that part into the step's row condition instead of the expression. Check it with the filter icon before you apply.
- To add a parameter, click Insert Parameter. It goes in at the cursor as
{Discount_Rate}. Text and Date parameters are wrapped in single quotes ('{Region}') so they read as SQL strings.
Example: ROUND("unit_price" * "quantity_sold" * (1 - {Discount_Rate}), 2) uses a Number parameter and DuckDB's ROUND function.
Write the calculation in Formula mode
Type a formula with column names in double quotes, the operators +, -, * and /, brackets and the built-in functions. The placeholder shows the shape: "Column1" + "Column2" or SUM("Column1") + INT("Column1"/10). An autocomplete list appears as you type: pick a column, function or parameter to insert it. A message under the formula says "Looks good" or names the problem.
Examples:
| Formula | Result |
|---|---|
"unit_price" * "quantity_sold" | Line revenue per row |
("actual" - "target") / "target" * 100 | Percentage variance against target |
INT("total_revenue" / 12) | Monthly average with the decimals dropped |
"revenue" / SUM("revenue") * 100 | Each row's share of the total, in percent |
"revenue" - AVG("revenue") | Each row's distance from the average |
Calculate only for rows that match a condition
Click the filter icon at the left of the Place in row. The condition dialog has the same AI prompt, Builder and SQL options as Conditional Filter. Rows that don't match keep their current value when you write to an existing column. In a new column they stay empty.
Formula syntax and built-in functions
| Part | How to write it |
|---|---|
| Column | The column name in double quotes, such as "unit_price". Only Number columns are allowed. |
| Number | A plain number, such as 12 or 0.5 |
| Operators | +, -, * and /. Multiplication and division run before addition and subtraction. |
| Brackets | ( and ) to group parts of the formula |
| Parameter | A Number parameter in curly braces, such as {Max_Units} |
A formula can start with - or + but not with * or /. An empty cell in a column counts as 0. Dividing by 0 leaves the result cell empty.
| Function | Takes | Returns |
|---|---|---|
SUM("Column") | One Number column | The column total |
AVG("Column") | One Number column | The column average |
MIN("Column") | One Number column | The smallest value in the column |
MAX("Column") | One Number column | The largest value in the column |
STDDEV("Column") | One Number column | The column's standard deviation |
COUNT() | Nothing | The number of rows |
INT(expression) | Any formula | The whole-number part. It drops the decimals rather than rounding, so INT(7.9) is 7 and INT(-7.9) is -7. |
ABS(expression) | Any formula | The value without its sign, so ABS(-4) is 4 |
SUM, AVG, MIN, MAX, STDDEV and COUNT look at the whole column, not the current row, so every row gets the same value. If the step has a condition built in Builder, they cover only the matching rows. INT and ABS take a full formula, so they can wrap other functions: INT(SUM("units") / COUNT()).
Use a parameter in a formula
Click Insert Parameter above the formula, or pick the parameter from the autocomplete list. Only Number parameters can be used in a formula. Each run uses the parameter's current value. When the value changes, the pipeline is marked stale until you rerun it. See Parameters and snippets.
Warnings about IDs and money
In Formula mode, Mammoth adds a note when a formula does arithmetic on a column marked as an ID ("IDs are labels, not amounts, so doing arithmetic on them isn't meaningful.") or mixes an amount of money with a percentage ("This formula mixes an amount of money with a percentage. Check that the result is what you mean."). The notes never block the step. See Column types, IDs, currency and percentages.
Write SQL expressions in DuckDB SQL
Math Function's SQL mode and Conditional Filter's SQL mode take a SQL expression instead of a formula. Pipeline steps run on DuckDB, so write DuckDB SQL and use any DuckDB function, such as ROUND, COALESCE, CASE WHEN or DATE_DIFF.
| Where | What you write | Example |
|---|---|---|
| Math Function, SQL mode | An expression that returns a number for each row | ROUND("price" * 1.2, 2) |
| Conditional Filter, SQL mode | A condition that is true for the rows to keep or remove | "region" = 'Europe' AND "amount" > 100 |
- Put column names in double quotes and text values in single quotes.
- Describe what you want to generate writes the SQL from a plain-English description. Edit the result before you apply.
- In Math Function, Insert Parameter adds a parameter as
{Discount_Rate}, with single quotes around Text and Date parameters. A Conditional Filter's SQL doesn't read parameters; use Builder mode with the Parameter comparison type there. - Math Function's SQL result is always stored as a number.
For a whole query across a View, use Write SQL with AI.
Add a running total, rank or moving comparison
Window function runs a calculation across rows and keeps every row. Group & Pivot gives one summary row per group; a window function adds its result as a new column beside the original rows. Use it for rankings, running totals and row-to-row comparisons. A number column's 3-dot menu has shortcuts: Calculate running total and Ranking.

| Setting | What it does |
|---|---|
| Select function | Sum, Average, Min, Max, Standard Deviation, Variance, Count, Row number, Rank, Dense rank, Percent rank, Cumulative percent rank, N tile, First Value, Last value, Nth value, Lead, Lag. |
| Select column | The column to run the function on. Shown for Sum, Average, Min, Max, Standard Deviation, Variance, First Value, Last value, Nth value, Lead and Lag. Count, Row number, Rank, Dense rank, Percent rank, Cumulative percent rank and N tile need no source column. |
| Value of N | For N tile (a whole number of 2 or more) and Nth value (1 or more). |
| Type | For Sum, Average, Min, Max, Standard Deviation, Variance, Count, First Value, Last value, Nth value and N tile. Accumulate (default) builds the result row by row: a Sum of 5, 10 and 15 gives 5, 15 and 30. Aggregate works out one summary per group and stamps it on every row: if a group's total is 30, every row in it shows 30. |
| Offset | For Lead and Lag: a whole number of 1 or more. |
| Limit ranking result | For Row number, Rank and Dense rank. Turn it on to enter Limit to following no. of rows and keep only the top ranks. |
| Group by | Runs the calculation within each group, for example ranking within each region rather than across all data. |
| Add Sort | The order rows are processed in. Shown for Row number, Rank, Dense rank, Percent rank, Cumulative percent rank, Lead and Lag, and for the other functions when Type is Accumulate. Row order matters for a running total. |
| Place in | A name for the new column, or an existing column to overwrite. |
Mammoth warns when a sum, average or ranking runs over an ID column: "IDs are labels, not amounts, so a running total or ranking of them isn't meaningful." The warning doesn't block Apply.
Rank customers by revenue within each region
- Open Window function and select Rank.
- Click Group by and select
region. - Click Add Sort, choose
revenueand sort descending. - Name the new column and click Apply.
Every customer row gets a rank within its region, not across the whole dataset.
Find the largest or smallest of several columns in each row
Obtain Large or Small Values compares a set of number columns row by row and returns the Nth largest or smallest value.
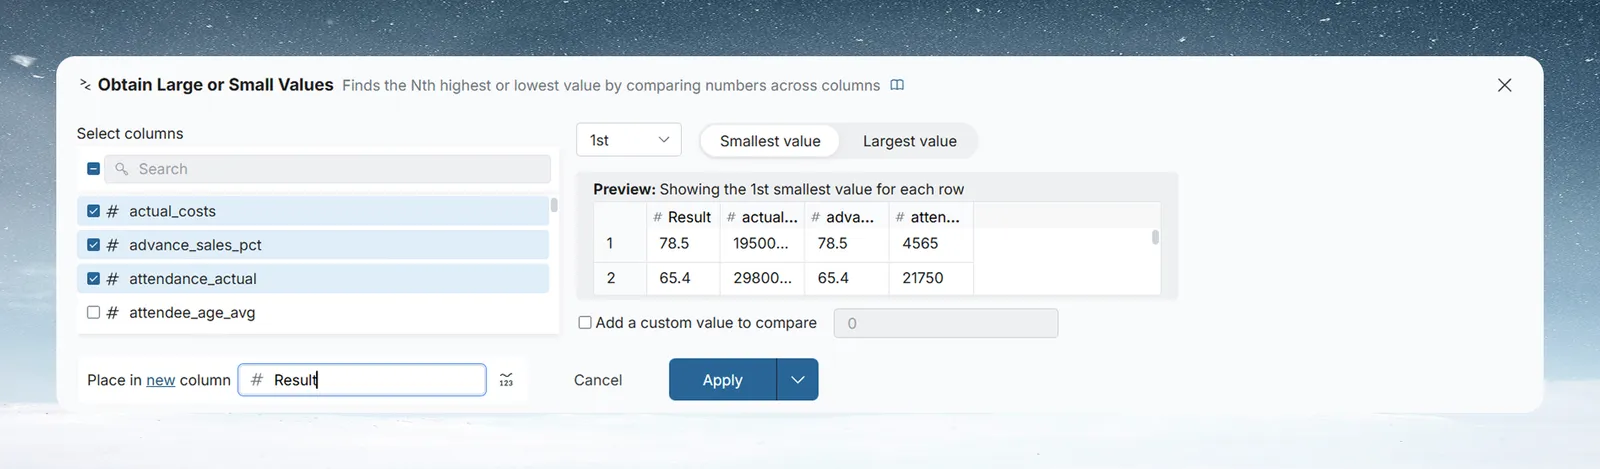
- In Select columns, tick the number columns to compare (at least two). Use the search box to find them.
- In Select Nth, set the rank to return: 1st, 2nd, 3rd and so on.
- Choose Largest value or Smallest value.
- Optional: in Add a custom value to compare, add a fixed number. It counts as an extra column and shows as its own column in the preview. It can be a Number parameter (click the Val chip).
- Check the Preview, which updates as you go.
- In Place in, name the output column or choose an existing column to overwrite. Click Apply.
For example, with three price columns, supplier_a_price, supplier_b_price and supplier_c_price, select all three, choose 1st and Smallest value. The result is the cheapest quote in each row, so you can see the best supplier per product.
Troubleshooting formula messages
The formula is checked as you type. A valid formula shows "Looks good". Otherwise the message names the problem:
| Message | What to fix |
|---|---|
| "Empty expression" | Type a formula. |
| "Expression can not begin with * or /" | Start with a column, number, function, bracket or minus sign. |
| "Expression can not end with any of +, -, *, /" | Finish the formula after the last operator. |
| "Operators +, -, *, / can not be followed by other operators" | Remove the doubled operator. |
| "Expected an operator +, -, *, / before ..." | Add an operator between two values. |
| "Syntax error: unmatched brackets" | Every ( needs a matching ). |
| "Only numeric columns allowed" | Use a Number column, or convert the column first with Convert Column Type. |
| "Column ... is missing" | The column was renamed or removed earlier in the pipeline. |
| "Function ... takes no arguments" | Write COUNT() with nothing inside. |
| "Function ... takes exactly 1 argument" | Give SUM, AVG, MIN, MAX or STDDEV one column. |
| "Invalid arguments for ..." | The function needs a column in double quotes. |
| "Invalid: ..." | The text isn't a column, number, operator, function or parameter. Check the spelling and quotes. |
| "Parameter ... not found" | No parameter has that name. |
| "Only numeric parameters allowed, ... is not one" | Use a Number parameter. |
In the formula's column list, a column can be marked "(column missing)" or "(not a numeric column)".
Other problems:
| Symptom | Cause | Fix |
|---|---|---|
| Every row shows the same value | SUM, AVG, MIN, MAX, STDDEV or COUNT looks at the whole column | Combine it with a column, for example "revenue" / SUM("revenue") |
| Result cells are empty | Division by 0, or rows outside the step's condition in a new column | Check divisors and the condition |
| A running total looks out of order | The rows aren't sorted as you expect | Set Add Sort in Window function |
Related
- Work with dates and financial years: the Date Tools in the same category.
- Work with text and JSON: the Text Tools in the same category.
- Group, pivot and unpivot: one summary row per group instead of a window.
- Write SQL with AI: run a whole SQL query on a View.
- Filter rows: SQL conditions for keeping or removing rows.
- Parameters and snippets: values you reuse across formulas.
Something wrong? support@mammoth.io