Add filters to a dashboard: dropdowns, checklists, ranges
Filters let you and your readers slice a dashboard's data without changing the charts. When the AI builds a dashboard, it derives a few default filters from your data; you add more with Add → Filter in the editor header, or by asking the AI chat. Anyone with edit access to the board can add, edit, reorder or remove filters.
The filters bar is a section of the dashboard. To show or hide it, open the Design tab and use Sections (Filters bar). See Change a dashboard's theme.
Choose a filter control: chips, checklist, dropdown, search, range or motion
Each filter has a control, which sets how people pick values. They appear in this order when you add a filter:
| Control | How people pick | Best for |
|---|---|---|
| Chips | Removable pills that people tap to include. | A handful of options. |
| Checklist | Tick boxes to include several values at once. This is the default control for a text field. | Medium-length lists, like Region or Product Category. |
| Dropdown | Pick a single value from a menu. Compact. | One choice at a time, like Status or Type. |
| Search | Type to find a value. | Long lists, like customer names or product IDs. |
| Range | Drag a minimum and maximum. The default for number and date fields. | Number and date fields. |
| Motion | A playable timeline for a date field. Press play and the whole dashboard sweeps through time. | Showing change over time. |
Range and Motion need a number or date field. On a text field their tiles are greyed out.
A board can have only one Motion filter. While another field has it, Motion is unavailable for new filters.
Add a filter by asking the AI chat
Type a request in the editor's AI chat, for example:
"Add a filter for product category"
See Edit with AI in the dashboard editor for how the chat works.
Add a filter from the Add menu
- Click Add in the editor header, then choose Filter ("Let people slice data").
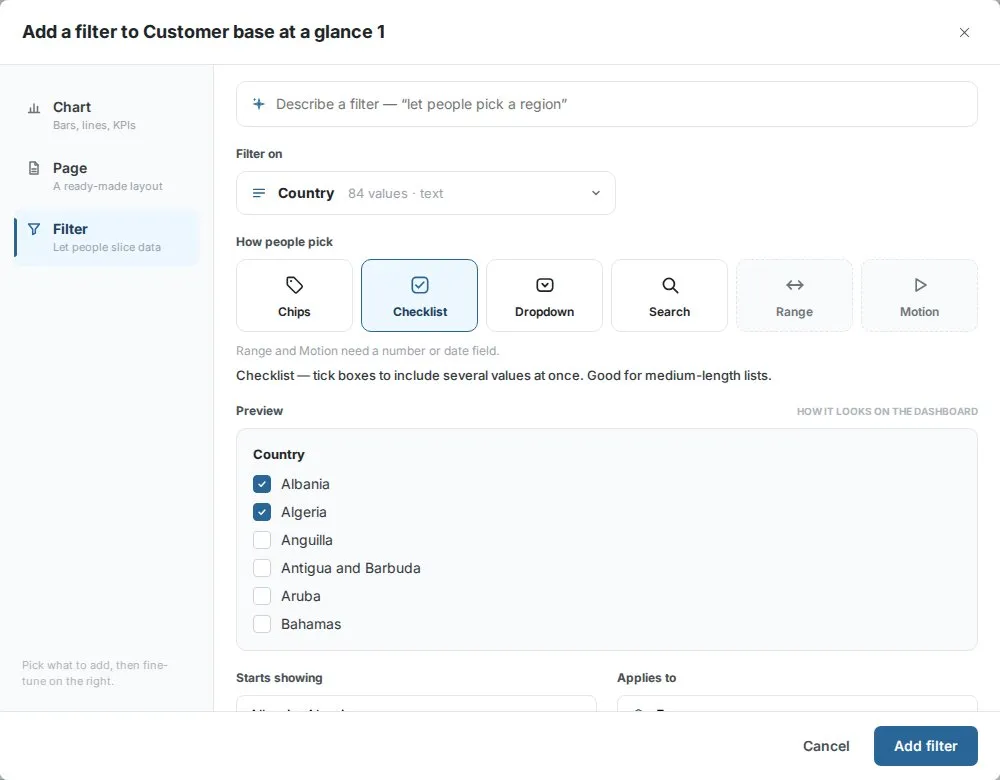
- Describe the filter in the box at the top (for example, "let people pick a region") and press Enter. Or pick the field yourself under Filter on. The field shows its number of values and its type.
- Under How people pick, choose the control: Chips, Checklist, Dropdown, Search, Range or Motion. A line under the tiles describes the one you picked.
- Check the Preview to see how the filter will look on the dashboard.
- For Chips and Checklist, choose what it Starts showing.
- Choose what it Applies to.
- Click Add filter.
If Mammoth can't work out a field from your description, it shows "Couldn't resolve a filter. Try another field." with a Find field button.
Open a dashboard already filtered with starting values
Starts showing sets which values are selected when the dashboard opens. Use it to open the board already filtered to a region, product or other value. It appears only for the Chips and Checklist controls.
It is a checklist of the field's values. The first two values are ticked by default. Tick or untick values to change the selection. If you untick everything, it reads Nothing pre-selected.
Dropdown, Search, Range and Motion filters have no starting values in this panel.
Make a filter apply to every page or one page
You set each filter's scope under Applies to when you add it:
| Scope | What it does |
|---|---|
| Every page | The filter applies to the charts on all pages. |
| This page | The filter applies only to the page it's on. |
On a dashboard built on several tables, a filter can only reach pages whose data has its field. Applies to then reads, for example, "3 pages with Region" instead of Every page. If only the current page has the field, This page is the only option. See Add a page that reads another table.
Edit a dashboard filter's field, control or name
In the editor, click a filter on the canvas (or the Edit filter pencil on its toolbar). The Edit filter panel opens with the note "Applies to the whole dashboard".
| Option | What it does |
|---|---|
| Field | Points the filter at a different field. |
| Control | Changes how people pick: Checklist, Dropdown, Chips, Search or Range. |
| Name | Renames the filter's label on the dashboard. The field name shows as a placeholder. |
Click Save changes to keep your edits, or Cancel to discard them. The values always come live from your data.
Edit filter doesn't change the scope or the starting values, and its control list has no Motion.
Reorder or remove dashboard filters
In the editor, hover a filter in the filters bar to show its toolbar:
- Move up and Move down change the filter's position. The new order saves right away.
- Remove filter (the bin) deletes the filter.
The bin only appears on filters you added. Filters the AI derived from your data have no delete. To get rid of one, ask the chat (for example, "Remove the Revenue filter"). Or hide the whole filters bar under Design → Sections.
How filters change charts, KPI cards and text
When a reader changes a filter:
- The charts in its scope update to show only matching data.
- KPI cards recalculate their totals.
Text blocks don't change with filters. To show what a reader has filtered to inside a text block, use the {filters} live token. See Show the last updated date automatically with live tokens.
What readers see: filter pills or the Filters sidebar
Where filters sit on the published dashboard (and in Preview) depends on the board's look.
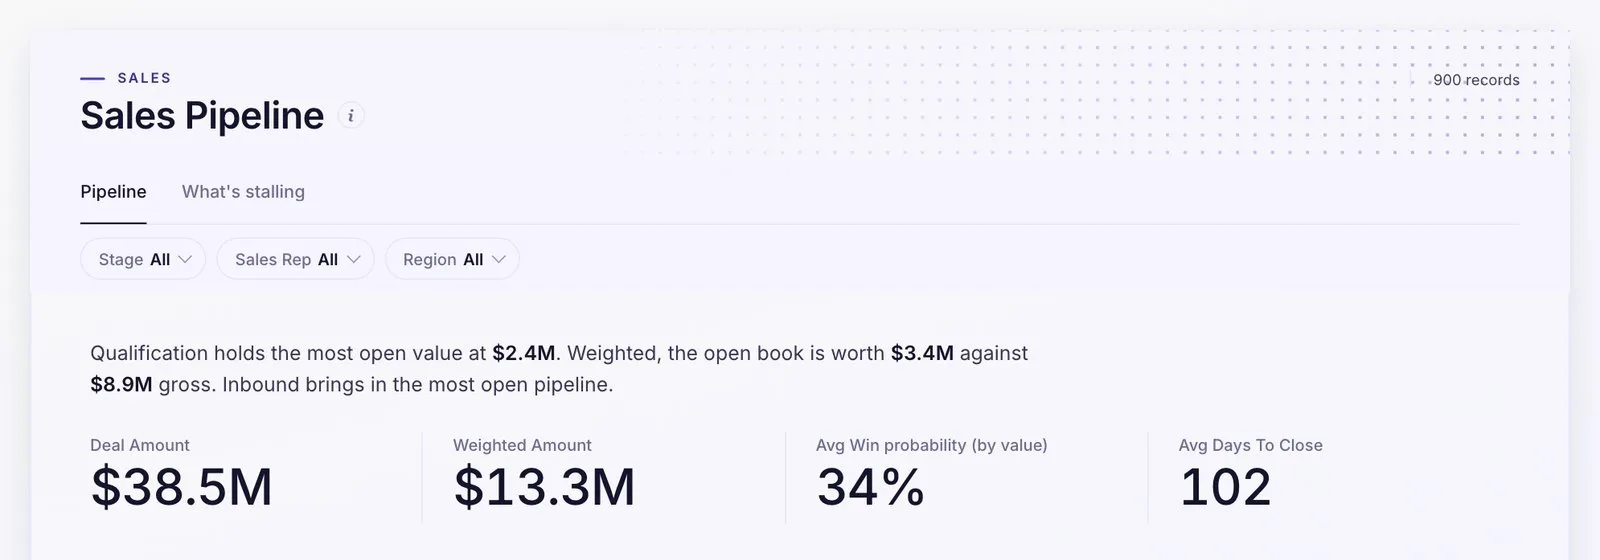
Open look (most themes): filters sit in a row of pills under the title. Each pill shows its filter's name and current value: All, the value picked, or how many are selected. Click a pill to change it. Filters that don't fit on one row go under More filters, and a filter you set there moves up into the row so what is filtered stays in sight. On a narrow screen, filters open from a filter button instead.
Classic look: filters sit in a Filters sidebar.
- Collapse filters (the chevron in the sidebar header) hides the sidebar. On boards with top tabs, a round Show filters button then appears, with a count of the active filters. Click it to open the sidebar again.
- Active filter values show as pills above the dashboard content. Clear all removes every active filter at once.
- On a phone, the sidebar becomes a drawer. Open it from the Filters button in the header. Close it with Close filters (×) or by tapping outside it.
For everything else a reader sees, see What viewers see.
Limits
- One Motion filter per board.
- Range and Motion need a number or date field.
- Starting values exist only for Chips and Checklist.
- On a board with several tables, a filter reaches only pages whose table has its field.
Troubleshooting dashboard filters
| Symptom | Cause | Fix |
|---|---|---|
| "Couldn't resolve a filter. Try another field." | Mammoth couldn't match your description to a field. | Click Find field and pick the field yourself. |
| Motion is greyed out. | Another field already has the board's Motion filter, or the field is text. | Remove the other Motion filter, or pick a date field. |
| A filter has no bin to remove it. | The AI derived the filter from your data. | Ask the chat to remove it, or hide the filters bar under Design → Sections. |
| The board opens showing only some data. | A Chips or Checklist filter has values ticked under Starts showing. | Edit the filter in the editor, then publish. See Fix dashboard problems. |
Related
- Pages and navigation: how filters reach pages on other tables.
- Let readers filter, drill down or see rows behind a chart: click-to-filter from a chart.
- Change a dashboard's theme: show or hide the filters bar.
- Tables, KPI cards, insights and text: the
{filters}live token. - What viewers see: the published board from a reader's side.
Something wrong? support@mammoth.io