Add a chart to a dashboard and pick the right type
Mammoth dashboards have 44 chart types, from bars and lines to maps, Sankey diagrams and Gantt charts. In the dashboard editor, click Add in the header to open the chart picker; every chart reads its numbers straight from your data. Anyone who can edit the dashboard can add, change and remove charts.
To change a chart's fields once it's on the board, see Set up a chart. To have the AI draw a chart the library doesn't have, see Custom charts.
Add a chart with the chart picker
- Open the dashboard in the editor.
- Click Add in the header. The Add a chart dialog opens on the Chart tab ("Bars, lines, KPIs"). The other tabs, Page and Filter, add a page or a filter.
- Pick a chart type from the gallery, or describe the chart you want.
- A studio opens with a live preview of the chart on your data (Live preview · your dashboard theme). Adjust the fields on the left.
- Click Add chart, or press ⌘ + ↩.
An empty canvas has its own Add button that opens the same dialog. The Add below button on a chart opens it too, and the chart you pick lands below that one.
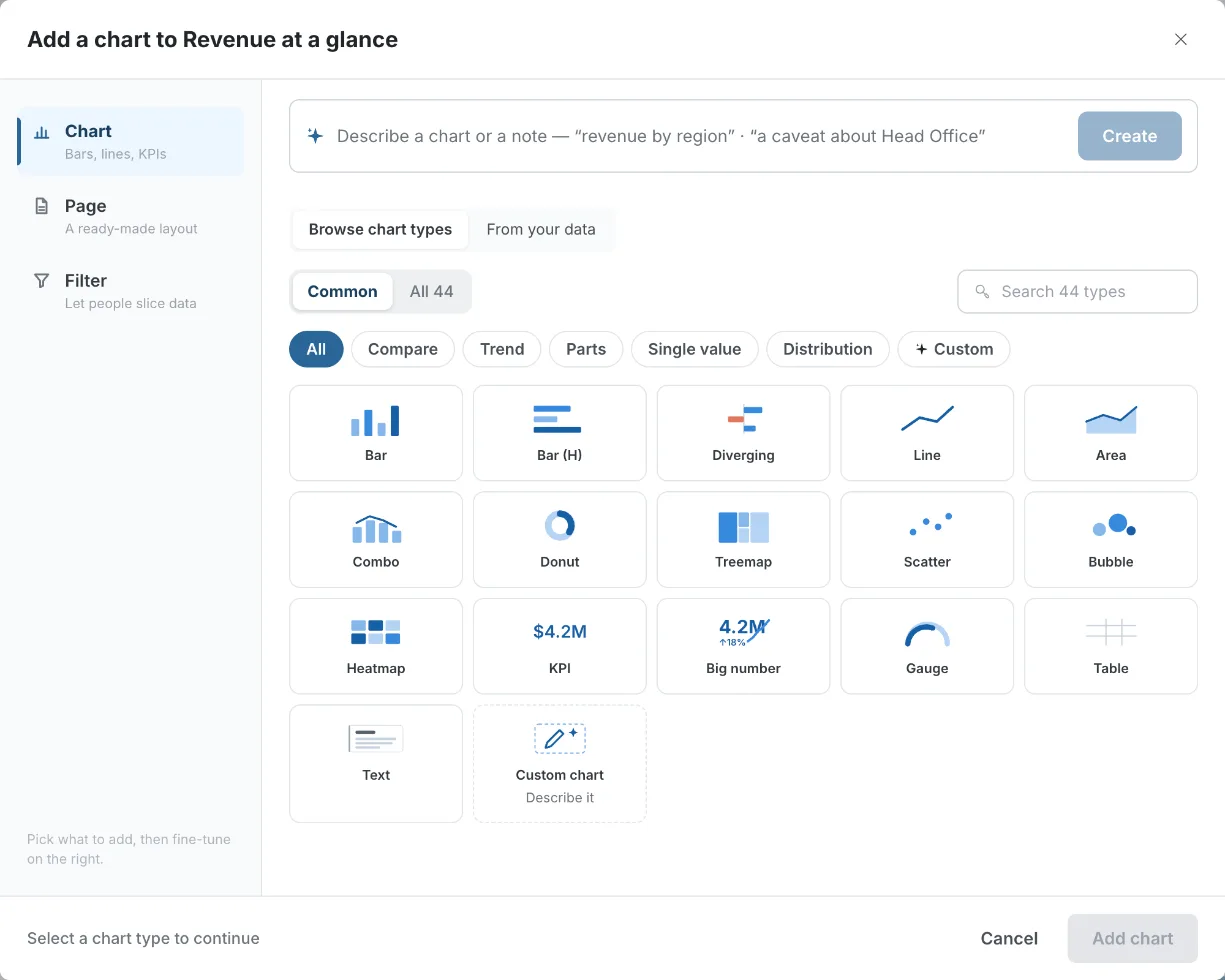
Describe a chart in plain English instead of picking one
The box at the top of the dialog takes a plain-English description, for example "revenue by region, last 4 quarters".
- Type the description.
- Click Create. The AI picks the chart type and fields for you.
- Check them in the studio, then add the chart.
You can also describe a note here ("a caveat about Head Office"), and it opens a text block instead.
If you ask for something the data can't show, such as a forecast, the studio says why and offers the closest chart it can draw. See When you ask for a forecast.
Browse chart types or start from your columns
Two tabs sit under the describe box:
| Tab | What it does |
|---|---|
| Browse chart types | The default. A gallery of chart thumbnails, grouped by category. |
| From your data | Start from the columns you want to chart instead of a chart type. The tab shows how many columns you picked, with Clear to start over. See Browse a source's columns. |
Show Common or All 44 chart types
A switch above the gallery sets how many types you see:
- Common (the default) shows the most-used types.
- All 44 shows the full catalogue.
Under Common, the All chip shows 16 tiles: Bar, Bar (H), Diverging, Line, Area, Combo, Donut, Treemap, Scatter, Bubble, Heatmap, KPI, Big number, Gauge, Table and Text. The last tile is always Custom chart ("Describe it").
Filter chart types by category
Category chips narrow the gallery:
| Scope | Chips |
|---|---|
| Common | All, Compare, Trend, Parts, Single value, Distribution |
| All 44 | All, Compare, Trend, Parts, Single value, Distribution, Time, Map, Table, Text |
A Custom chip always comes last. It holds New custom chart and your workspace's saved charts. See Custom charts.
Under Common, each chip shows a shorter list. For example, Compare shows Bar, Bar (H), Ranking (dots), Diverging, Grouped bar, Stacked bar and 100% stacked. Switch to All 44 to see the rest. Icon stat and Pictograph carry a New badge.
Search for a chart type by name or everyday word
The search box ("Search 44 types") always searches the full catalogue, whatever scope or chip is selected. It also understands a few everyday words:
| You type | It finds |
|---|---|
| "people", "pictogram", "waffle", "icon" | Pictograph and Icon stat |
| "custom", "describe", "bespoke" | The Custom chart tile |
| "caveat", "methodology", "source", "note" or "footnote" | The Text tile, already set to that kind of note |
If nothing matches, the gallery shows "No chart types match — Describe it as a custom chart". Click it to open the custom chart studio with your search text filled in.
Why a chart type is greyed out in the picker
Some charts need a particular kind of field. When your data doesn't have it, the tile is disabled and shows why, on the tile and in its tooltip.
| Message | Chart types |
|---|---|
| "Needs a date field" | Bump (ranking over time), Calendar heatmap |
| "Needs a category field" | Beeswarm (every point) |
| "Needs three measures" | Bubble |
| "Needs a date and 4+ measures" | Candlestick |
| "Needs two date fields" | Gantt |
| "Needs two categories" | Network |
| "Needs a location field" | Map |
If the dataset's fields fail to load, the dialog shows "Couldn't load this dataset's fields. Reopen the panel to try again."
Every dashboard chart type, by family
The tables below list every chart in the gallery, grouped by the category chip it sits under. "What it needs" is the fields you set in the chart's Data section. See Choose the chart's fields.
Charts to compare categories
Compare a number across categories: regions, products, teams. Under Common, Marimekko, Pareto and Radar are left out.
| Chart | Best for | What it needs |
|---|---|---|
| Bar | Comparing a number across categories with vertical bars | A category (By) and a Measure |
| Bar (H) | The same with horizontal bars. Suits long names and rankings | A category and a measure |
| Ranking (dots) | Ranked values as a dot on a stem, with less ink than bars | A category and a measure |
| Diverging | Positive and negative values either side of zero | A category and a measure with +/- values |
| Grouped bar | Side-by-side bars per category, for a second breakdown or several measures | A category and one or more measures |
| Stacked bar | Bars split into segments by a second field | A category, a Split by field and a measure |
| 100% stacked | The mix within each category, with every bar at 100% | A category, a Split by field and a measure |
| Marimekko | Bar width shows each category's size, segments show its mix | A category, a Split by field and a measure |
| Pareto | Sorted bars with a cumulative % line, for the 80/20 read | A category and a measure |
| Radar | One measure across several categories on spokes | A category and a measure |
Charts to show a trend over time
Show how a number changes over time. Under Common, Bump and Candlestick are left out.
| Chart | Best for | What it needs |
|---|---|---|
| Line | Change over time | A date (or category) and a measure |
| Area | Change over time with the volume filled in | A date and a measure |
| Stacked area | How each part's contribution changes over time | A date, a Split by field and a measure |
| Bump (ranking over time) | How ranks change from period to period | A date, a category and a measure |
| Slope | Change between two points (before and after) for each category | A category and two measures |
| Combo | Bars and a line together, on two axes if needed | A date or category and two or more measures |
| Sparkline | A tiny trend line with no axes | A date and a measure |
| Candlestick | Open, high, low and close for each period | A date and four measures |
Charts to show parts of a whole
Show how a total splits into its parts. Under Common, Sunburst, Waterfall and Funnel are left out.
| Chart | Best for | What it needs |
|---|---|---|
| Donut | Share of a total, as a ring | A category and a measure |
| Composition | Share of a total, as one segmented bar | A category and a measure |
| Treemap | Share of a total, as rectangles sized by value | A category and a measure |
| Pictograph | Counts drawn as repeated icons ("people", "homes") | A category and a measure |
| Sunburst | A two-level share of a total, as rings | Two categories and a measure |
| Waterfall | How positive and negative steps build to a total | A category and a measure |
| Funnel | Drop-off through ordered stages | A stage field and a measure |
Charts for a single headline number
One headline number. The same five types appear under Common and All 44. Only Bullet has a By field.
| Chart | Best for | What it needs |
|---|---|---|
| KPI | One number with a label and its change | A measure |
| Big number | One large headline number, with an optional change caption | A measure |
| Gauge | One number against a scale, with optional red/amber/green zones | A measure (set the Max value) |
| Bullet | One number against a target | A category and a measure (set the Target) |
| Icon stat | One number with an icon | A measure |
For a row of KPI cards across the top of a page, see Tables, KPI cards, insights and text.
Charts to show distribution, relationships and flow
How values spread out, and how two things relate or flow. Under Common, Beeswarm, Dumbbell, Sankey and Network are left out.
| Chart | Best for | What it needs |
|---|---|---|
| Scatter | The relationship between two measures | Two measures (X and Y) |
| Bubble | A scatter with a third measure as bubble size | Three measures |
| Histogram | How values spread across ranges (bins) | One measure (no By) |
| Box plot | Median, quartiles and outliers per group | A category and a measure |
| Beeswarm (every point) | Every value as a dot, grouped | A category and a measure |
| Dumbbell | The gap between two values per category | A category and two measures |
| Heatmap | A measure across two categories, as shaded cells | Two categories (Rows and Columns) and a measure |
| Sankey | Flow from one category to another | Two categories and a measure |
| Network | Links between the values of two categories | Two categories |
Calendar and Gantt charts
Dates laid out as a calendar or a schedule. These two only appear under All 44, behind the Time chip, or through search.
| Chart | Best for | What it needs |
|---|---|---|
| Calendar heatmap | A daily measure laid out as a calendar grid | A date and a measure |
| Gantt | Spans between a start and an end date for each item | Two date fields and a category |
Map chart of countries or US states
The Map chart shades regions by a measure, for countries of the world or US states. Find it under All 44 → Map chip, or search "map". It isn't in the Common set.
What it needs: A location field and a measure. A text field counts as a location field when most of its values are country names or US state names.
- Common spellings work, such as USA, US, America, UK, Britain, UAE and Russian Federation.
- Mammoth uses the world map or the US map, whichever fits your values better.
- Cities and postcodes don't count. Without a location field, the tile shows "Needs a location field".
Two options control how the map looks. Set them in the chart's edit panel.
| Option | Choices | What it does |
|---|---|---|
| Projection | Equal Earth (default), Mercator, Albers USA | "How the globe is flattened onto the map. Equal Earth keeps country sizes honest; Mercator is the familiar web-map look; Albers USA zooms to the United States." |
| Binning | Continuous (default), Quantile, Equal | How values map to colour: a smooth ramp, buckets with the same number of regions in each (quantile), or bands of equal width. |
Color scale sets the base colour; darker regions are higher values. Number format works as on other charts.
Tables and text blocks
Under All 44, the Table and Text chips add a table or a text block (a note, caveat, source and more). See Tables, KPI cards, insights and text.
Edit, duplicate or delete a chart from its toolbar
Hover over or select a chart on the canvas to show its toolbar:
| Button | What it does |
|---|---|
| Edit | Opens the chart's edit panel. Clicking anywhere on the chart does the same. |
| Duplicate | Adds a copy of the chart. |
| Add below | Opens Add a chart. The chart you pick drops in below this one. |
| Delete | Removes the chart from the board. |
To move or resize a chart, drag it or its edge on the canvas. See Edit with AI in the dashboard editor. To embed a single chart rather than the whole dashboard, see Embedding.
Switch a chart to another chart type
You don't need to delete a chart to try a different type. In the chart's studio or edit panel, under the chart type name:
- Also works as shows two or three types that fit the same fields. For example, a Bar chart offers Bar (H), Ranking (dots) and Donut. Click one to switch. Your fields carry over.
- See more opens the Chart types list with every type. Types that don't fit your data are disabled with the reason, such as "Needs a date field".
If you typed your own Title, it stays when you switch type.
Which charts work on a comparison page
A comparison page puts the values of one column side by side, so not every chart fits it. When you add a chart to a comparison page, the picker changes:
- The scope switch reads Works side by side and Not on this page, each with a count, instead of Common and All.
- Charts that can't be shown side by side show a lock and the note "These can’t merge into one side-by-side view. Pick a bar, line, composition or scatter-family chart instead."
- Some types are redrawn as a type that works on the page, and drop out of the gallery. Search for Pie, Donut, Treemap, Diverging, Pareto or Bubble and the picker tells you what it's added as, for example "Donut is added as Composition on this page". If you describe one of these, the studio says so, for example "Added as Composition on this page".
- If you describe a chart that can't be shown side by side, the picker says "Can’t be shown side by side — try a bar, line, composition or scatter-family chart".
- The Custom chip and the Custom chart tile are hidden. Custom charts can't be added to comparison pages.
See Pages and navigation for comparison pages.
Related
- Set up a chart: fields, Top N, multiple measures and two axes.
- Chart style, annotations and captions: the options each chart type has.
- What readers can do with a chart: filter, see rows and drill down.
- Custom charts: describe a chart the library doesn't have.
- Tables, KPI cards, insights and text: the other building blocks.
Something wrong? support@mammoth.io