Mammoth for technical users: SQL, templates and automation
This plan is for data engineers, BI developers and analytics engineers who field frequent data requests from business users. You first check that Mammoth meets your technical needs (Ask in plain words in the Transform menu under AI Powered, and a large dataset), then encode your logic as pipeline templates that business users run without code. Templates are saved from More Pipeline options (...) > Pipeline Version history.
The key capabilities are connectors to databases and APIs and exports back to them; joins, lookups, Ask in plain words and other advanced tasks; Parameters and Snippets reused across pipelines; and the REST API, the mammoth CLI and the Mammoth MCP server.
Aim for one team member enabled and a template library started in week 1, several people handling routine requests in month 1, and a standard template library in use by month 3. The goal is to remove repetitive requests that don't need your expertise, not all requests.
Check SQL support with an advanced Ask in plain words query
Ask in plain words (Transform menu > AI Powered) runs a DuckDB SQL SELECT on the view. The view's name is the table name. Adapt the view and column names to your data:
-- Your Test: Complex analytical query
WITH monthly_revenue AS (
  SELECT
    CAST(DATE_TRUNC('month', "order_date") AS TIMESTAMPTZ) AS month_ts,
    "customer_id",
    CAST(SUM("order_amount") AS NUMERIC) AS revenue_sum,
    CAST(ROW_NUMBER() OVER (
      PARTITION BY "customer_id"
      ORDER BY DATE_TRUNC('month', "order_date")
    ) AS NUMERIC) AS customer_month_num
  FROM "View 1"
  WHERE "order_status" ILIKE 'completed'
  GROUP BY DATE_TRUNC('month', "order_date"), "customer_id"
),
cohort_retention AS (
  SELECT
    CAST(month_ts AS TIMESTAMPTZ) AS cohort_month,
    CAST(customer_month_num AS NUMERIC) AS customer_month,
    CAST(COUNT(DISTINCT "customer_id") AS NUMERIC) AS customers_count,
    CAST(SUM(revenue_sum) AS NUMERIC) AS cohort_revenue
  FROM monthly_revenue
  GROUP BY month_ts, customer_month_num
)
SELECT * FROM cohort_retention
ORDER BY cohort_month, customer_month
The preview above the panel shows the result, and Apply adds it as a task. A query must be one SELECT statement that reads only this view; CTEs and window functions are fine.
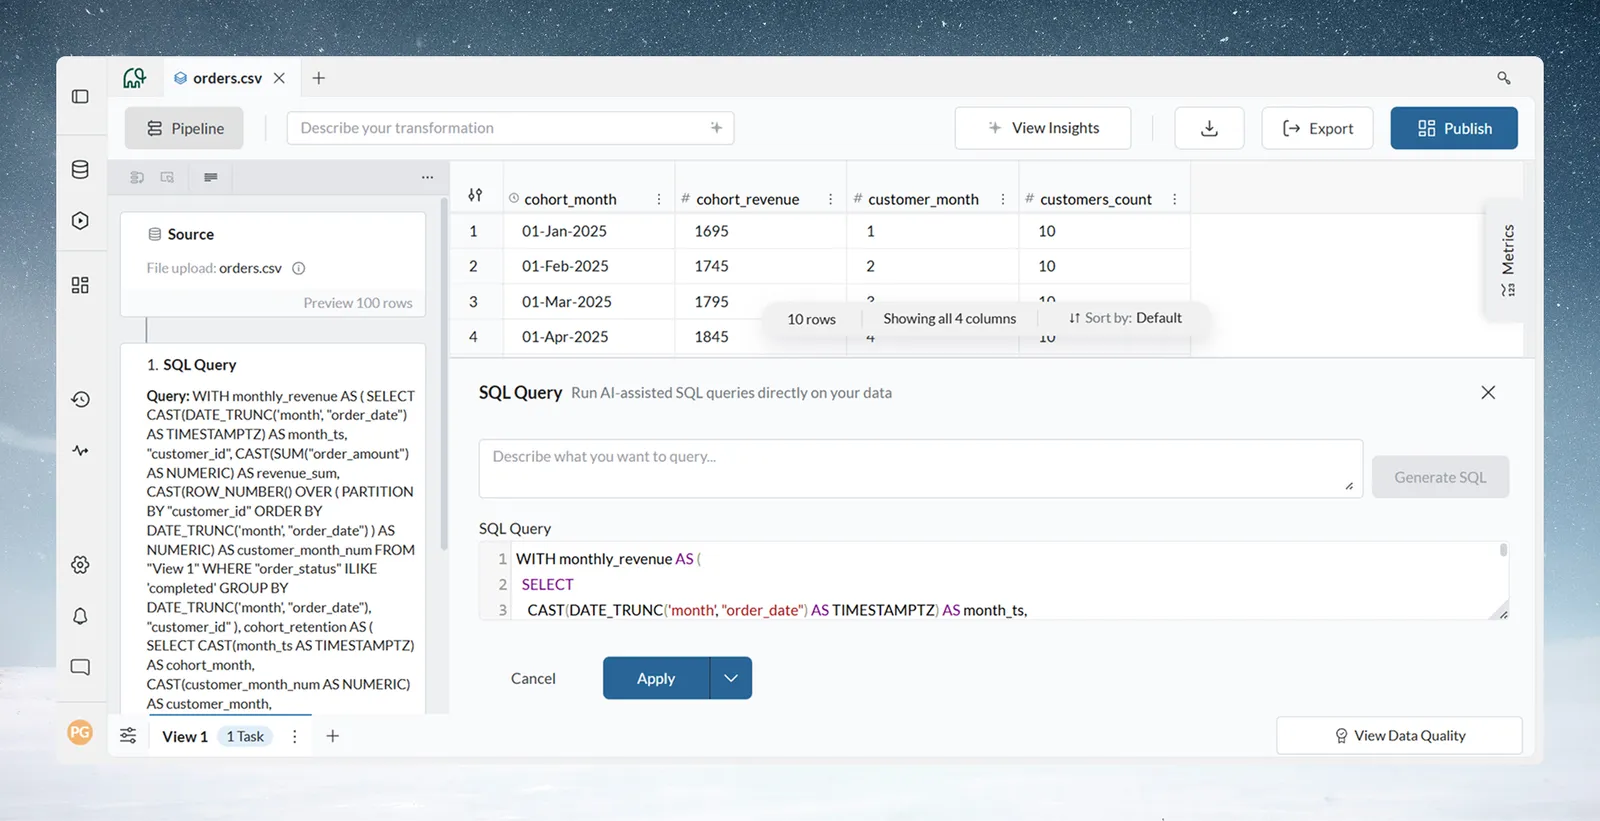
To draft a query with AI, describe it in the prompt box ("Describe what you want to query..."), click Generate, and review it. Mammoth tests it and shows "Understood as:" with how it read your request. A query reads only its own view (here named Orders), so to use another view's columns, add a Join task above it first:
-- Use case: analytical queries beyond the point-and-click functions
SELECT
    "segment",
    DATE_TRUNC('quarter', "order_date") AS quarter,
    COUNT(DISTINCT "customer_id") AS active_customers,
    SUM("revenue") AS total_revenue,
    AVG("order_value") AS avg_order_value,
    MEDIAN("order_value") AS median_order
FROM "Orders"
WHERE "order_status" = 'completed'
GROUP BY 1, 2
HAVING SUM("revenue") > 10000
ORDER BY quarter DESC, total_revenue DESC
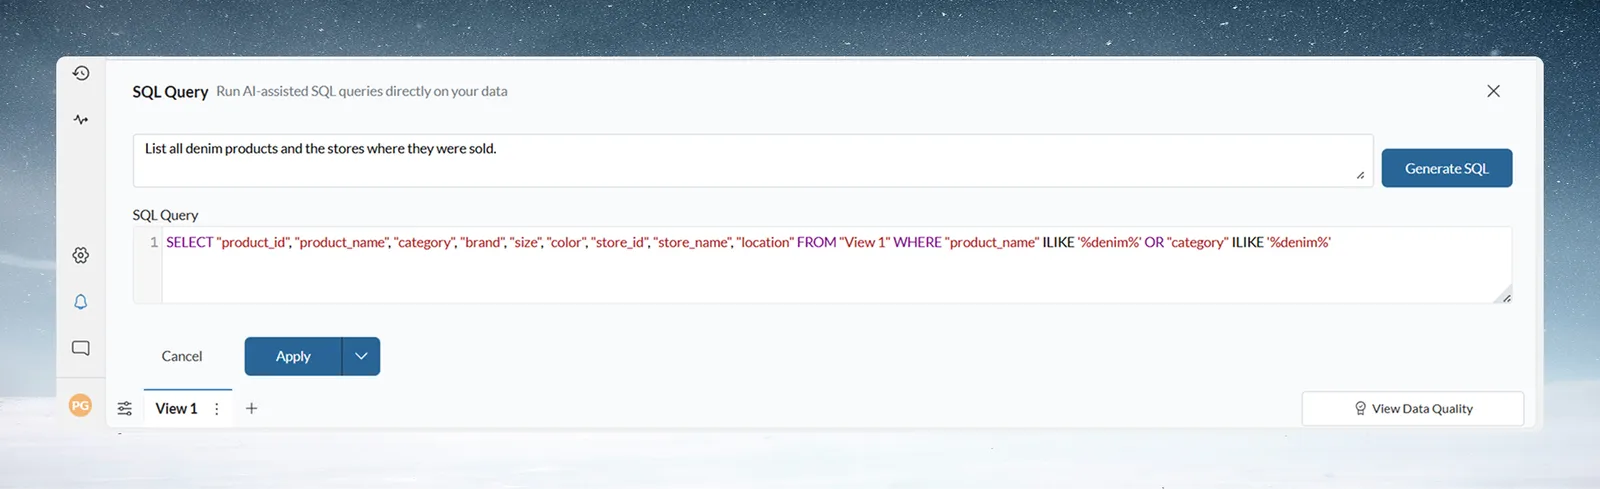
See Write SQL with AI.
Check large dataset handling with 100,000+ rows
- Upload a dataset with 100K+ rows. An upload can be up to 50 MB; see Limits and quotas.
- Build a 5-task pipeline: Conditional Filter, Join, Group & Pivot, Math Function, Show Top/Bottom Rows.
- Run it and check that it executes without errors and the grid stays responsive.
For large datasets, use Draft mode to batch your changes, and filter early to cut the volume later tasks handle.
Build a reusable pipeline template
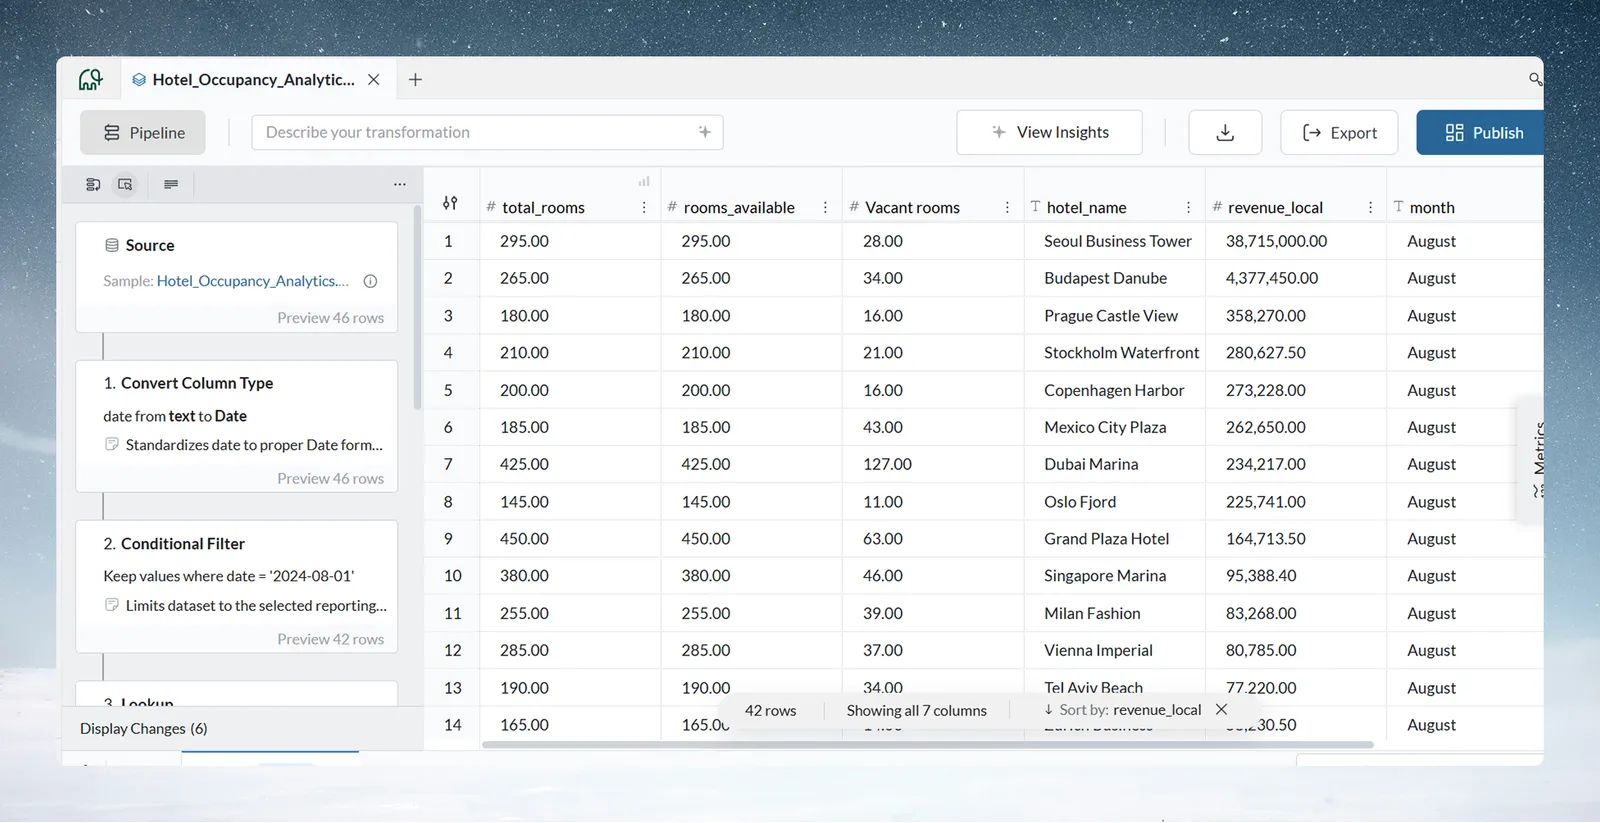
Pick a first person to enable: someone who asks you for help often, is keen to learn, has representative requests, and knows Excel well. Turn one of their recurring requests into a template. For practice, use the Hotel Occupancy Analytics sample file:
- Convert
datefrom text to Date. - Filter to the reporting month (
2024-08-01). - Lookup each hotel's region from a reference view, matched on hotel_id.
- Math Function for a new column
Vacant_rooms:"total_rooms" - "rooms_occupied". - Group & Pivot to summarise the month, for example a count and sums by region.
To order the result, use Sort in a column's menu. Sorting is a display setting of the view, not a pipeline task. Add a note (Add note in a task's menu) to each task saying what it does, why, and when to change it ("change month filter here").
To save it as a template:
- Open More Pipeline options (...) > Pipeline Version history.
- Select the version you want and click Save as template.
- Mammoth downloads the pipeline as a
.mammothfile. Rename it clearly, for examplehotel_occupancy_monthly_performance.mammoth, and keep it where your team can find it.
To reuse it, open the target view in the Data Library, click the gear (View Settings), choose Apply template, and pick the file. Apply template only works on a view with no tasks yet. Save as a template in the same menu saves the current pipeline. You can also use Copy pipeline or Copy tasks in Pipeline Version history to paste tasks into another view.
Then train the person: walk through each task and its business logic, have them change the month filter while you watch, and finally have them run it alone. They succeed when they can run it independently and explain each task.
Rank and total rows with Window Function
Window Function applies ranking, running-total and row-to-row (Lead and Lag) calculations in the pipeline, without SQL. You choose the function (for example Row number, Rank, Dense rank, Sum, Lead or Lag), Group by (the partition), Add Sort (the order) and Place in a new or existing column. It has no frame setting, so a moving average over the last few rows still needs SQL.
-- Ranking within groups: equivalent SQL logic
ROW_NUMBER() OVER (
    PARTITION BY customer_id
    ORDER BY order_date
)
-- Running total (Sum with Type set to Accumulate): equivalent SQL logic
SUM(order_value) OVER (
    PARTITION BY customer_id
    ORDER BY order_date
)
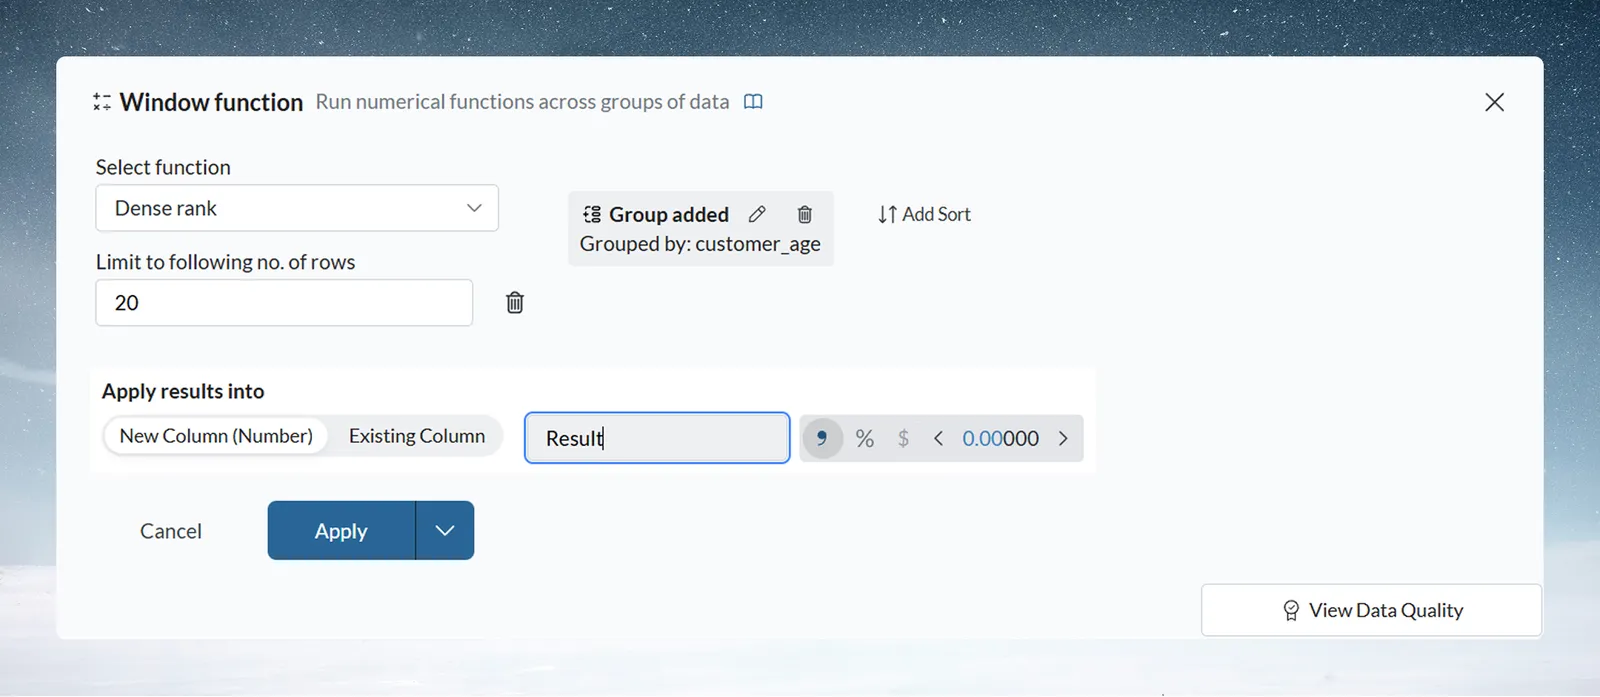
Use Window Function for visible, task-by-task logic others can review; use Ask in plain words for full flexibility. See Add a running total, rank or moving comparison.
Join four or more sources
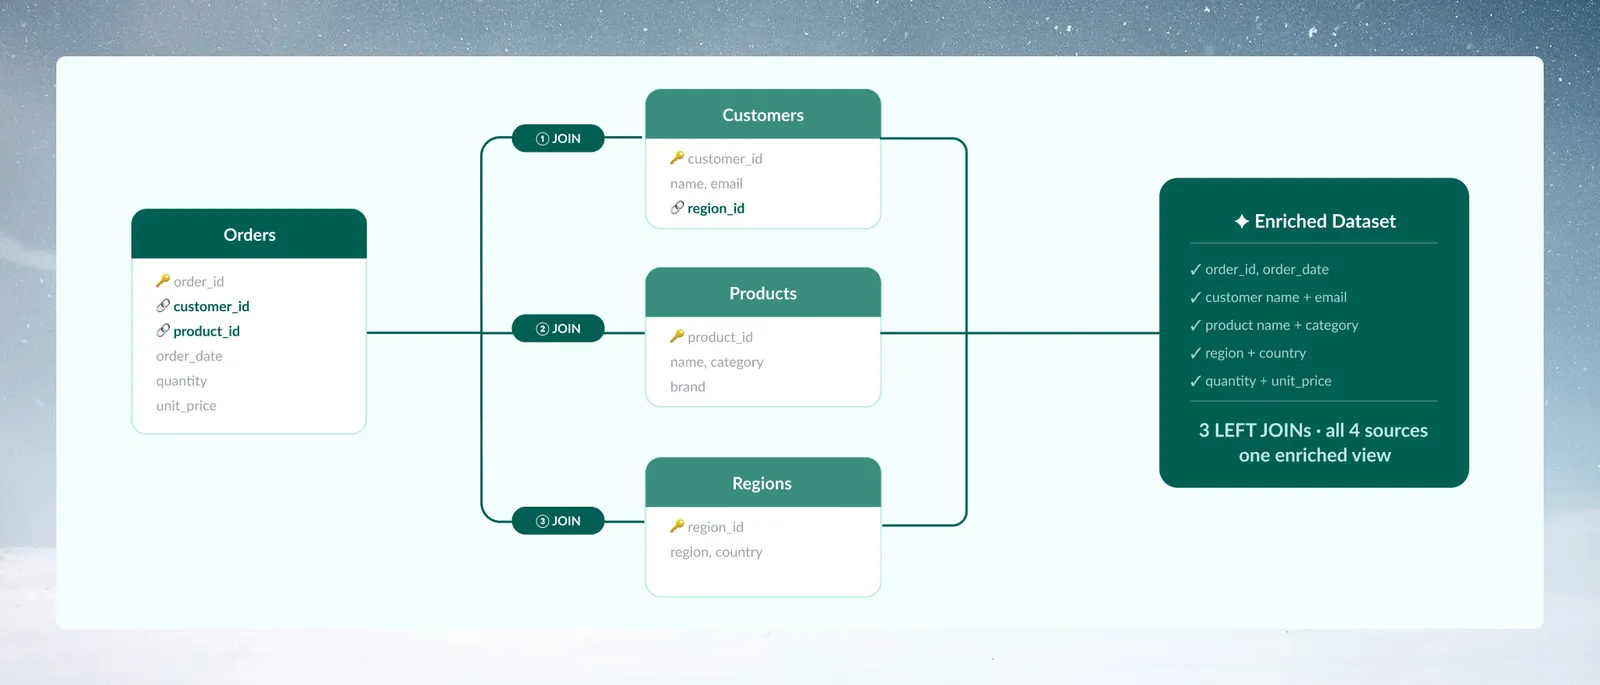
- Join Orders to Customers (left join on customer_id).
- Join the result to Products (left join on product_id).
- Join the result to Regions (left join on customer.region_id).
Each Join reads a view in the same project. Ask in plain words can't join other views itself, so do the joins as Join tasks and use SQL afterwards. See Join two datasets on a shared column.
Run a nightly pipeline end to end
- Create a Dataset Refresh automation on a dataset from a database or app connector (for example PostgreSQL or Salesforce), with a schedule such as every night (Day, Week, Month or Year). Dataset Refresh is a plan feature. See Refresh a dataset.
- Build the pipeline on the dataset's view, for example Conditional Filter, Join, Group & Pivot, Math Function. The tasks run after each refresh.
- Click Export and send the result to PostgreSQL, BigQuery or another destination. An export runs after each data update by default; to also send on a fixed schedule, use a Scheduled Export automation.
- Optionally, a Messaging automation emails the view on a schedule as a CSV attachment, limited to 100,000 rows in total across all attached views.
See Create an automation and Export on a schedule. To run Mammoth from scripts, CI or a coding agent, use the Mammoth CLI or the MCP server. Both work on every plan.
Example templates and scenarios
A retail transactions template (Store_Transactions_Analysis, 10 tasks) on point-of-sale data might filter departments and categories, calculate Total Value from Quantity and Price, standardise categories with Bulk Replace, adjust dates, extract Quarter, normalise text casing, limit scope, label rows by business rules, aggregate with Group & Pivot, and rank with Window Function.
| Scenario | Solution |
|---|---|
| Several regional databases and SaaS tools need one report | A connector dataset per source; a pipeline in each view that standardises columns and ends in Send to Dataset into one master dataset; a nightly Dataset Refresh. Business users build their own views from the master |
| Customer data spread across systems | Join tasks to combine sources, Remove Duplicate Rows for unified records, and a scheduled Dataset Refresh |
In months 2 to 3, build custom workflows for complex business logic, run related Dataset Refreshes In a sequence (see Schedules and triggers), and tune performance for large datasets. In months 4 to 6, document best practices, train new team members, and govern pipelines with project roles plus Data Check and Checkpoint Alert tasks that pause the pipeline for review. See Remove duplicates and check data and Parameters and snippets.
Related
- Write SQL with AI: every Ask in plain words rule and limit.
- Edit, reorder and copy tasks: version history, Save as template and copying tasks.
- Create an automation: schedules for refreshes and exports.
- Parameters and snippets: reuse values and tasks across pipelines.
- Pick your path: the plans for analysts and managers.
Something wrong? support@mammoth.io