Build your first data pipeline in Mammoth, step by step
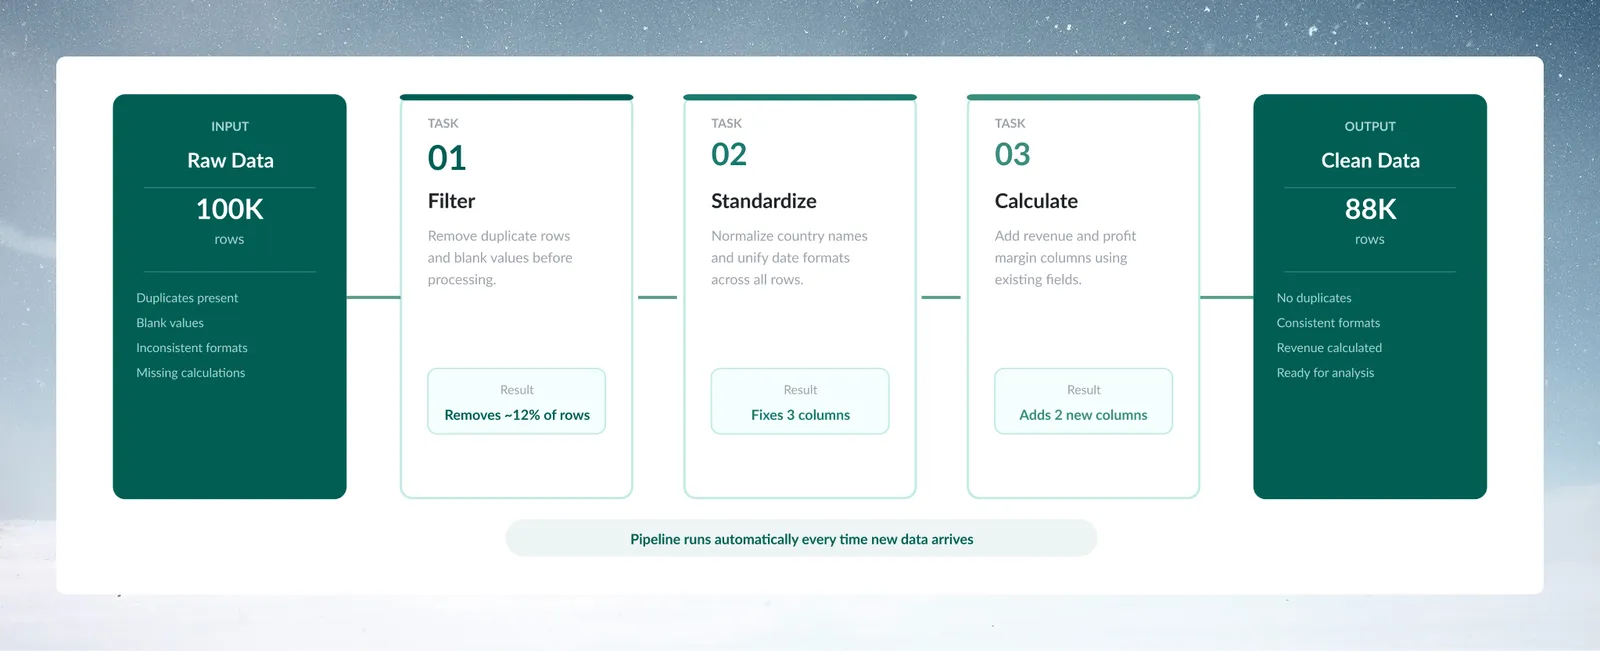
A pipeline is the ordered list of tasks in a view that cleans and reshapes a dataset, and runs again on new data. In this tutorial you load the built-in Multi-Store Retail Sales sample from Data > New dataset > Sample Files, then build a three-task pipeline that filters rows, standardises values and adds a calculated column. You need the Project Admin or Project Editor role; a Project Viewer can't add data or tasks.
Before you start
- A Mammoth account, with the Project Admin or Project Editor role in the project you use. See Members, roles and custom roles.
- The Multi-Store Retail Sales sample file (built in), or your own data.
You learn to load a file, add tasks from the Transform menu, see results as you build, run tasks in sequence, and reuse the pipeline when new data arrives. For a shorter tour that ends with a shared dashboard, see the Quick start.
Step 1: Load the Multi-Store Retail Sales sample data
Use the sample for your first pipeline; the steps below use its column names.
- Click Data in the left sidebar.
- Click New dataset.
- In Where do you want to add data from?, click Sample Files.
- On the Business tab, click the Multi-Store Retail Sales card.
- Click Create new dataset.
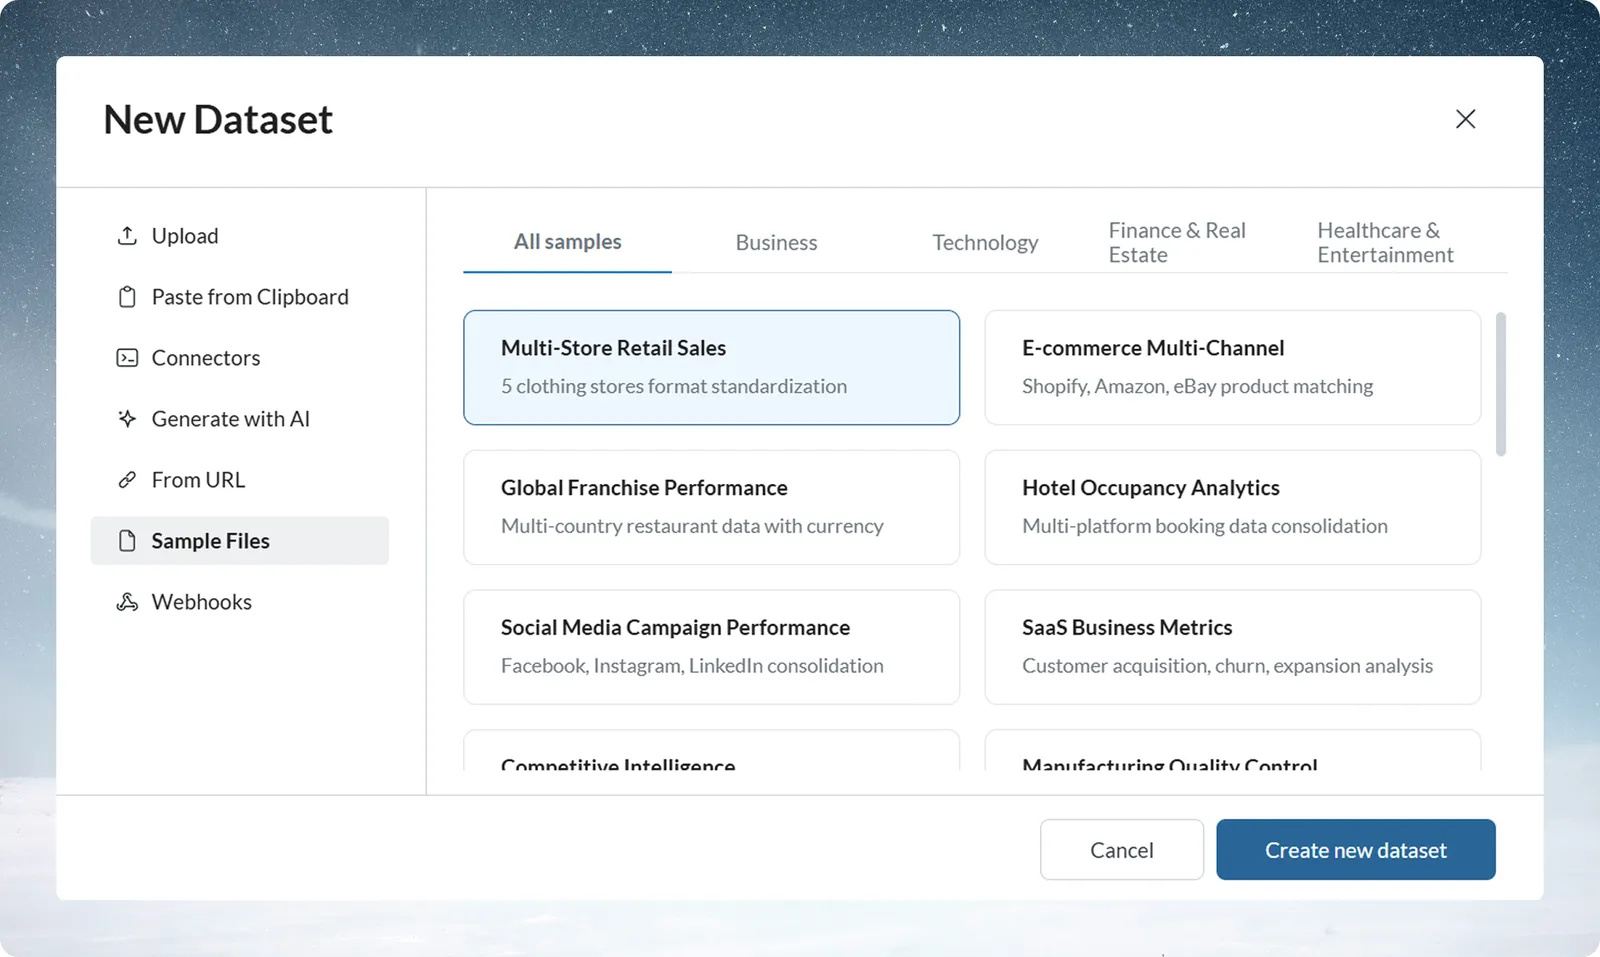
The dataset appears in the Data Library. It has 51 rows of retail sales from five clothing stores. See Create data with AI or a sample file for the other samples.
Upload your own file instead
- Click Data in the left sidebar, then New dataset.
- Choose Upload (the default option).
- Drag your file into the upload area, or click Upload file and pick it.
- Click Submit.
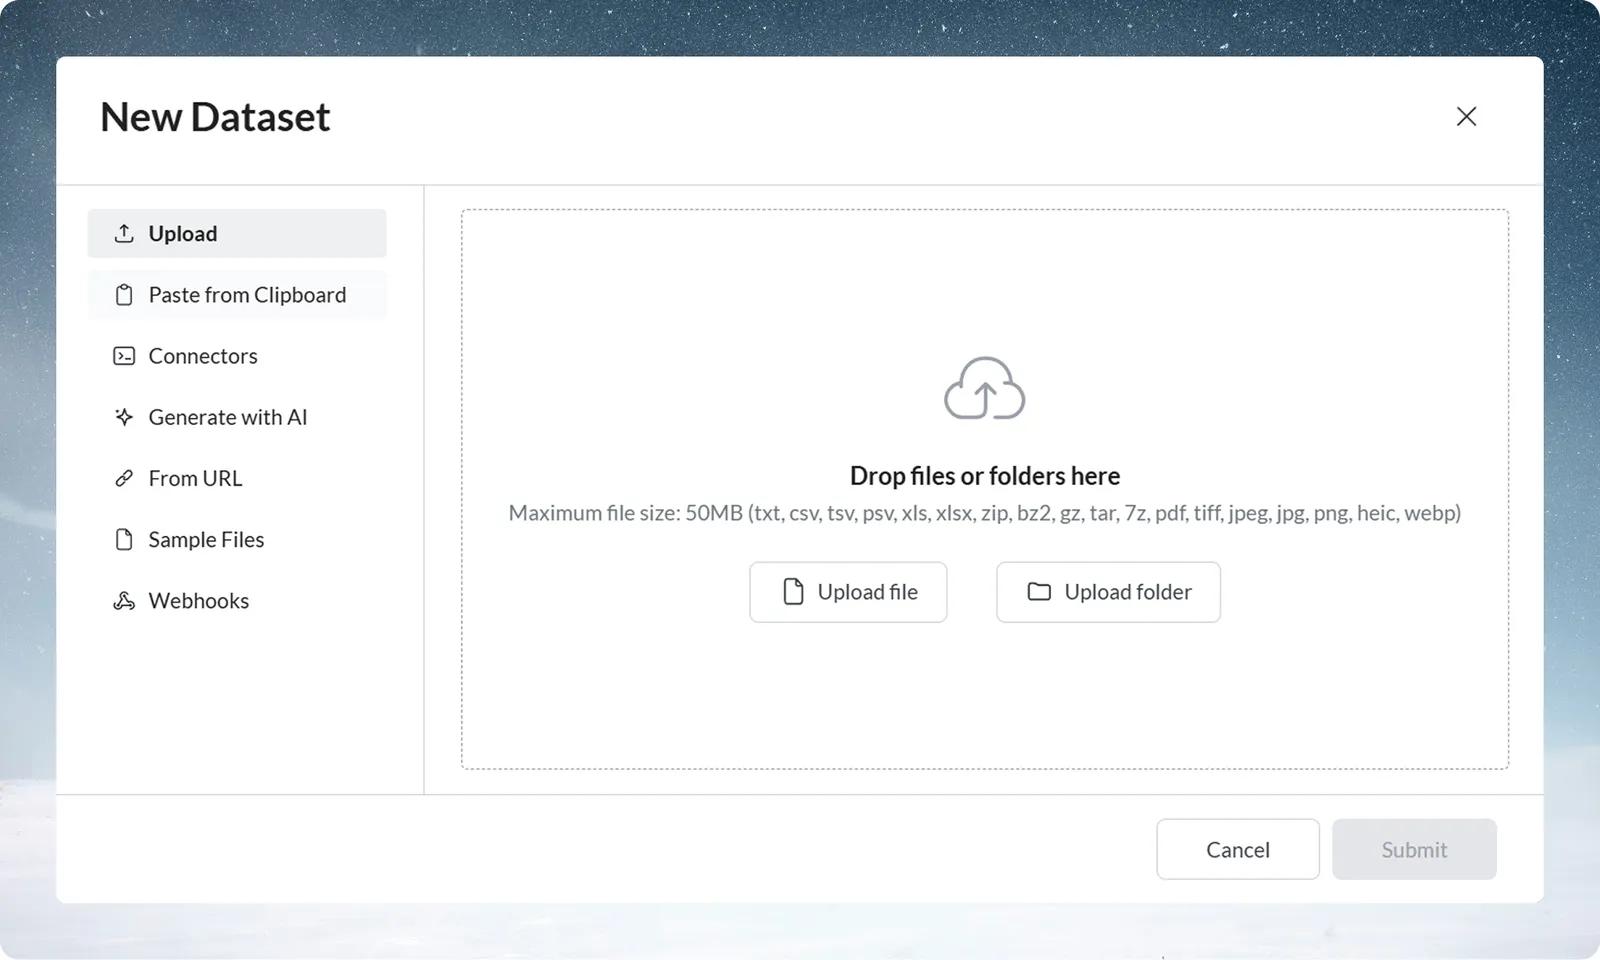
The file appears in the Data Library while Mammoth reads it. If Mammoth needs your input (for example, Choose how to read it or Extract sheets), the dataset says so. See Upload files for those prompts, the supported formats and size limits.
Step 2: Open the dataset in a view
Click the new dataset in the Data Library, then click Explore in its panel. The data opens in a view, where you build the pipeline. The view shows:
- the data grid, showing your data like a spreadsheet;
- the Pipeline panel on the left, whose first card is Source and whose header reads "No tasks";
- the Describe your transformation box and the blue + button (tooltip "Add a task") in the action bar, which both open the Transform menu;
- the Explore panel above the grid. A new view shows No cards yet; click Add card to pick a column. See Explore cards.
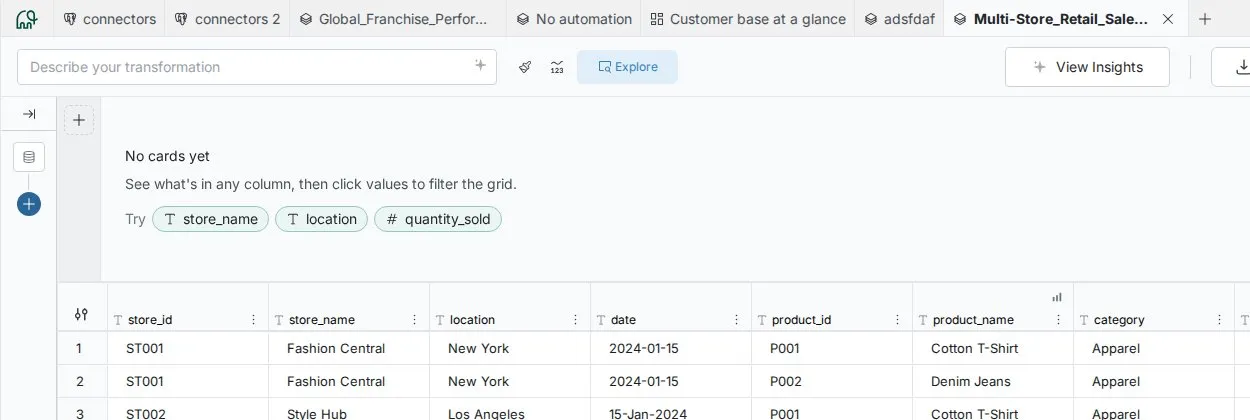
Expected result: the grid shows 51 rows and the Pipeline panel header reads "No tasks".
Step 3: Keep high-revenue orders with a Conditional Filter
This task keeps only the orders with a total revenue over 100.
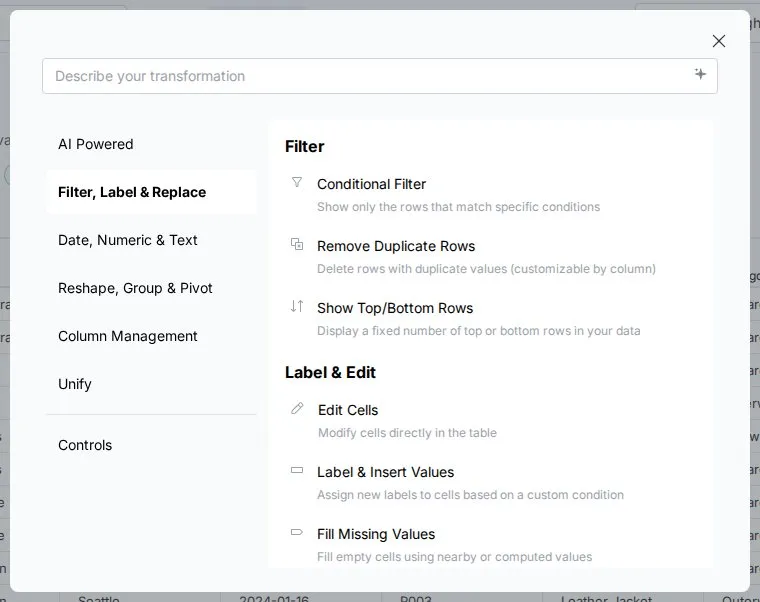
- Click the blue + button (tooltip "Add a task"). The Transform menu opens on AI Powered, with the Describe your transformation search box at the top. The categories on the left are AI Powered, Filter, Label & Replace, Date, Numeric & Text, Reshape, Group & Pivot, Column Management, Unify and Controls.
- Click the Filter, Label & Replace category, or type "filter" in the search box.
- Click Conditional Filter. The panel opens at the bottom of the view, in SQL mode.
- Click Builder. The SQL / Builder toggle sits below the Describe what you want to generate bar.
- Leave Keep selected in front of "values where…". Remove would drop the matching rows instead.
- For Column, select total_revenue.
- For Operator, select is greater than.
- For Value, enter 100.
- Click Apply.
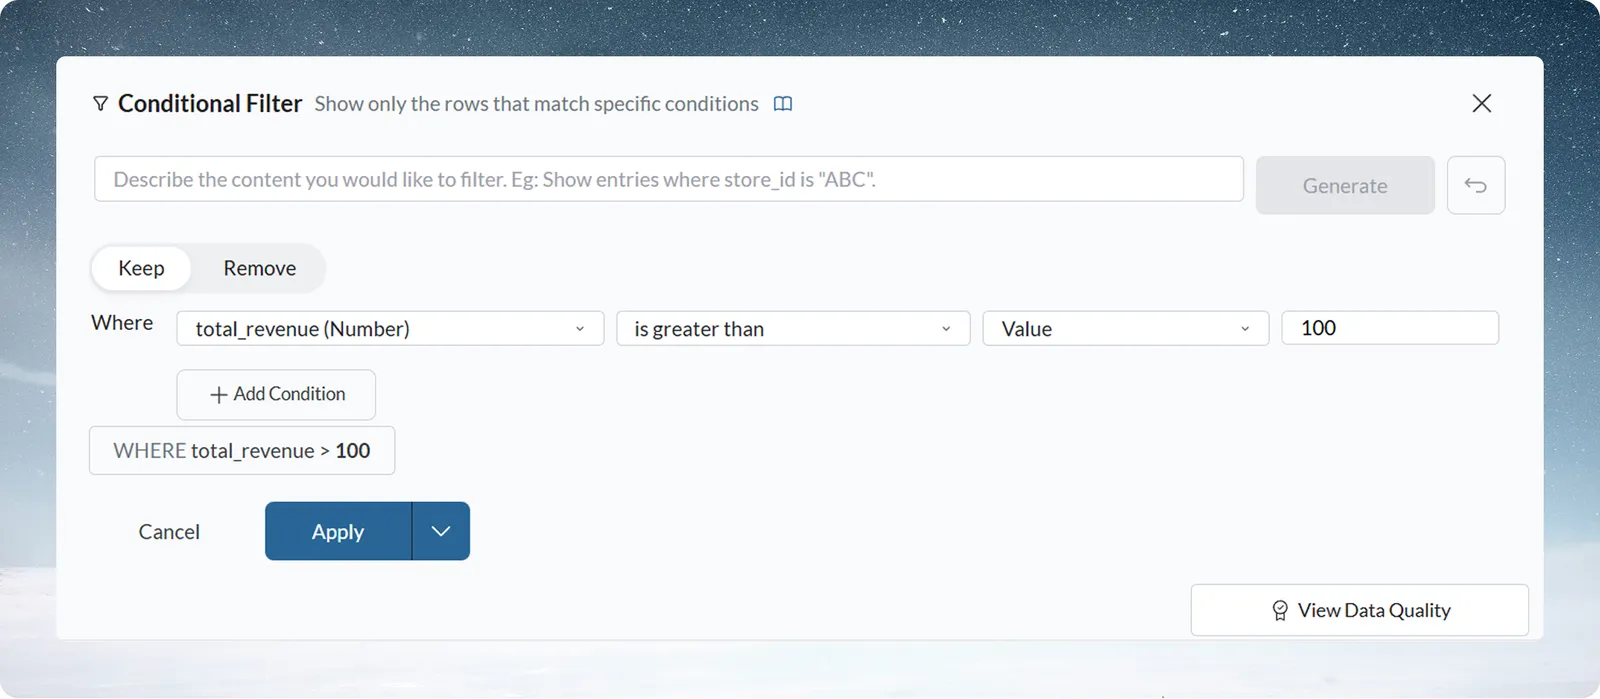
The Condition Summary below the builder restates the rule in words. In SQL mode you could type "total_revenue" > 100 instead, or describe the rule in the Describe what you want to generate bar and click Generate. See Filter rows for every operator.
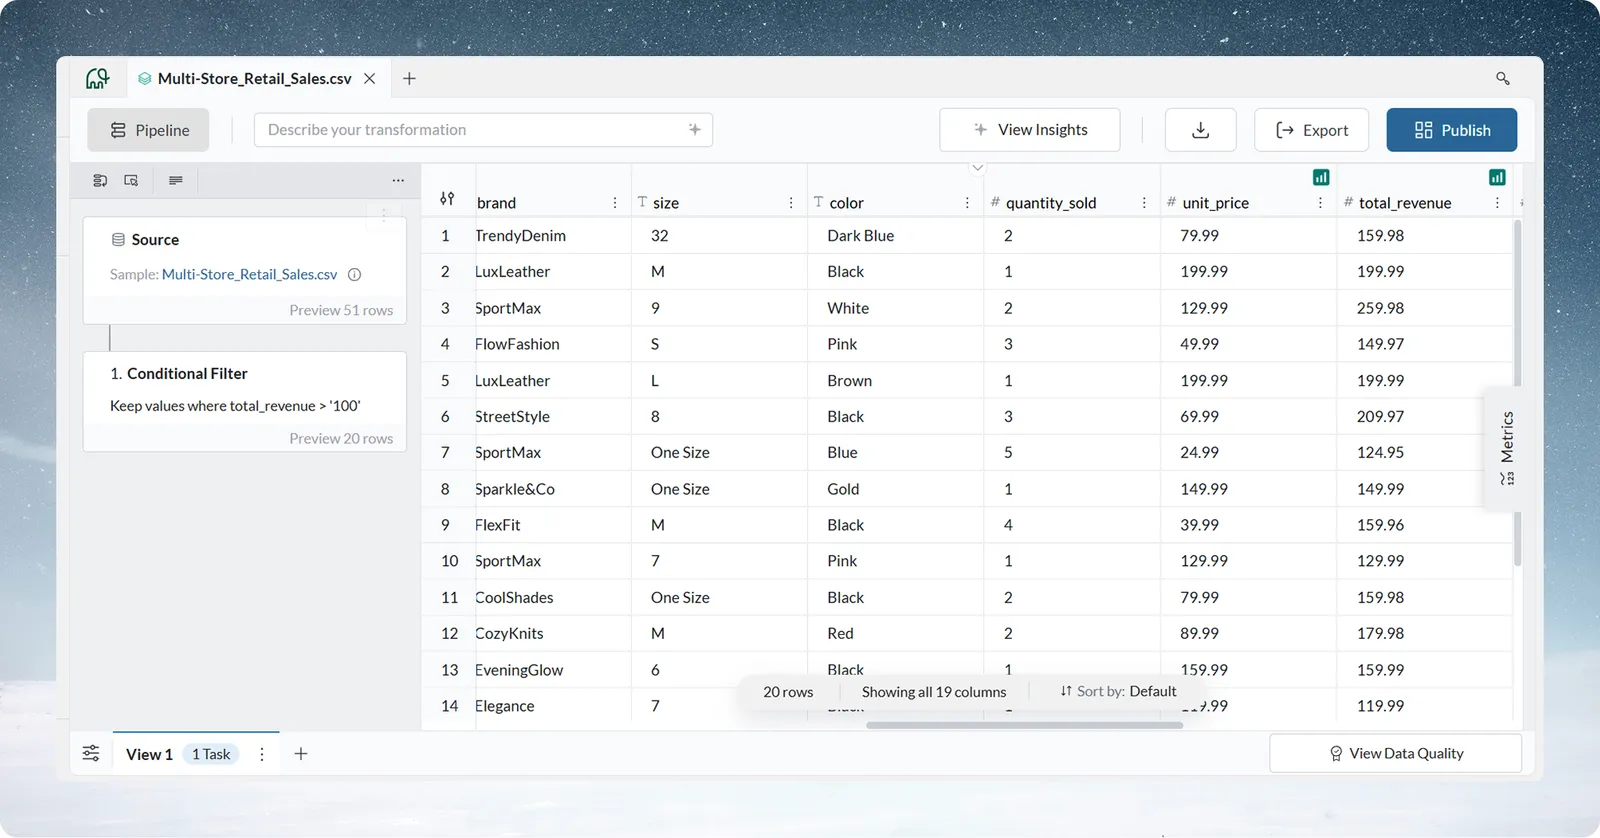
The panel closes, and the Pipeline panel shows a Conditional Filter card under Source. The filter ran straight away, because Draft mode is off by default, and it runs again every time the pipeline runs.
Expected result: the header reads "1 Task", and the card's footer shows "20 rows", all with total_revenue above 100.
Step 4: Standardise product names with Bulk Replace
Bulk Replace replaces groups of variant values in a text column with one standard name per group. Mammoth suggests groups, and you can build your own.
- Click the + button, go to Filter, Label & Replace, and click Bulk Replace.
- Pick product_name as the column.
- Open the Group Suggestions tab.
- In Grouping Settings, choose how suggestions are made (see the table below).
- Click Add suggestion on a suggestion to turn it into a group, or Create all Group Suggestions to add them all.
| Grouping setting | How it groups |
|---|---|
| Smart | Understands meaning and context (AI) |
| Similarity (default) | Groups by calculated similarity |
| Spelling Match | Groups words with similar spelling |
| Common Patterns | Groups common word variations |
The sample's product names are already fairly consistent, so Mammoth may suggest few groups, and a suggestion can join two different products. Only keep groups whose values mean the same thing.
Build a group by hand
To see Bulk Replace change values in the sample, make a group yourself:
- Open the All Values tab.
- Tick Leather Jacket and Blazer.
- Click Add to New Group.
- Click the edit icon beside Group Name and name the group Jackets.
- Click Next. A summary lists each group and its values.
- Leave Place in set to the existing column.
- Click Apply.
To take a group out of the replacement before you apply, click its trash icon (Remove Group). Every value in a group is replaced with the group's name; values in no group stay as they are. See Find and replace values for moving values between groups and for rules that catch new variants.
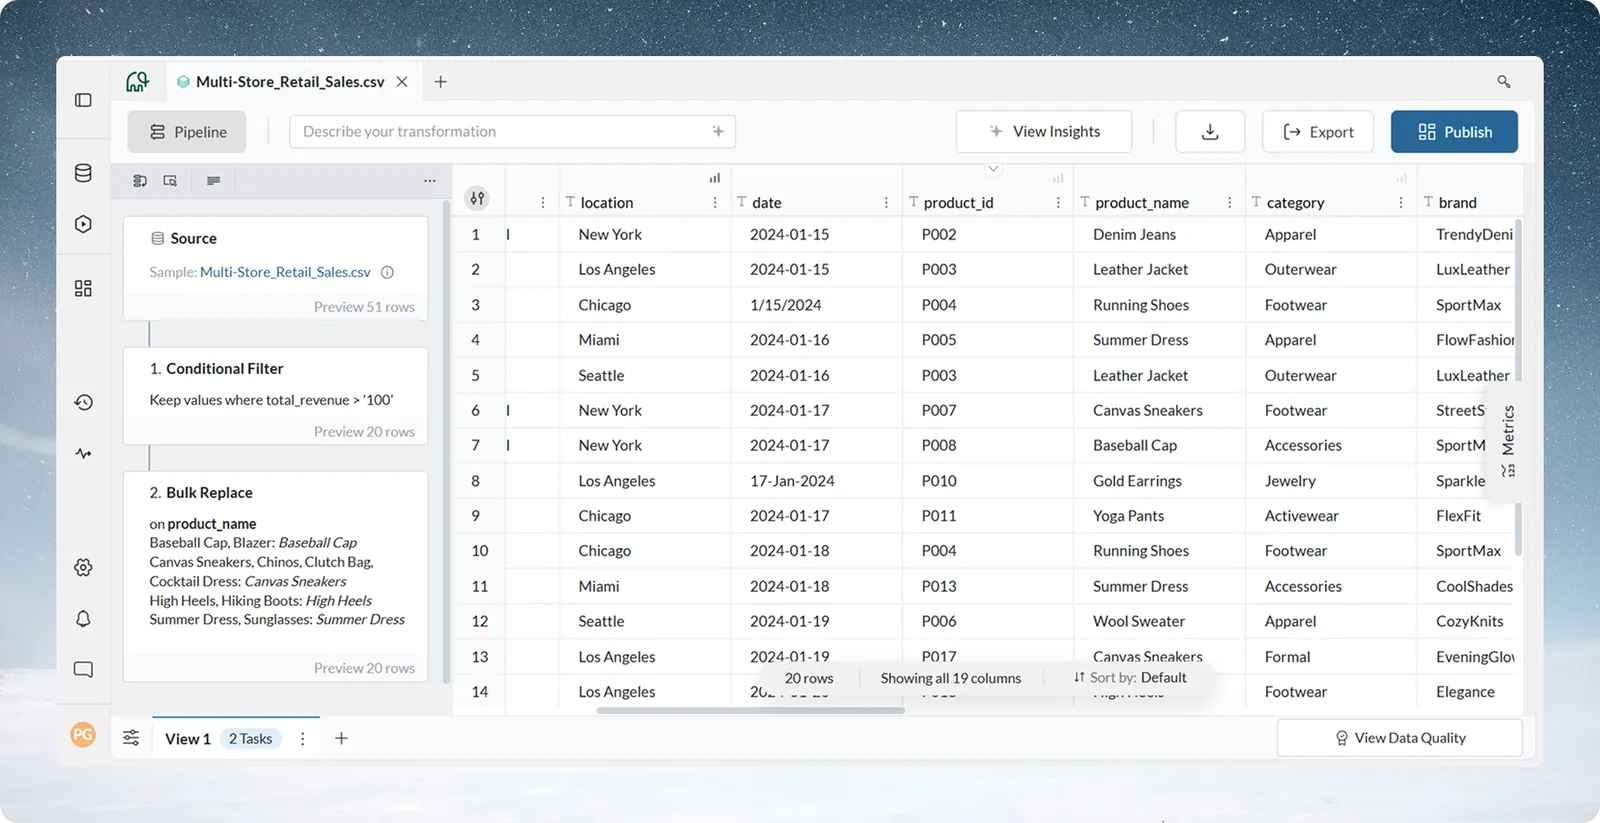
Expected result: the header reads "2 Tasks", and product_name shows Jackets where it showed Leather Jacket or Blazer.
Step 5: Add a Gross_Sale column with Math Function
This task creates a new column of gross sales from quantity and unit price.
- Click the + button.
- Go to the Date, Numeric & Text category and click Math Function. It opens in SQL mode.
- In the SQL Expression editor, type
"quantity_sold" * "unit_price". You can also describe the calculation in the Describe what you want to generate bar and click Generate. - Under Place in, choose New Column and enter Gross_Sale as the name.
- Check the result in the preview window above the panel.
- Click Apply.
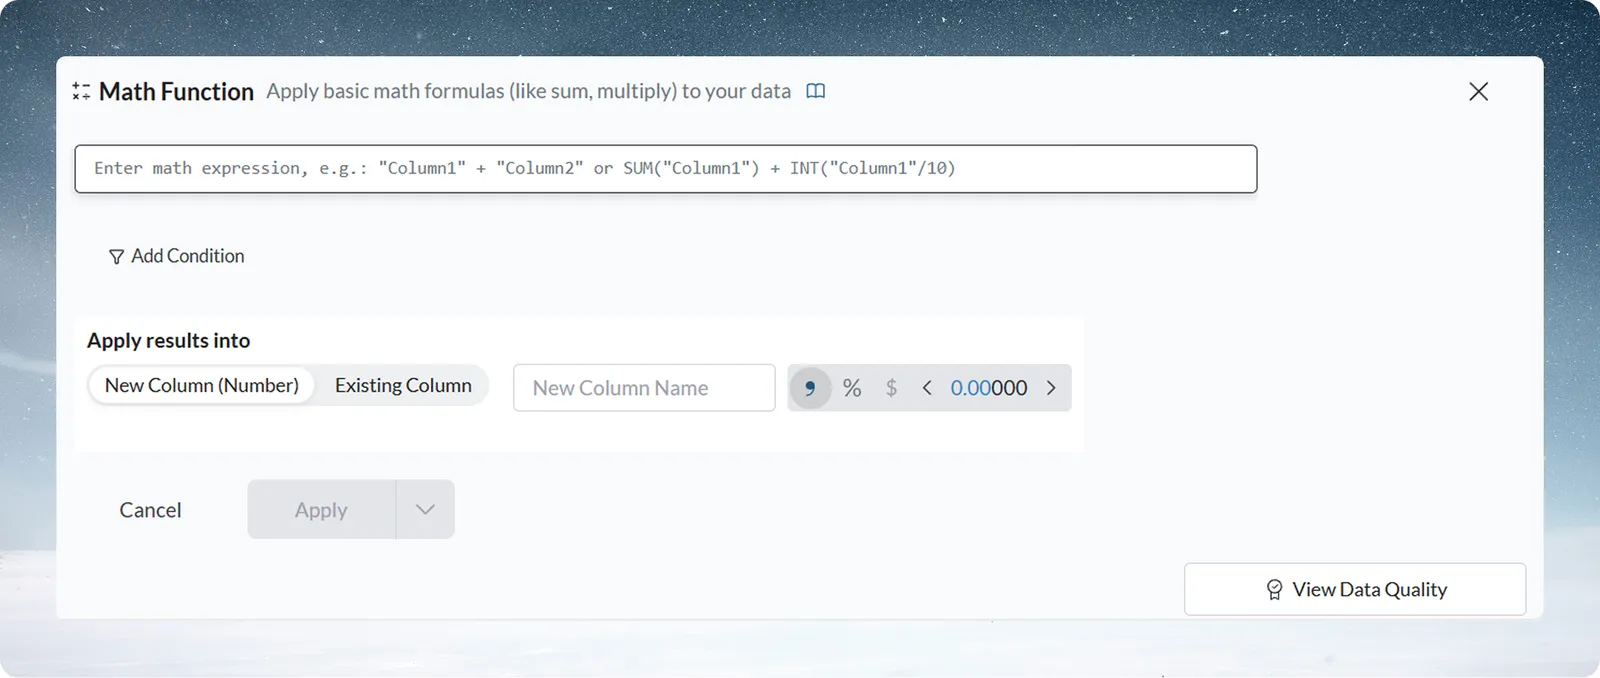
To write the formula in Formula mode instead, see Calculate with formulas.
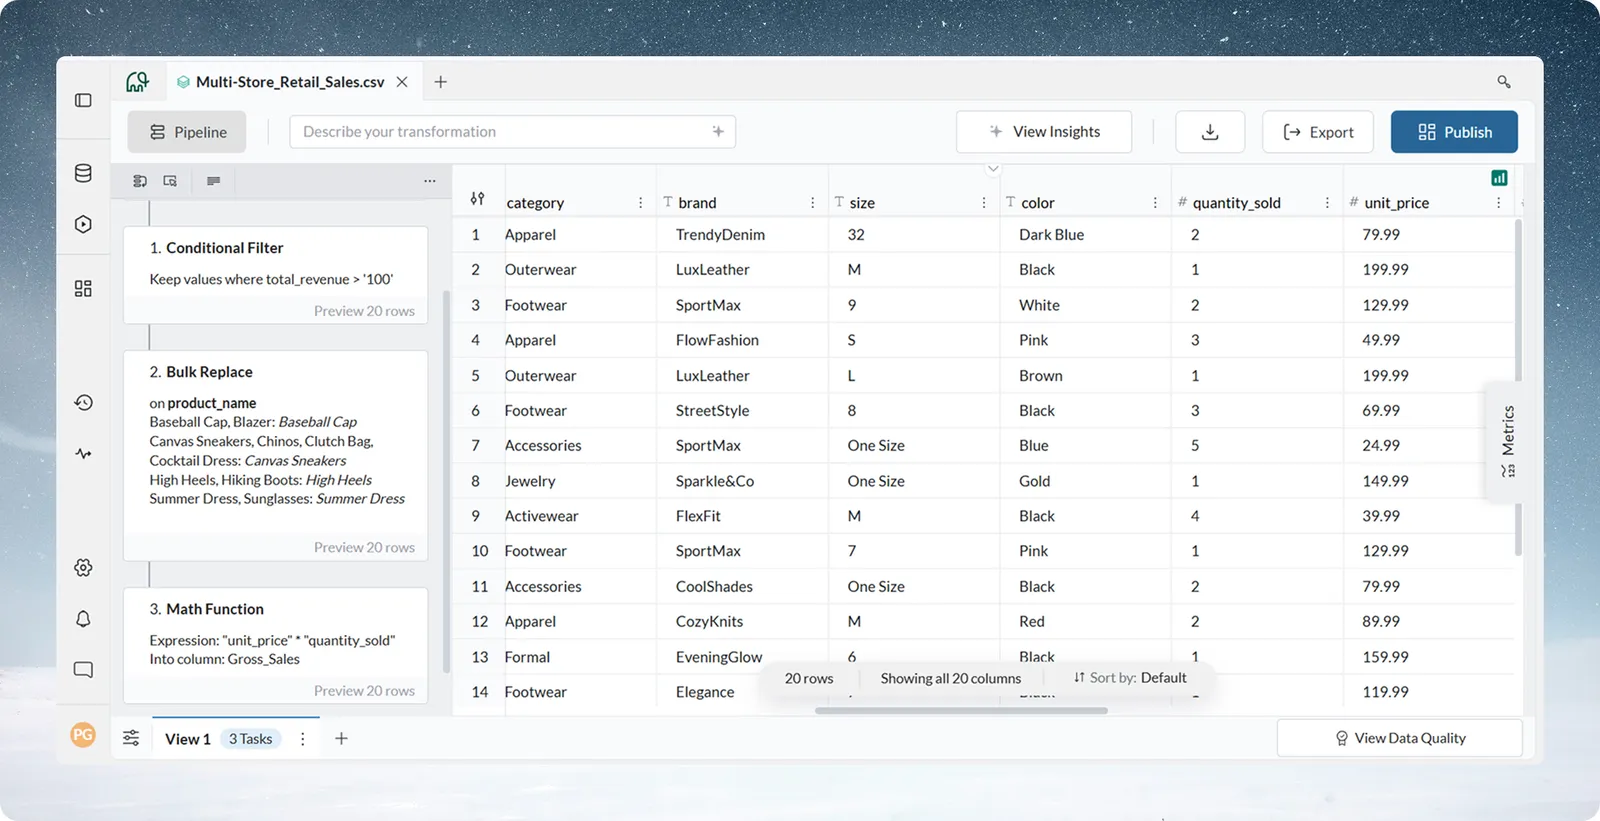
Expected result: the header reads "3 Tasks", and scrolling right in the grid shows the new Gross_Sale column with a value on every row.
How the three tasks run in order
3 Tasks                                ← Pipeline panel header
Source                                 ← Your original data
├── 1. Conditional Filter              ← Runs first
│   Keep rows where total_revenue > 100
│
├── 2. Bulk Replace                    ← Runs second
│   product_name: Jackets group
│
└── 3. Math Function                   ← Runs last
    New column Gross_Sale
When the pipeline runs, Mammoth starts with your original data and applies task 1. It passes the result to task 2, then to task 3, which produces the final output. Each task works on the output of the task above it, like a recipe where each step builds on the last.
Suspend, copy, rename or delete a task
Hover over any task card to see its options.
| Option | What it does |
|---|---|
| Add note | Attaches a note explaining the task |
| Suspend (pause icon) | Turns the task off without deleting it; Restore turns it back on |
| Copy | Copies the task so you can paste it elsewhere |
| Edit (pencil icon) | Reopens the task's panel |
| More options (...) | Rename, Duplicate, Paste below and Delete |
The row count in a card's footer (tooltip "Preview Data at this Task") shows the data as it was right after that task. See Edit, reorder and copy tasks.
Reorder tasks in the pipeline
- Drag a task card up or down by its drag handle. A bar at the bottom of the panel warns "Reordering tasks may affect your data."
- Click Reorder Tasks to save the new order, or Cancel to put it back.
Mammoth checks dependencies before it saves. If task B uses a column that task A creates, moving B above A shows a warning. When the reorder works, "Tasks reordered successfully" confirms it.
Check the results before and after the pipeline
| Before | After | |
|---|---|---|
| Rows | 51, with all revenue values | 20, all with total_revenue over 100 |
| Product names | Leather Jacket and Blazer separate | Both replaced with Jackets |
| Gross_Sale | No column | A value on every row |
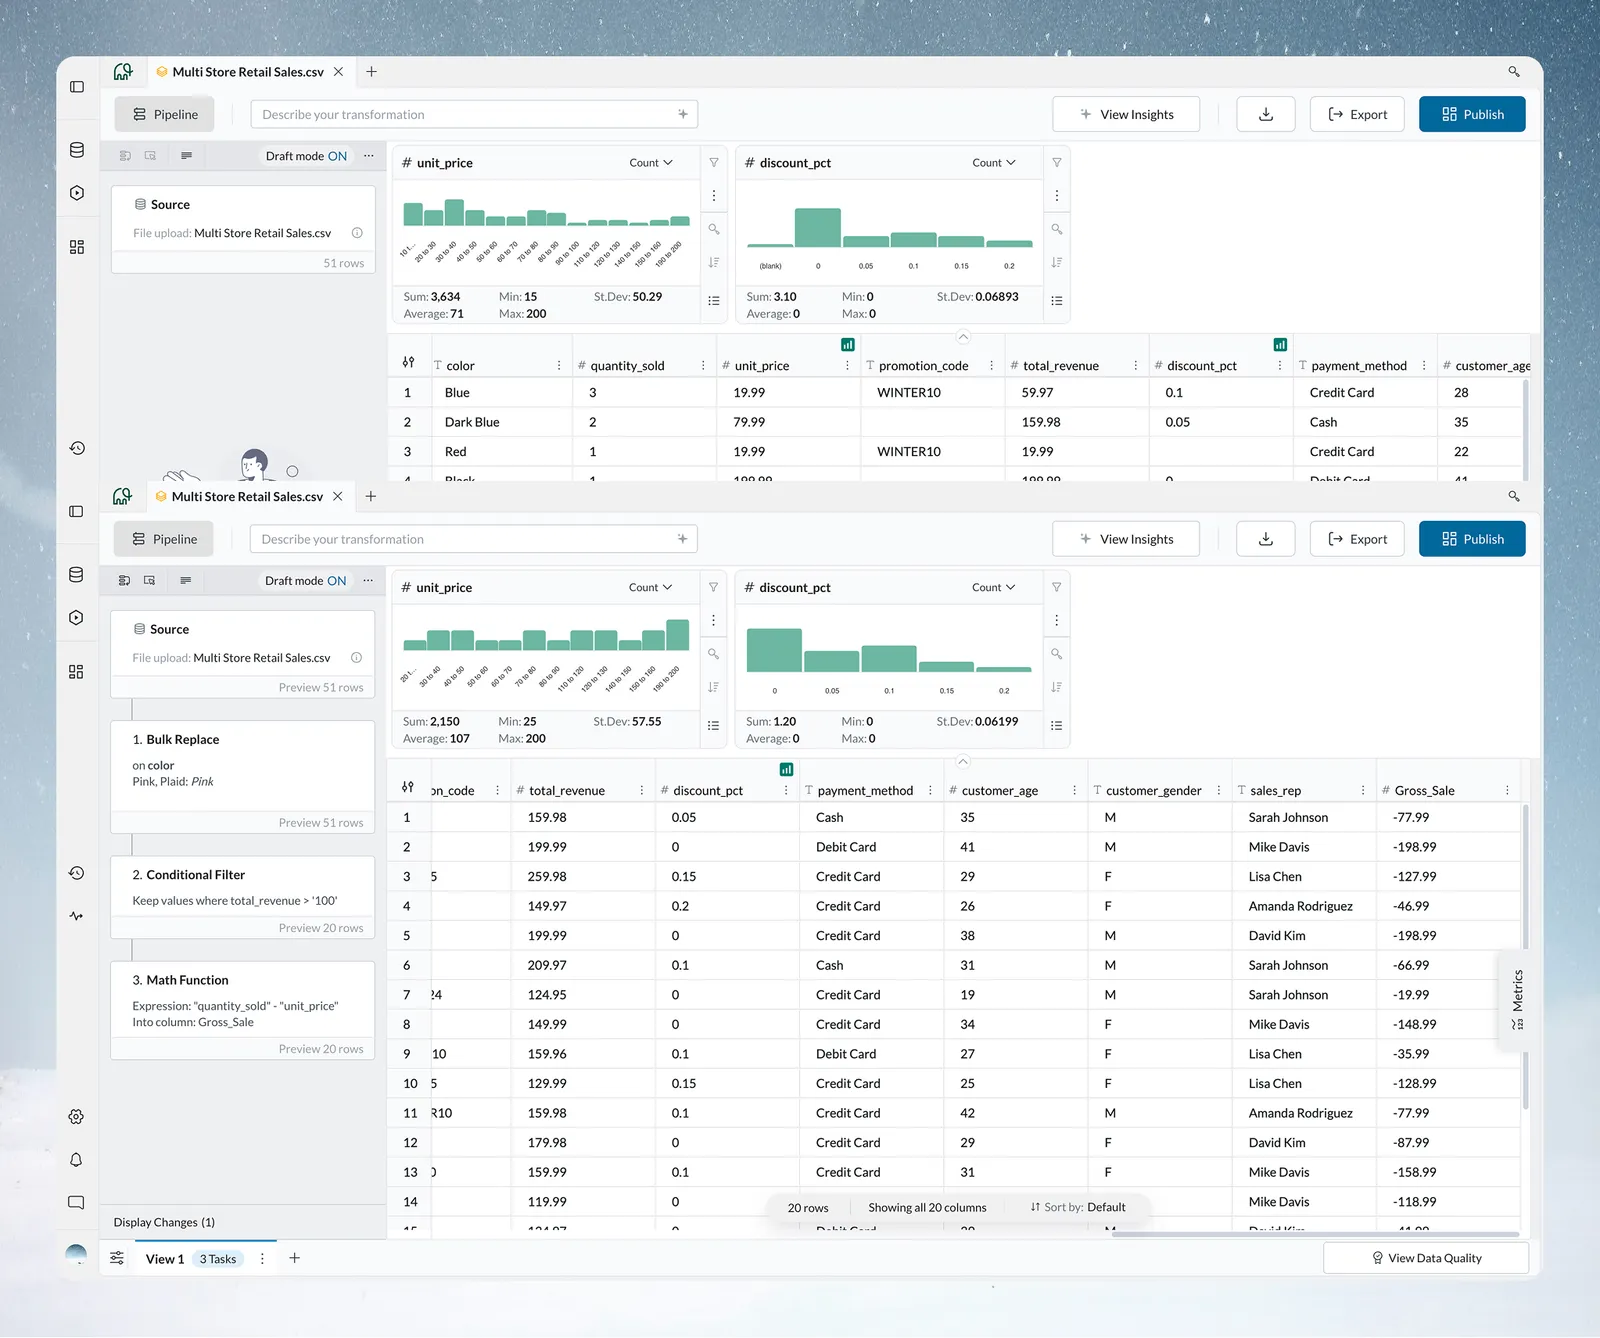
The screenshot compares the source data (51 rows) with the transformed data (20 rows, and 20 columns including Gross_Sale).
Preview the data at one task
- Hover the row count in a task card's footer (tooltip "Preview Data at this Task") and click it.
- A banner reads "Previewing Data at Task 1..." (with that task's number), and the grid shows the data right after that task.
- Click Exit Preview [Esc] or press Esc to go back.
Checking each task in turn shows where an issue starts. To see single numbers, such as the sum of Gross_Sale, open the Metrics panel. See Metrics.
Save and reuse the pipeline
Every task you add is saved to this view straight away. There is no separate save button:
- The pipeline stays in this view when you close the browser.
- Everyone with access to the project sees the same pipeline.
- Earlier versions are kept in Pipeline Version history (in the More Pipeline options (...) menu). How many you can see depends on your plan.
What you can do next with it:
| Goal | How |
|---|---|
| Run it on new data | Add next month's file to this dataset and the pipeline runs on it. See Add or replace data. |
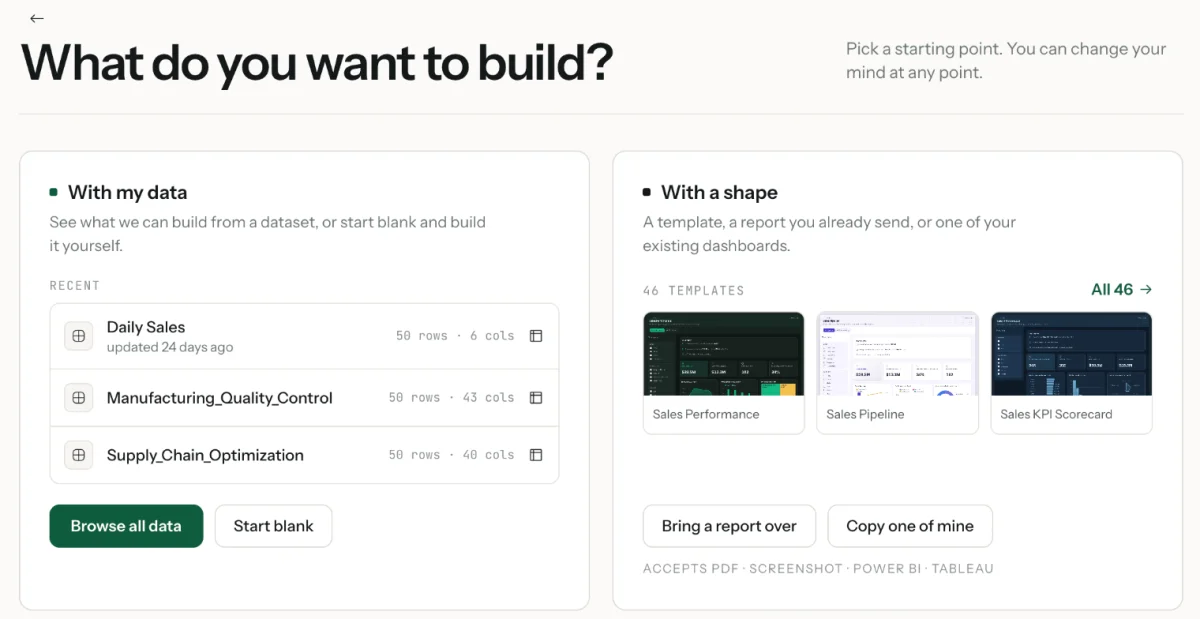
| Build a dashboard | Click Dashboards in the left sidebar, then Create. On What do you want to build?, choose your view under With my data, pick a format, then build a suggested idea or describe what you want. See Create a dashboard. |
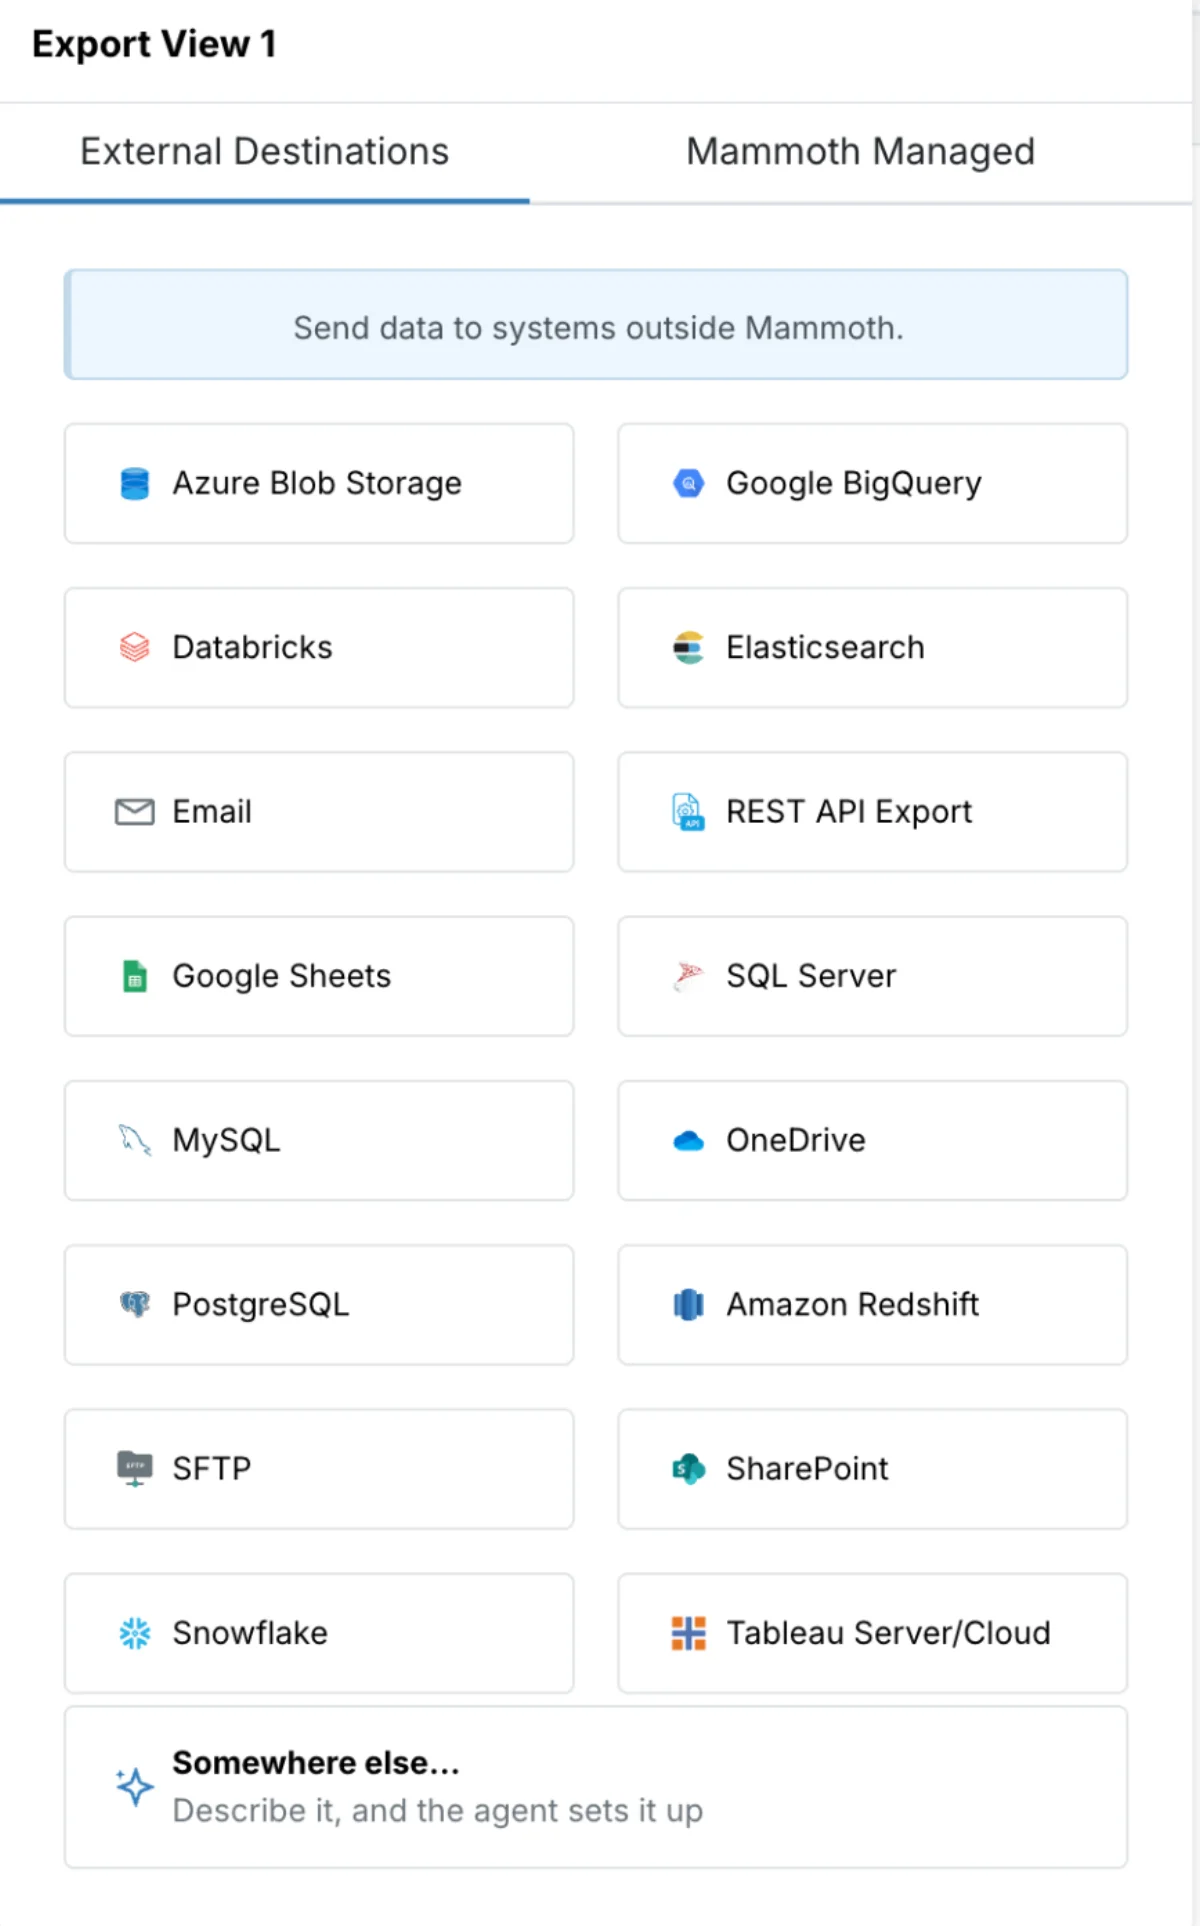
| Export after every run | Click Export in the action bar and choose a destination on External Destinations (a database, warehouse, file store or app) or Mammoth Managed (Send to Dataset, Live link on Team and Pro, or a managed database). See Send data to a database or BI tool. |
| Save a one-time file | Use the download icon beside Export (CSV, Excel, JSON and more). See Download data. |
| Refresh on a schedule | For data from a connector, a Dataset Refresh automation fetches new data on a schedule, and the pipeline runs on each refresh. See Refresh a dataset. |
To let AI write a task, describe what you want in the Describe what you want to generate bar of Conditional Filter or Math Function, or use Ask in plain words for a whole query. See Write SQL with AI.
The five transformations to learn first
- Conditional Filter: keep or remove rows that match a rule.
- Bulk Replace: standardise text values that have variations.
- Convert Column Type: fix data types (text to number, text to date).
- Remove Duplicate Rows: remove repeated records.
- Math Function: calculate new values from existing columns.
Pipeline best practices for beginners
- Start with filters. Remove rows you don't need early. Smaller data makes later tasks faster.
- Use Draft mode for longer builds. If you're adding five or more tasks, or working on a large dataset, turn on Draft mode, build the pipeline, then run every task at once with Apply now.
- Add notes to tasks. Use Add note to record business logic, formulas or decisions. Turn on Display notes in Cards Density to show them on the cards.
- Test with small data first. Build and test on a small sample file, then apply the pipeline to the full dataset.
Troubleshooting your first pipeline
| Symptom | Cause | Fix |
|---|---|---|
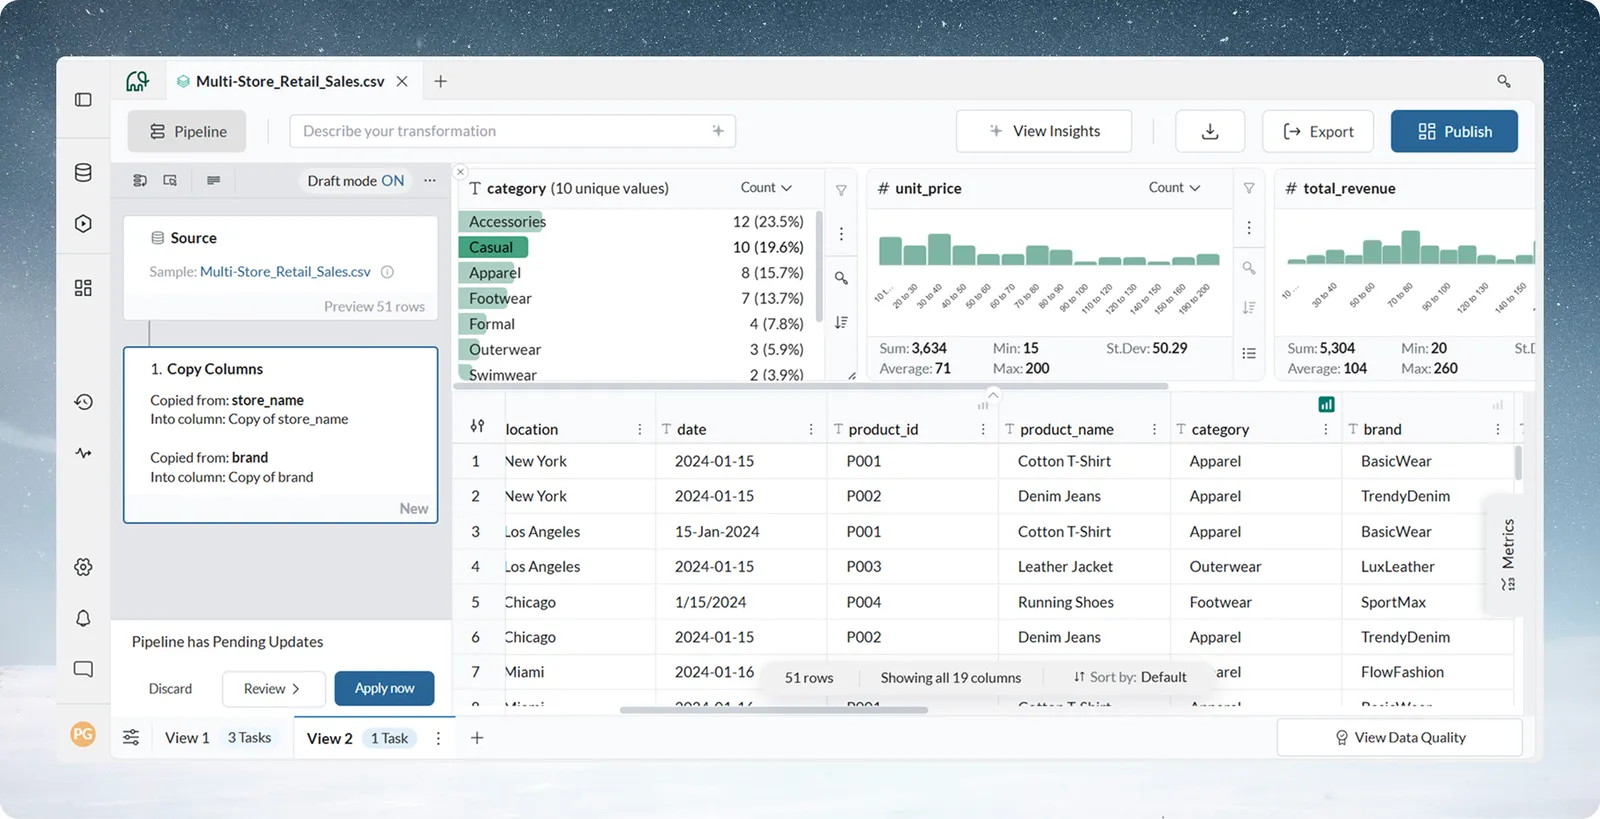
| You added a task, but the data didn't change | Draft mode is on. The header shows Draft mode ON, new tasks are marked New, and a bar reads "Pipeline has Pending Updates" | Click Apply now in that bar. Tasks don't run until you do |
| A column doesn't appear in a task's column list | A task only sees the columns that exist at its position | Reorder the tasks so the one that creates the column comes first, or insert the task further down with the + button between cards |
| Results don't match what you expected | One task in the chain is wrong | Click the row count in the footer of the first task card, check the grid, then move to the next task until you find where the data went wrong. Edit that task |
| You want to undo a task | The task is applied | Hover the card, click More options (...) > Delete. Mammoth warns you first if later tasks depend on it, then runs the pipeline again. Suspend it instead to keep its settings, or restore an earlier version from Pipeline Version history |
| You're not sure how to set up a task | A setting's meaning isn't clear | Click the book icon (tooltip "Learn more") in the task panel's header to open that function's documentation. Watch the preview above the panel, for example "120 rows removed". In Conditional Filter, Math Function and Ask in plain words, describe what you want in plain words |
Related
- How the pipeline works: how tasks run, task previews and Draft mode.
- Edit, reorder and copy tasks: version history and copying tasks between views.
- Core ideas: datasets, batches, views, pipelines and tasks in one picture.
- Fix a failing step: what to do when a task shows an error.
- What you can automate: run refreshes, exports and emails on a schedule.
- Pick your path: what to learn next for your role.
Something wrong? support@mammoth.io