Load a built-in sample dataset
Mammoth comes with sample datasets you can load in a few clicks: in your project, click New dataset and select Sample Files. They need no preparation, hold no sensitive data, and give a team identical data to practise on or demo with. To describe your own test data instead, see Create test data with AI.
Load a sample dataset
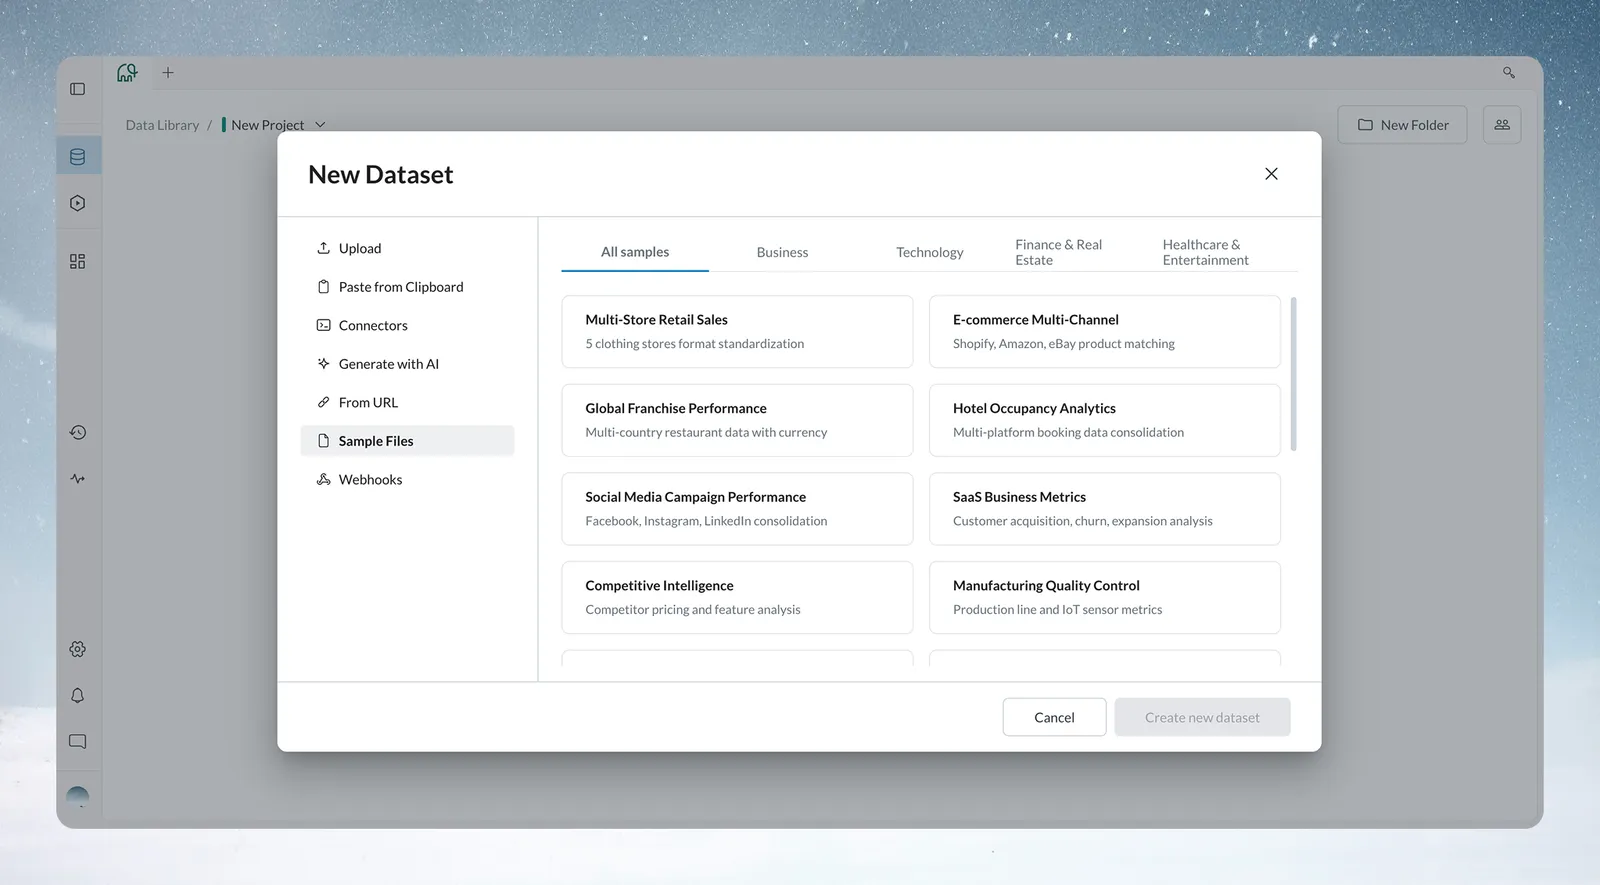
- Click New dataset in your project.
- Select Sample Files.
- Choose the All samples tab, or one of the Business, Technology, Finance & Real Estate, or Healthcare & Entertainment tabs, and read the descriptions.
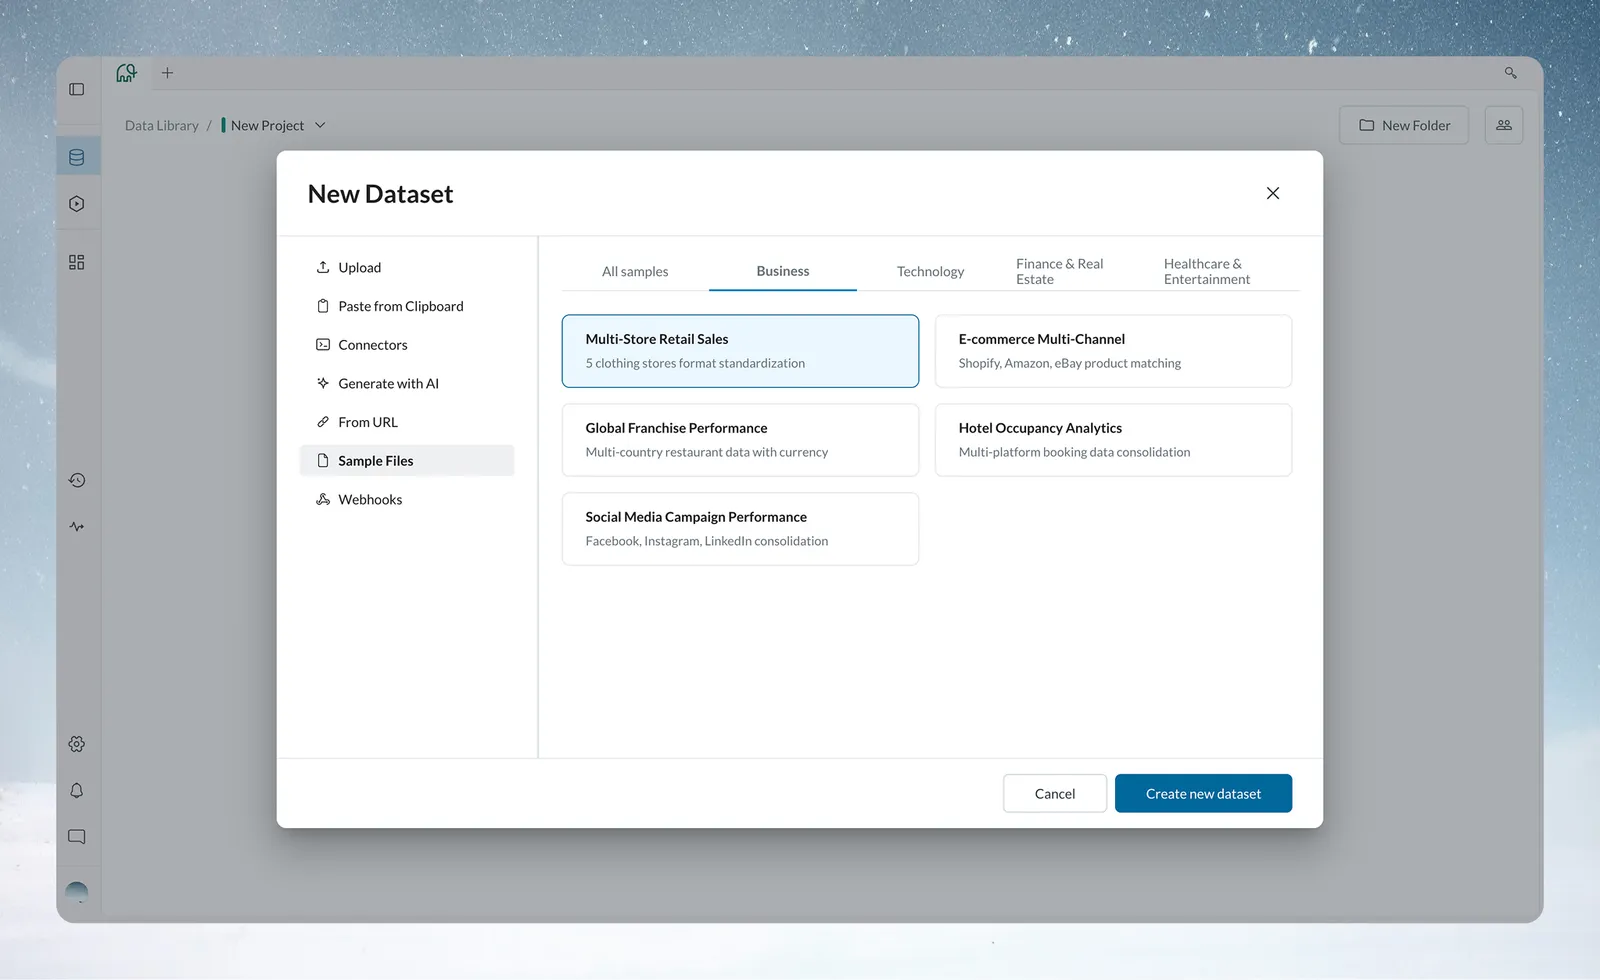
- Click the card of the dataset you want. The card is highlighted; there is no data preview.
- Click Create new dataset. The dataset appears in the project, ready to explore.
Sample files need no preparation, hold no sensitive data, and give a team identical data to practise on. They are also useful for demos with familiar patterns.
Sample datasets you can load
Each sample is a CSV file of 25 to 63 rows, so it loads quickly and is easy to inspect.
Business samples
| Dataset | Description |
|---|---|
| Multi-Store Retail Sales | 5 clothing stores format standardization |
| E-commerce Multi-Channel | Shopify, Amazon, eBay product matching |
| Global Franchise Performance | Multi-country restaurant data with currency |
| Hotel Occupancy Analytics | Multi-platform booking data consolidation |
| Social Media Campaign Performance | Facebook, Instagram, LinkedIn consolidation |
Technology samples
| Dataset | Description |
|---|---|
| SaaS Business Metrics | Customer acquisition, churn, expansion analysis |
| Competitive Intelligence | Competitor pricing and feature analysis |
| Manufacturing Quality Control | Production line and IoT sensor metrics |
| Supply Chain Optimization | Global vendor performance and delivery |
| Media & Entertainment ROI | Cross-platform content performance |
Finance & Real Estate samples
| Dataset | Description |
|---|---|
| Financial P&L Consolidation | Multi-subsidiary revenue with currency conversion |
| Credit Risk Assessment | Multi-bureau loan data risk scoring |
| Real Estate Portfolio Analytics | Multi-market property performance and occupancy |
| Construction Project Tracking | Multi-site timelines, costs, resources |
Healthcare & Entertainment samples
| Dataset | Description |
|---|---|
| Patient Outcome Tracking | Clinical data ID standardization and metrics |
| Educational Institution Analytics | Student performance, enrollment, resource data |
| Non-Profit Fundraising Analytics | Multi-platform donor and campaign data |
| Sports Team Performance | Player stats, financials, fan engagement |
| Event Management Analytics | Multi-venue ticket sales and attendance |
Pick the right sample for your goal
| Goal | Sample | Why |
|---|---|---|
| First look at Mammoth | Multi-Store Retail Sales | Familiar sales, products and regions; suits several transformations, data quality checks, aggregation and filtering |
| Advanced features | E-commerce Multi-Channel or Supply Chain Optimization | Multi-source scenarios, standardization problems, harder calculations |
| Team training | Match your industry (Manufacturing to Quality Control, SaaS to Business Metrics) | People recognise the patterns and problems |
| Client demos | An industry-specific dataset | Stakeholders recognise the data and the business problem |
Tip: Choose sample data that matches your team's domain, for example a manufacturing quality dataset for an operations team.
Practise with a sample dataset
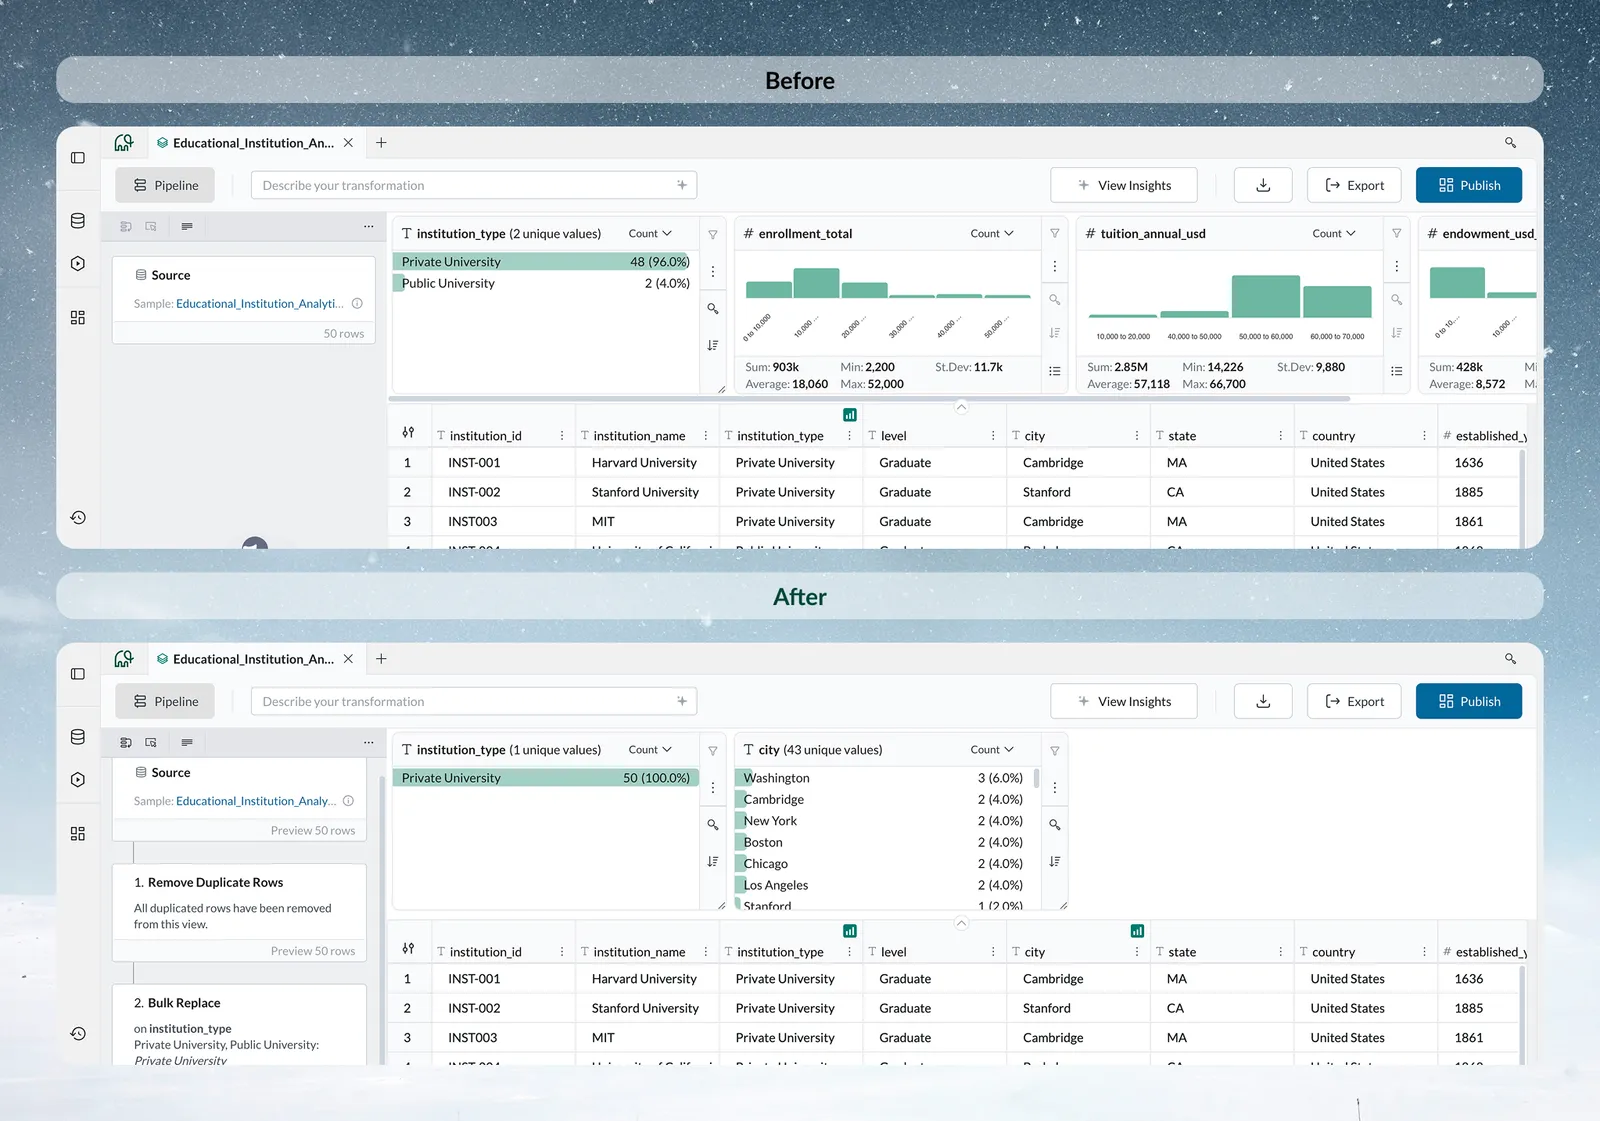
- Check data quality with Explore Cards: distributions, missing values, outliers and inconsistencies.
- Try several transformation types: cleaning (standardize company names), filtering (remove test data, focus on a region or period), aggregating (totals, averages, growth rates) and joining.
- Build an example pipeline: monthly sales reports (Multi-Store Retail), customer lifetime value (SaaS Business Metrics), campaign ROI (Social Media Campaign Performance) or quality tracking (Manufacturing Quality Control).
A first session takes about 15 minutes: pick Multi-Store Retail Sales (2 minutes), explore it with Explore Cards (5 minutes), build a filter pipeline (5 minutes), and generate a sales-by-region dashboard (3 minutes).
Tip: Build your demo pipeline on sample data before a client meeting. You can then repeat the same transformations on their actual data.
What sample files are not
- They aren't your business data or production-ready datasets. They are learning tools and starting points.
- They are smaller than production data, may not include every edge case, and are clean enough to focus on learning Mammoth rather than cleaning.
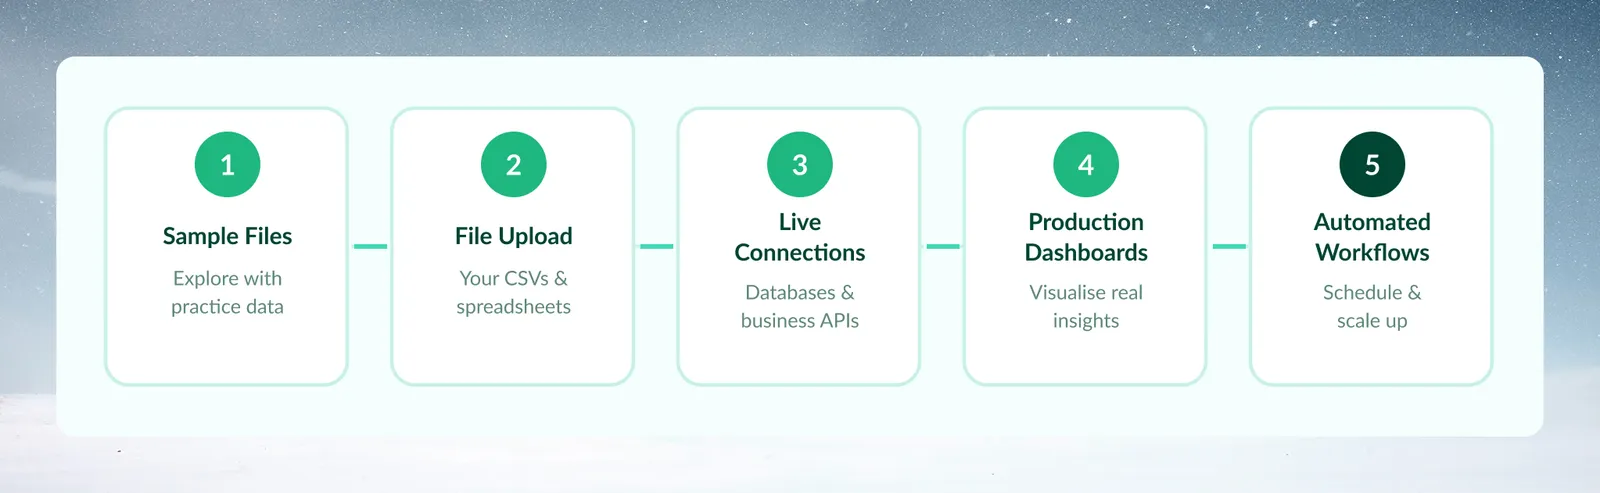
Move to your own data when you are comfortable with basic transformations, need to solve a specific business problem, or want to build production dashboards. Note which transformations worked on the sample, and start with a subset of your real data.
Related
- Create test data with AI: generate data shaped like yours.
- Upload files: bring in your own CSV or Excel files.
- Explore cards: explore the new dataset.
- Create a dashboard: visualize the results.
Something wrong? support@mammoth.io