Group, pivot and unpivot data
Group & Pivot summarises rows by one or more columns, like a spreadsheet pivot table, and Unpivot turns wide columns into rows. Open them from the Describe your transformation box (or a + button in the Pipeline panel) and select Reshape, Group & Pivot. Both are pipeline tasks that run again every time the pipeline refreshes.
Group and pivot step by step
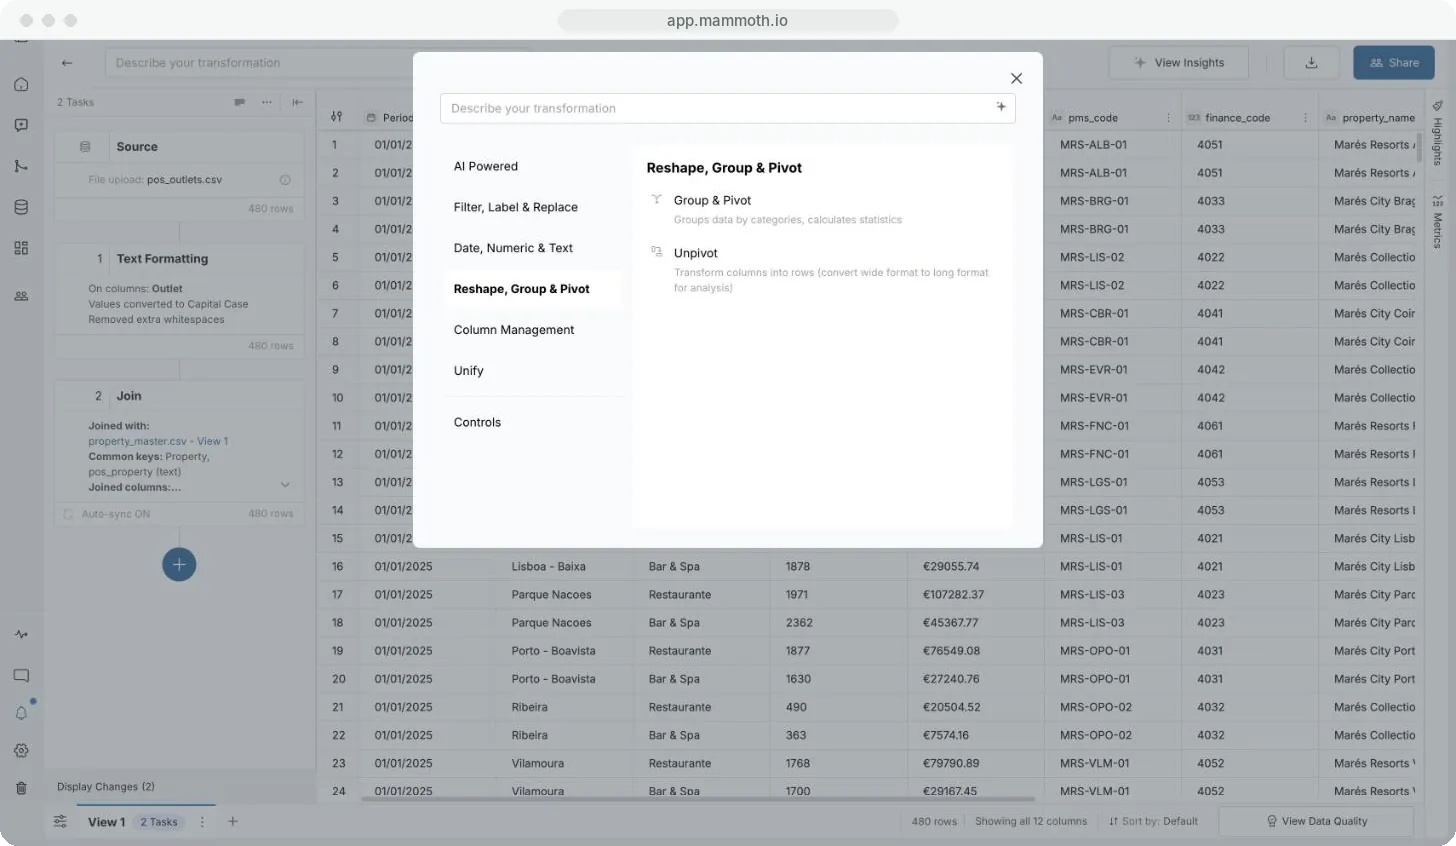
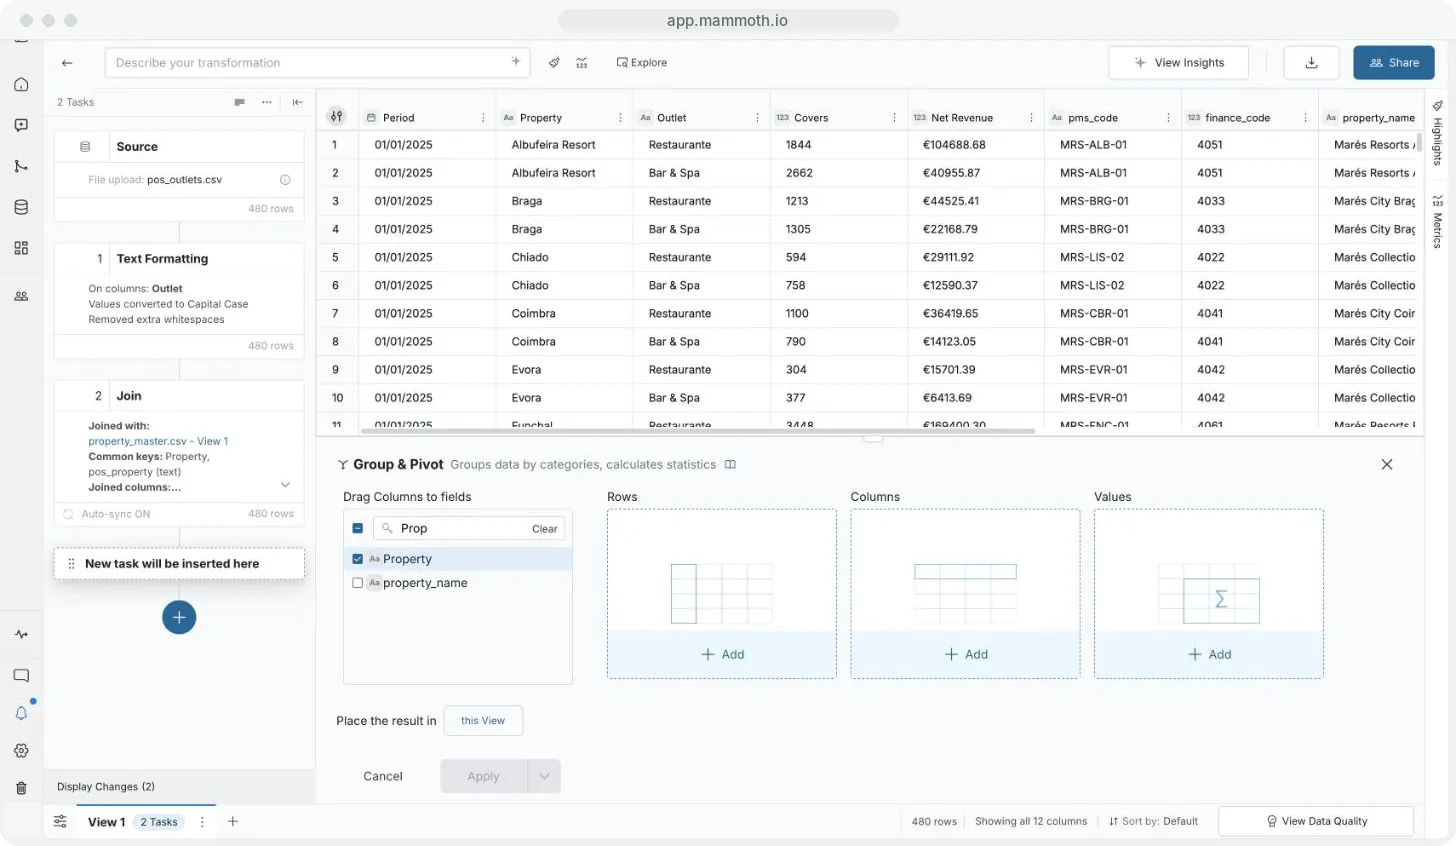
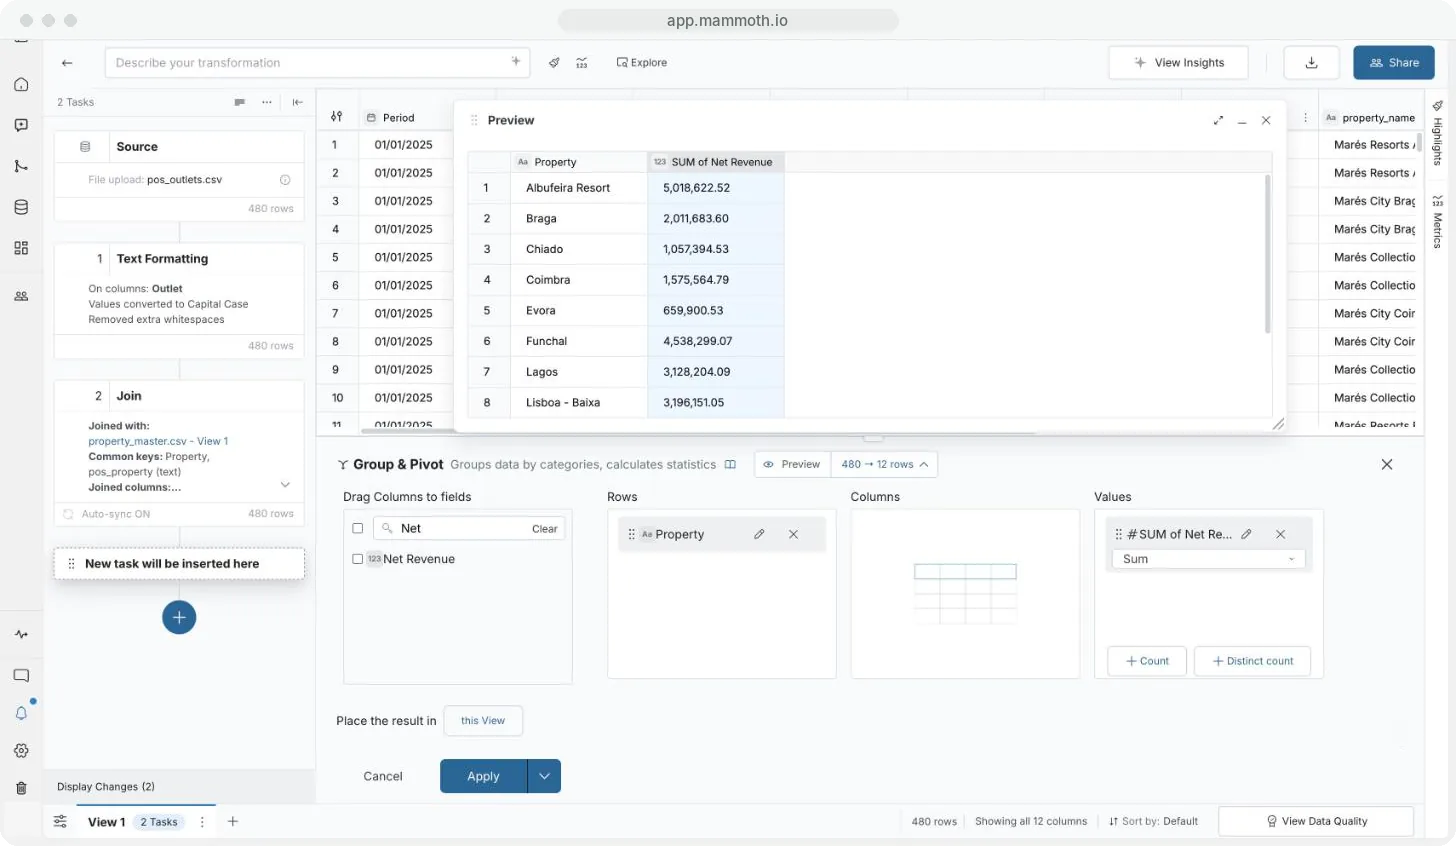
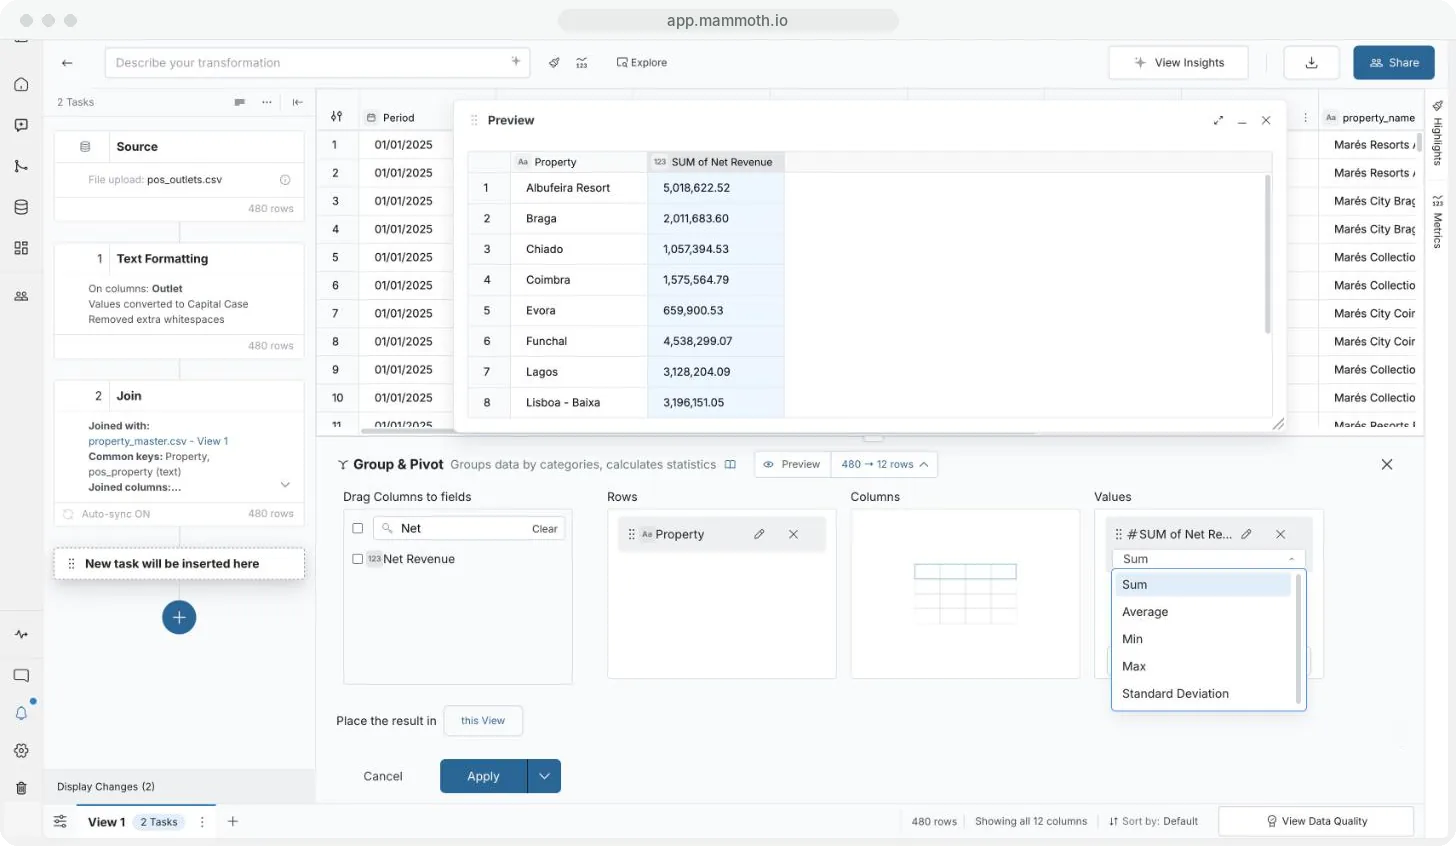
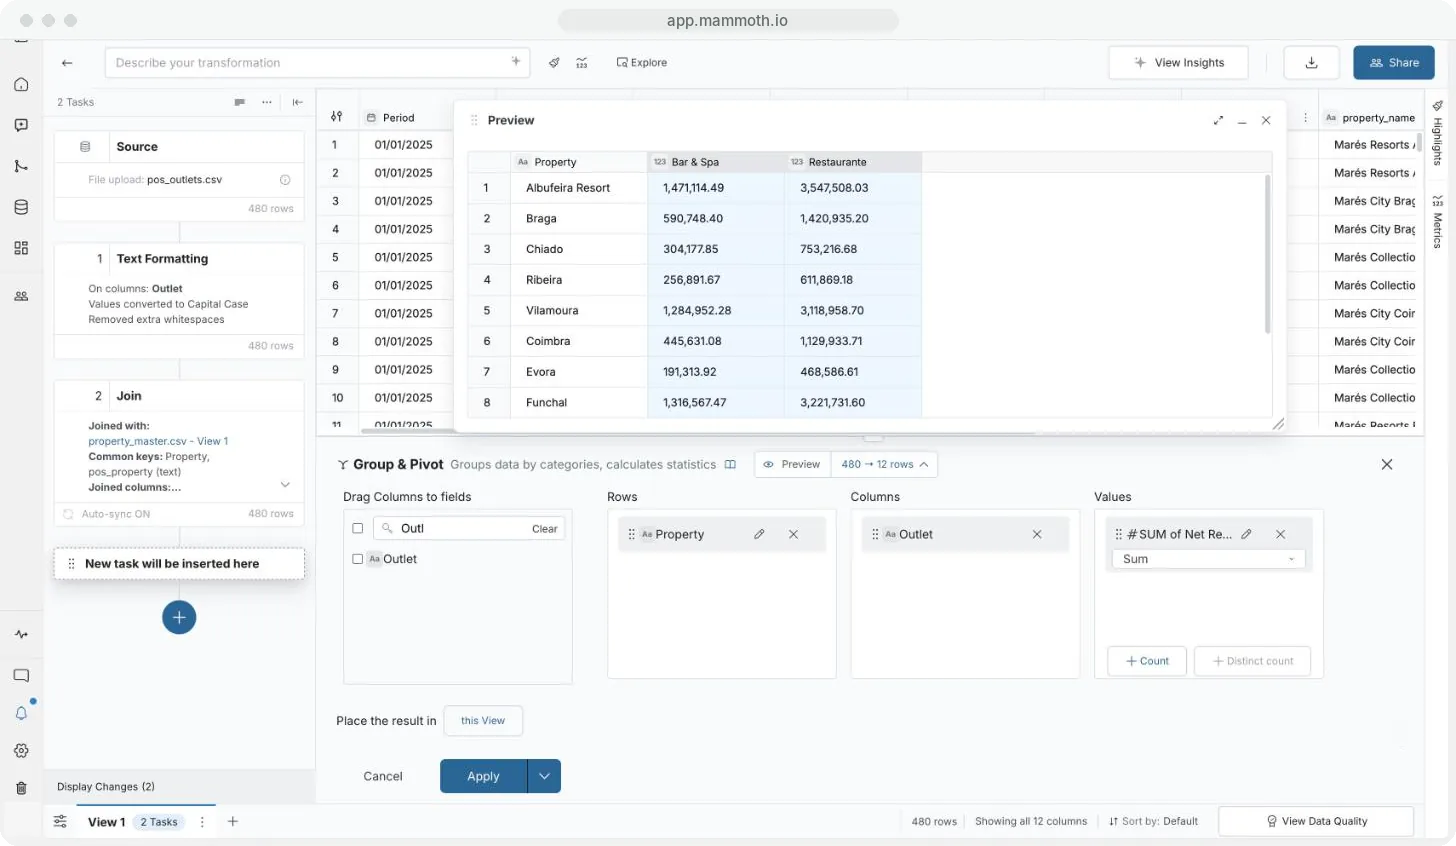
Step 1 of 6: Open Group & Pivot
What Rows, Columns and Values do
| Field | What it does |
|---|---|
| Rows | The columns you group by. Each unique combination of their values becomes one row. |
| Columns | A column whose unique values become separate column headers. This makes pivot output. Leave it empty for a plain grouped summary. |
| Values | The columns to calculate for each group |
What you can calculate in Values
| Column in Values | What it calculates |
|---|---|
| Number | Pick an aggregation from the menu under the value: Sum, Average, Min, Max or Standard Deviation |
| Text | Joins the group's values into one list, separated by a comma by default. Only while Columns is empty. |
| Same number column twice | Add it again for a second aggregation, for example Sum and Average side by side |
| + Count | A row count for each group. You can add it once. Shown while no column is ticked. |
| + Distinct count | The number of distinct values of a text or ID column in each group. Only while Columns is empty ("Available when "Columns" section is empty"). |
Date columns can go in Rows or Columns, but not in Values. While a text value or a distinct count is in Values, the Columns field is turned off.
Build a pivot table with values as column headers
Add a column to Columns. Each of its unique values becomes a column header, with the Values calculation under it.
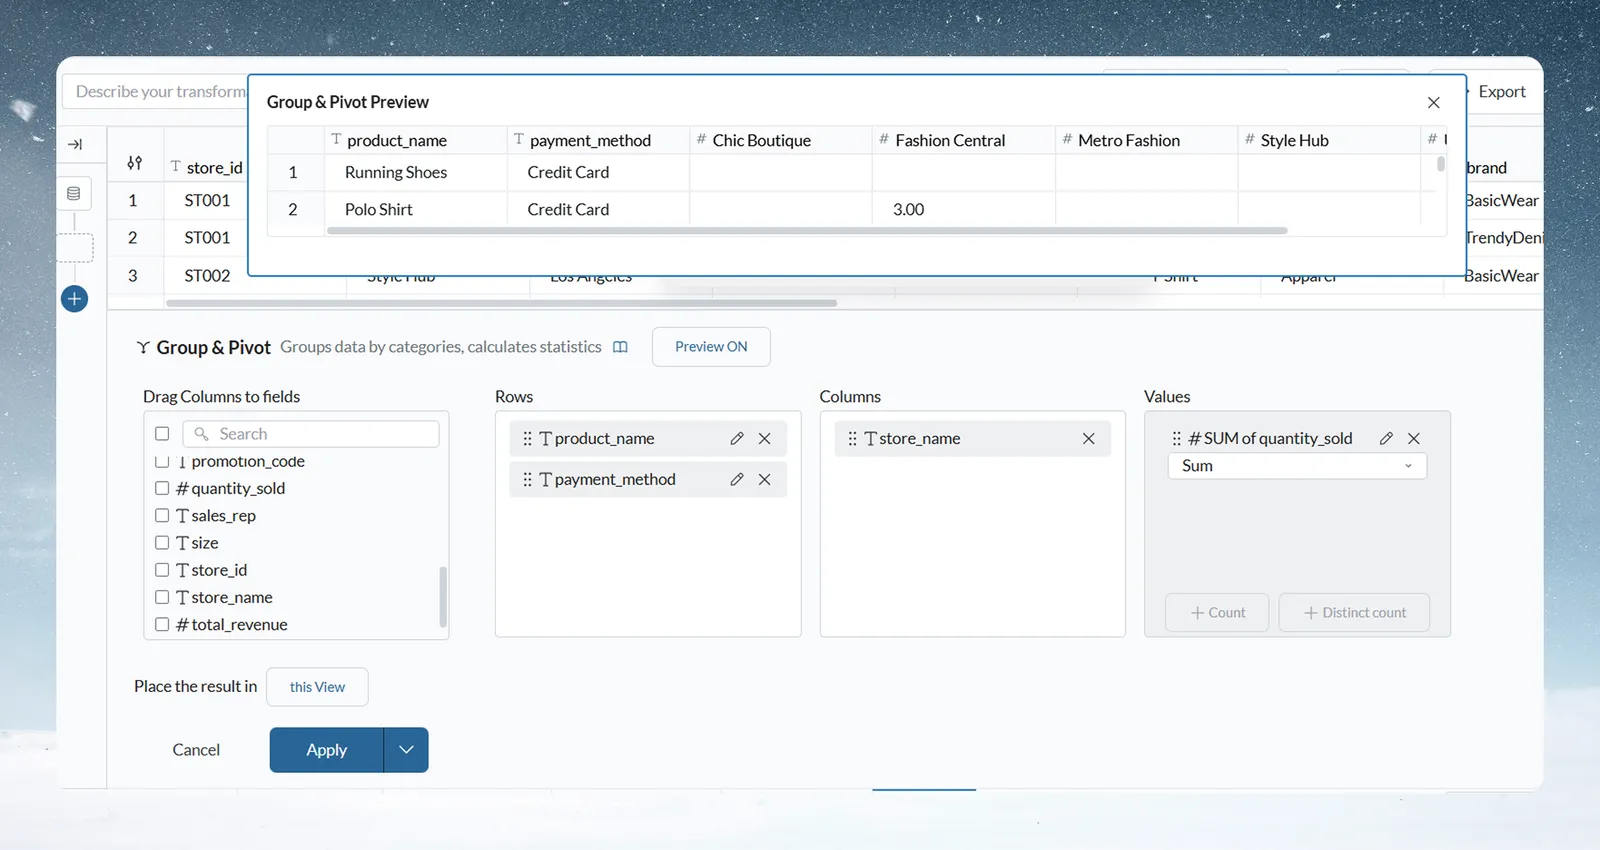
Example: put product_name in Rows, promotion_code in Columns and quantity_sold in Values with Sum. You get one row per product and one column per promotion code.
Join text values into one list per group
Add a text column to Values. Each group gets one cell with the group's values joined together.
Example: group orders by customer_id and drop product_name into Values. Set Delimiter to ; and Display Name to products_bought. Each customer gets one row with a list such as "Mug; Teapot; Kettle".
Rename a result column, set its number format or delimiter
Each chip in Values has an edit icon. Click it to open the Edit menu, change the settings and click Save changes.
| Option | Shown for | What it does |
|---|---|---|
| Display Name | Every value, while the result stays in this View | Names the result column. The default reads like "SUM of quantity_sold". |
| Edit format | Number values and counts | Sets the number format: separators, decimal places, currency symbol or percentage |
| Delimiter | Text values | The characters placed between joined values. The default is a comma. |
Number columns in Rows have the same edit icon, with Display Name and Edit format.
Group dates by year, month, weekday or hour
When a date column is in Rows or Columns, its edit icon opens an Edit format list that sets how dates are grouped. The default is by day (DD-Mon-YYYY).
| Edit format | Groups by | Result column type |
|---|---|---|
| DD Mon, YYYY HH:MM:SS | Second | Date |
| DD Mon, YYYY HH:MM | Minute | Date |
| DD Mon, YYYY HH | Hour | Date |
| DD-Mon-YYYY (default) | Day | Date |
| YYYY, Month | Year and month | Text |
| YYYY (number icon) | Year | Number |
| Month | Month name, across all years | Text |
| YYYY (text icon) | Year | Text |
| Weekday | Day of the week, across all weeks | Text |
| Mon-DD, YYYY HH:MM:SS | Second, written as text | Text |
A format that isn't a date changes the column's type. The menu tells you before you save, for example: "Editing format of column "order_date", changes its type from "Date" to "Text"". A date column in Rows also has a Display Name box.
Example: to total sales by month, put order_date in Rows, set its Edit format to YYYY, Month, and put sales in Values with Sum.
Preview the grouped result before you apply
The live preview shows the grouped result above the panel while you set it up. Use the Preview control in the panel header to turn it off or on. See How the pipeline works for the preview tabs and controls.
Send the result to a new dataset instead of this View
By default the result replaces the rows of the current View (Place the result in this View). To keep this View as it is, choose New Dataset, give it a name and pick where it goes under Located at.
Turn columns into rows with Unpivot
Unpivot turns a wide table into a long one: column headers become row values. Use it when you have one column per period or category, such as Jan_Sales, Feb_Sales and Mar_Sales, and need one Month column and one Sales column. Most grouping, joining and analysis works best on the long layout.
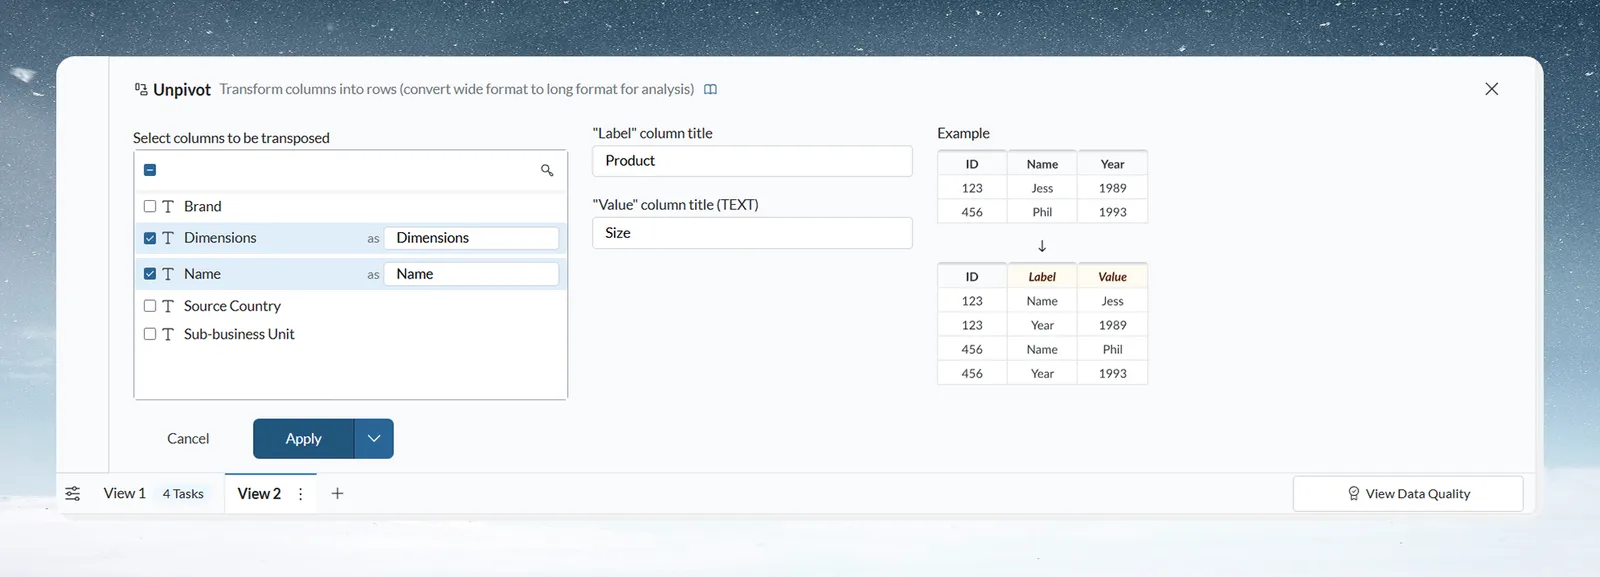
- In your View, click Describe your transformation, then Reshape, Group & Pivot › Unpivot.
- In Select columns to be transposed, pick the columns to turn into rows. Once you pick one, only columns of the same type are offered.
- In "Label" column title, name the new column that will hold the old column headers.
- In "Value" column title, name the new column that will hold the old cell values.
- If the columns are numbers or dates, set Format. For numbers, set the number format of the value column. For dates, click Choose date format and pick one.
- Click Apply.
All other columns are kept and repeated on each new row. The two new names must differ from each other and from existing columns.
Example: a View has store, Jan_Sales, Feb_Sales and Mar_Sales. Select the three sales columns, name the label column Month and the value column Sales, and click Apply. Each store now has three rows, one per month.
Troubleshooting
| Symptom | Cause | Fix |
|---|---|---|
| "Adding or averaging it adds up the codes. Did you mean Count distinct?" | Sum or Average on a column marked as an ID | Click Swap to Count distinct, or Keep to leave it |
| "Adding percentages rarely means anything. Did you mean Average?" | Sum on a Percentage column | Click Swap to Average, or Keep to leave it |
| The Columns field is turned off | A text value or a distinct count is in Values | Remove it to pivot |
| A ticked column doesn't arrive in Values | Dates never go in Values; text only goes in while Columns is empty | Use + Count, extract a number from the date first, or empty Columns |
| Sum or Average isn't offered | The column is text, not Number | Add a Convert Column Type step before Group & Pivot. See Convert text to dates and numbers. |
| An empty group appears | The grouping column has empty values | Filter those rows out first, or handle the group later |
| "A column with same name already exists. Try another value" (Unpivot) | A new column name is already used | Choose a different label or value column title |
| "The new value column does not carry over the meaning of the columns you stack (an ID, a currency or a percentage). It starts as a plain column." (Unpivot) | The stacked columns were marked as an ID, currency or percentage | Add a Convert Column Type step after the Unpivot to restore the meaning |
The column meaning warnings appear under Values and never block Apply. Once you click Keep, the warning stays dismissed for that step. See Column types, IDs, currency and percentages for how a column gets its meaning.
Related
- Join two datasets on a shared column: summarise a dataset before joining it.
- Work with dates and financial years: extract a month or financial year to group by.
- Calculate with formulas: running totals and ranks that keep every row.
- Column types, IDs, currency and percentages: why some aggregations show a warning.
- Combine datasets: other ways to bring data together.
Something wrong? support@mammoth.io