Add batch name, date or ID as columns and filter by batch
Batch details can become ordinary columns, so you can see which batch each row came from and filter, group and analyze by batch in every View. In the Data Library, open the dataset's panel, then Settings & history > Batches, and select Add Batch Info to Dataset. For what a batch is, see Batches: see, suspend and fix what arrived.
Open the batch info panel
You can reach it from four places:
- Data Library: open the dataset's panel, then Settings & history, then Batches. Below the batch list, select Add Batch Info to Dataset.
- Column Manager in the data editor: open the dataset's View and launch the Column Manager from the action bar at the left edge of the data grid. Click Add batch info. This opens the field selection only, not the batch list.
- Pipeline Source card: at the top of the pipeline panel, click the ⓘ info icon on the right of the Source card to open a Batches window with the same batch list, Suspend / Unsuspend, Delete and Add Batch Info to Dataset. The icon is disabled until the dataset has been saved.
- Manage dataset settings: in the View tab bar at the bottom of the data editor, click Manage dataset settings and select Batches.
Choose the batch fields
The same panel appears from every entry point. Choose one or more fields: Batch ID, Date, Source (JSON), Name or Row Count. Fields already added are ticked; clear one to remove its column. Click Submit.
Each added column is prefixed with batch_ (for example, batch_Name) and applies to all Views of the dataset, not only the current one.
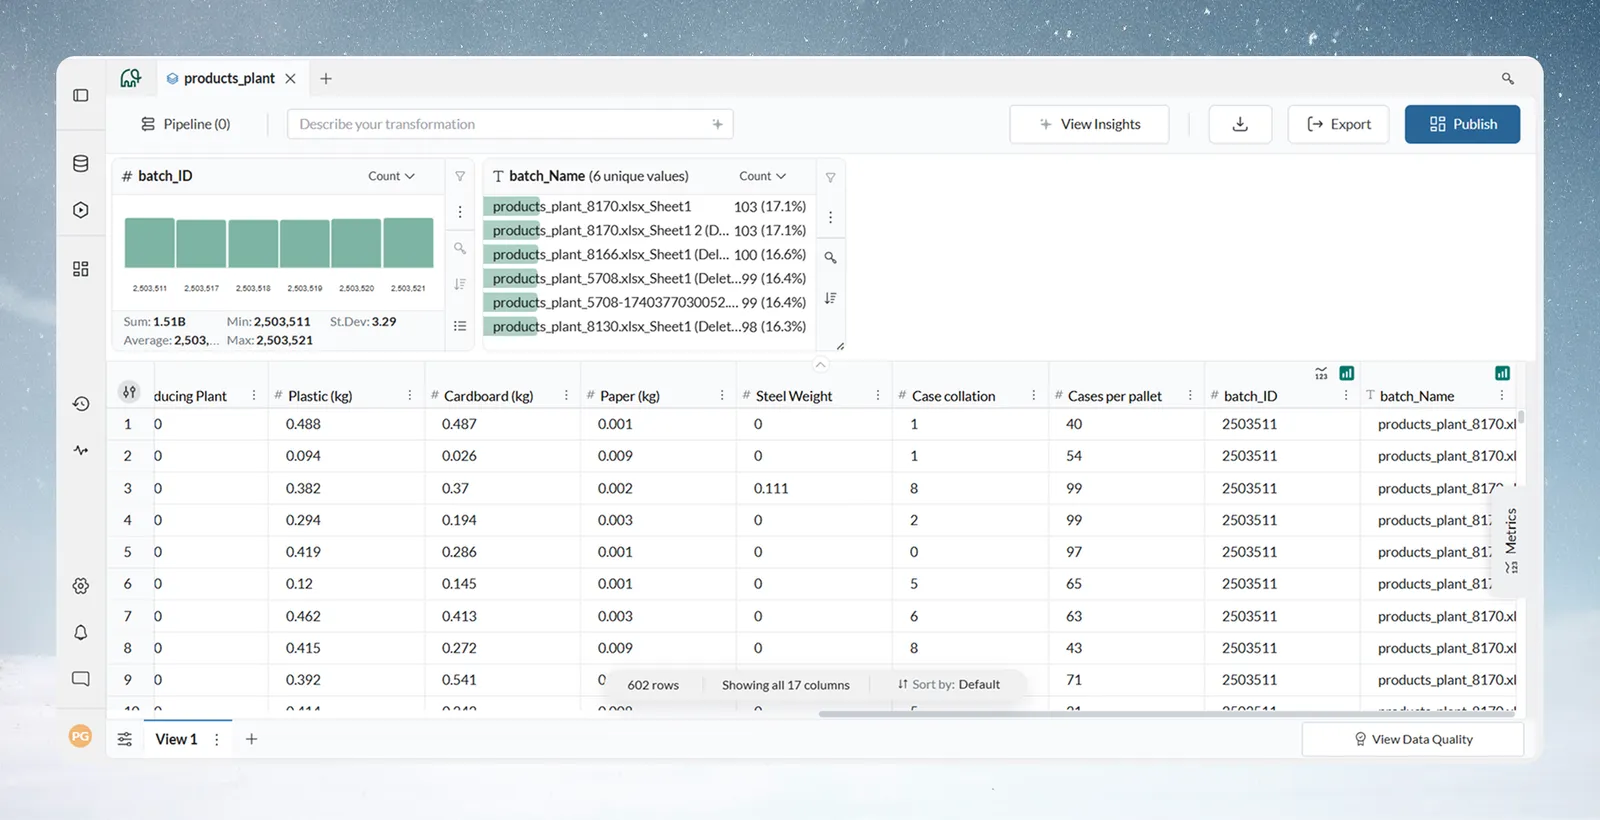
Filter and compare data by batch
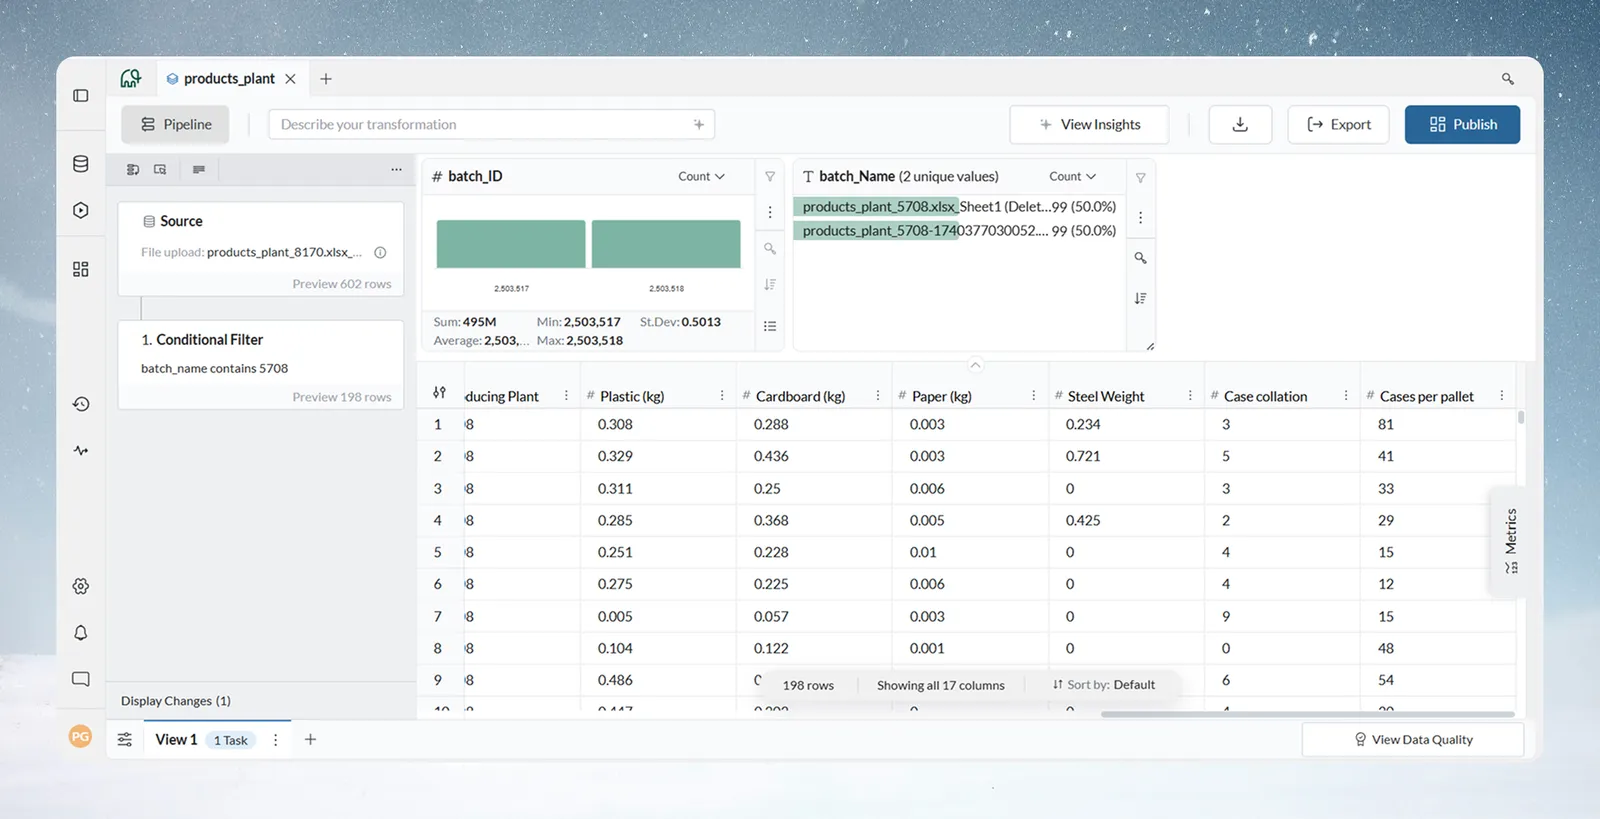
Use a Conditional Filter in the pipeline to isolate or compare batches (see Filter rows):
| Filter | Result |
|---|---|
batch_name CONTAINS "2024_Q1" | Shows only Q1 2024 data from combined dataset |
batch_name IN ("Store_001", "Store_002", "Store_003") | Analysis limited to specific store locations |
batch_name NOT LIKE "test%" | Removes all batches with names starting with "test" |
batch_date >= DATEADD(month, -3, TODAY()) | Last 3 months of batches only |
Tag batches with business labels
When batch names hold a region, period or vendor, make a cleaner column for grouping:
- Add the batch_name column.
- Create a "Period" or "Region" column with Label & Insert.
- Tag batches with labels such as "Q1", "Q2" or "North".
- Filter and group by those labels to build period-over-period or region-over-region reports.
Common patterns with batches
| Pattern | How it works |
|---|---|
| Store comparison | One batch per store. Add batch_name, then Group & Aggregate by batch to compare stores. A dashboard drills down by region to each store. |
| Vendor quality scoring | One batch per vendor. Calculate error rate and completeness per batch. Suspend low-quality batches for clean-up, then unsuspend them. |
| Time-series trends | Monthly batches over several years. Window functions calculate rolling averages and period-over-period changes. |
| A/B tests | Control and treatment batches share a dataset. Suspend the control batches to isolate the treatment, then unsuspend or delete them. The Activity Log keeps the history. |
| 24-month rolling report | Add one month per cycle in Combine mode, with a count-based retention policy removing the oldest batches. |
| Multi-shift quality data | Three batches a day, tagged by shift, with separate Views for daily and per-shift analysis. |
| Multi-property revenue | A Data Consolidation automation adds a batch per property per day; batch_name identifies the property, and the pipeline calculates portfolio KPIs. |
Related
- Batches: see, suspend and fix what arrived: the batch list, suspend and delete.
- Filter rows: Conditional Filter options.
- Keep fewer batches with a retention policy: drop old batches on a rule.
- Dataset settings and history: update method and other dataset settings.
Something wrong? support@mammoth.io