Explore your data in Mammoth: which tool to use
Mammoth has four tools that show what is in a View before you build any transformation: Explore Cards, the Metrics panel, View Insights and the Data Quality Report. You find them all in the data editor: the Explore toggle and Metrics icon in the action bar, the View Insights button on the right of the action bar, and View Data Quality in the footer below the grid. Viewers can read Explore Cards; filtering needs edit access to the workspace. View Insights and the Data Quality Report are unavailable in preview mode, in edit mode and in a view-only workspace.
Which page do I need?
| I want to... | Go to |
|---|---|
| See what is in a column and filter the grid by clicking values | Explore Cards |
| Filter by a sentence, search every column, or plot two number columns | Ask, Search and Compare cards |
| Read a text, number or date card, change its grouping or measure | Text, number and date cards |
| Search, hide, show or reorder columns, or rename and retype them | Browse columns |
| Track a total, average or custom KPI while I filter | Metrics |
| Get an AI summary of what is interesting in my data | View Insights |
| Check data quality and get suggested fixes | Data quality report |
| Read, search and filter a View on my phone | Use Mammoth on a phone |
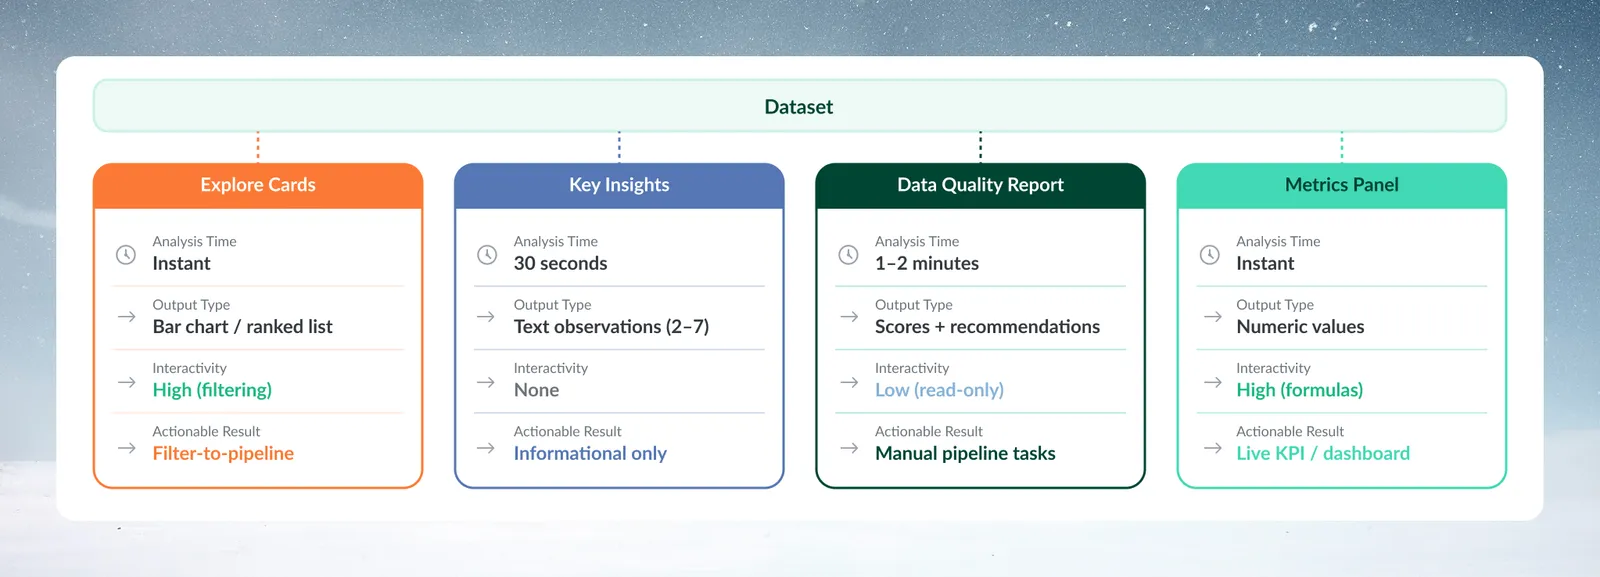
The four explore tools at a glance
| Tool | What it gives you | How you interact | What you can do with the result |
|---|---|---|---|
| Explore Cards | Text: a ranked list (or donut, treemap). Number and date: a vertical bar chart (or list; timeline for dates) | High: click values to filter | Turn filters into a pipeline task or a new View; add a card's chart to a dashboard |
| Metrics panel | Single numbers, such as a sum or a custom formula | High: formulas and conditions | KPI calculations and dashboard preparation |
| View Insights | 3–7 AI-written observations | None: read only | Informational only |
| Data Quality Report | A score, six dimension scores and recommended tasks | Low: read only | You build the recommended tasks in the pipeline yourself |
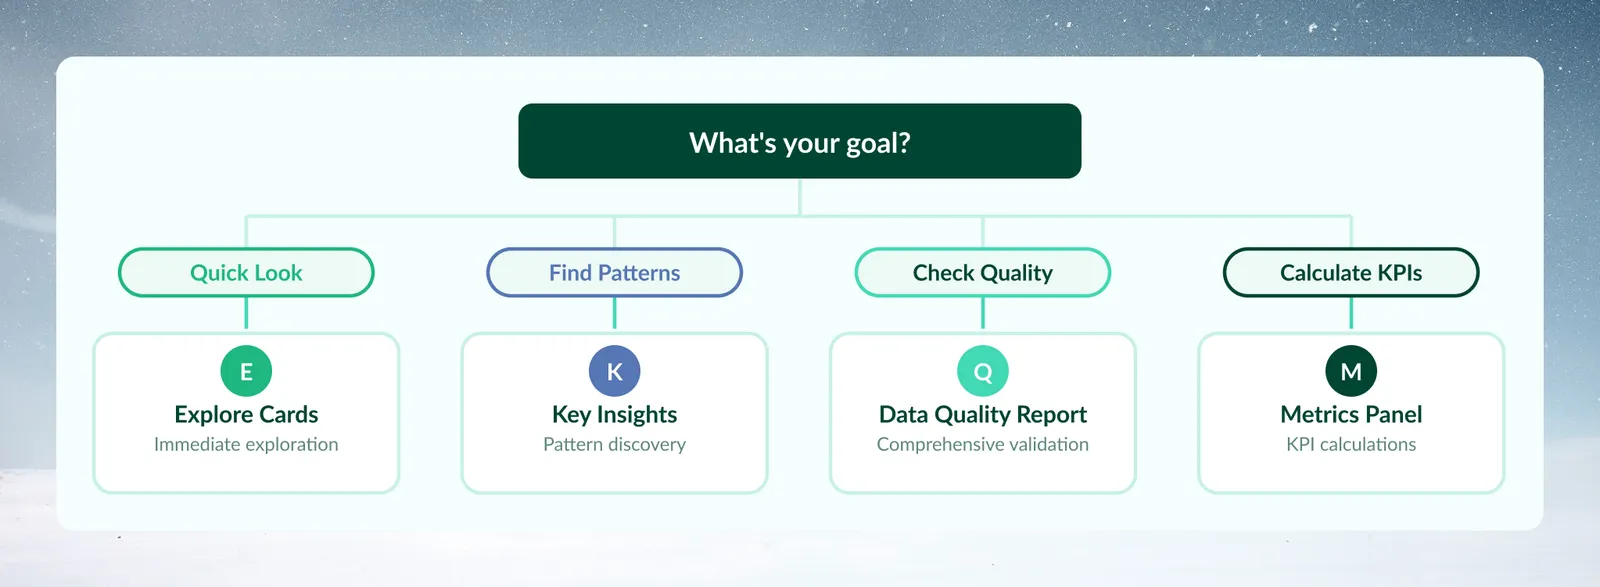
Pick an explore tool by your goal
| Goal | Start with |
|---|---|
| I loaded new data and want to understand it | Explore Cards |
| I need to check data quality before building a pipeline | Data Quality Report |
| I want a quick summary of key numbers | Metrics panel |
| I want AI to tell me what's interesting in my data | View Insights |
| I want to investigate a specific pattern or segment | Explore Cards, then filter by clicking values |
Use Explore Cards for a first look and filtering
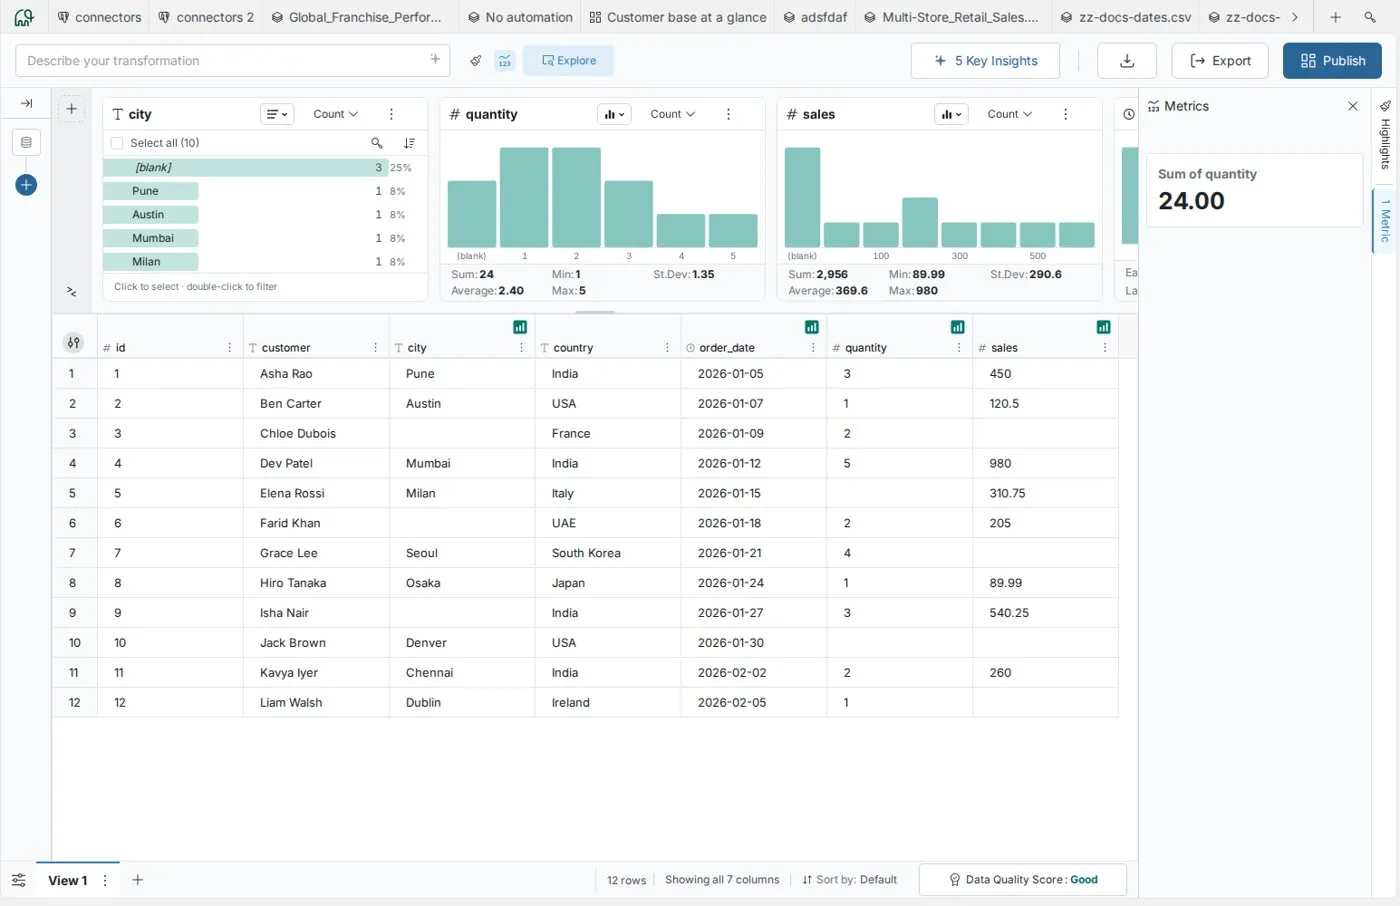
Explore Cards show a card for each column you add. Text columns default to a ranked list of distinct values with counts and percentages, and can switch to a donut or treemap. Number columns default to a vertical bar chart of value ranges. Date columns default to a vertical bar chart and can switch to a timeline. Number and date cards can also show a list.
- Good for: a first look at new data, value distribution checks, spotting outliers, and testing filter logic before you automate it.
- Not for: AI business observations, a full quality score, or calculations beyond the card statistics (Sum, Min, St.Dev, Avg and Max for numbers; Earliest and Latest for dates).
- Example: "I uploaded sales data and want to see the spread by geography before I build regional reports."
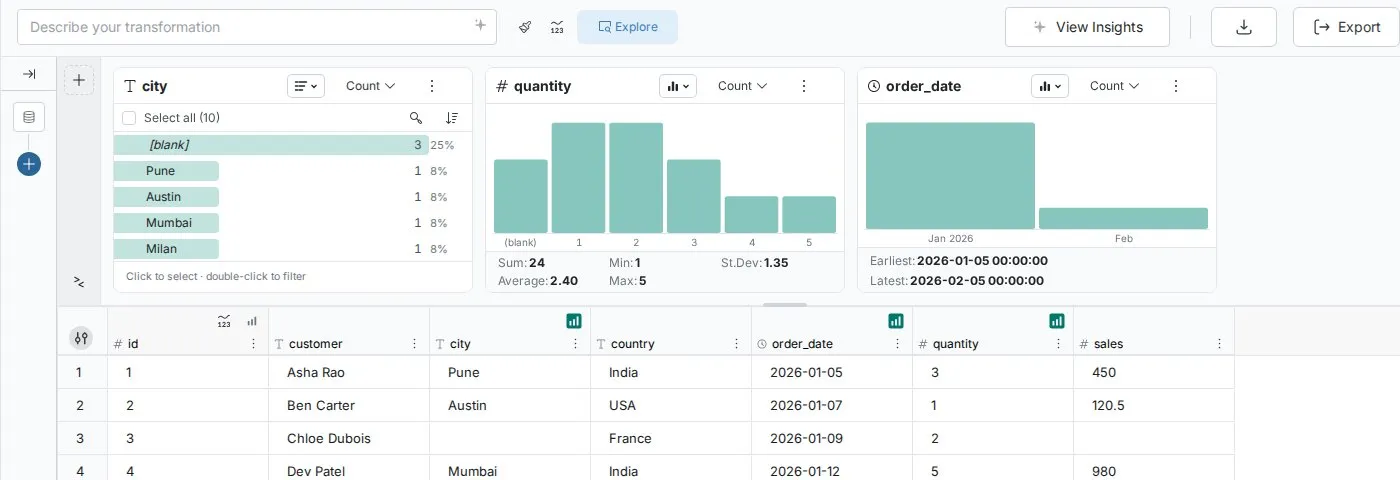
Double-click a value to filter at once. The filter badge beside the Explore toggle counts your active filters, and you can later turn them into a permanent pipeline task.
Use the Metrics panel for specific numbers
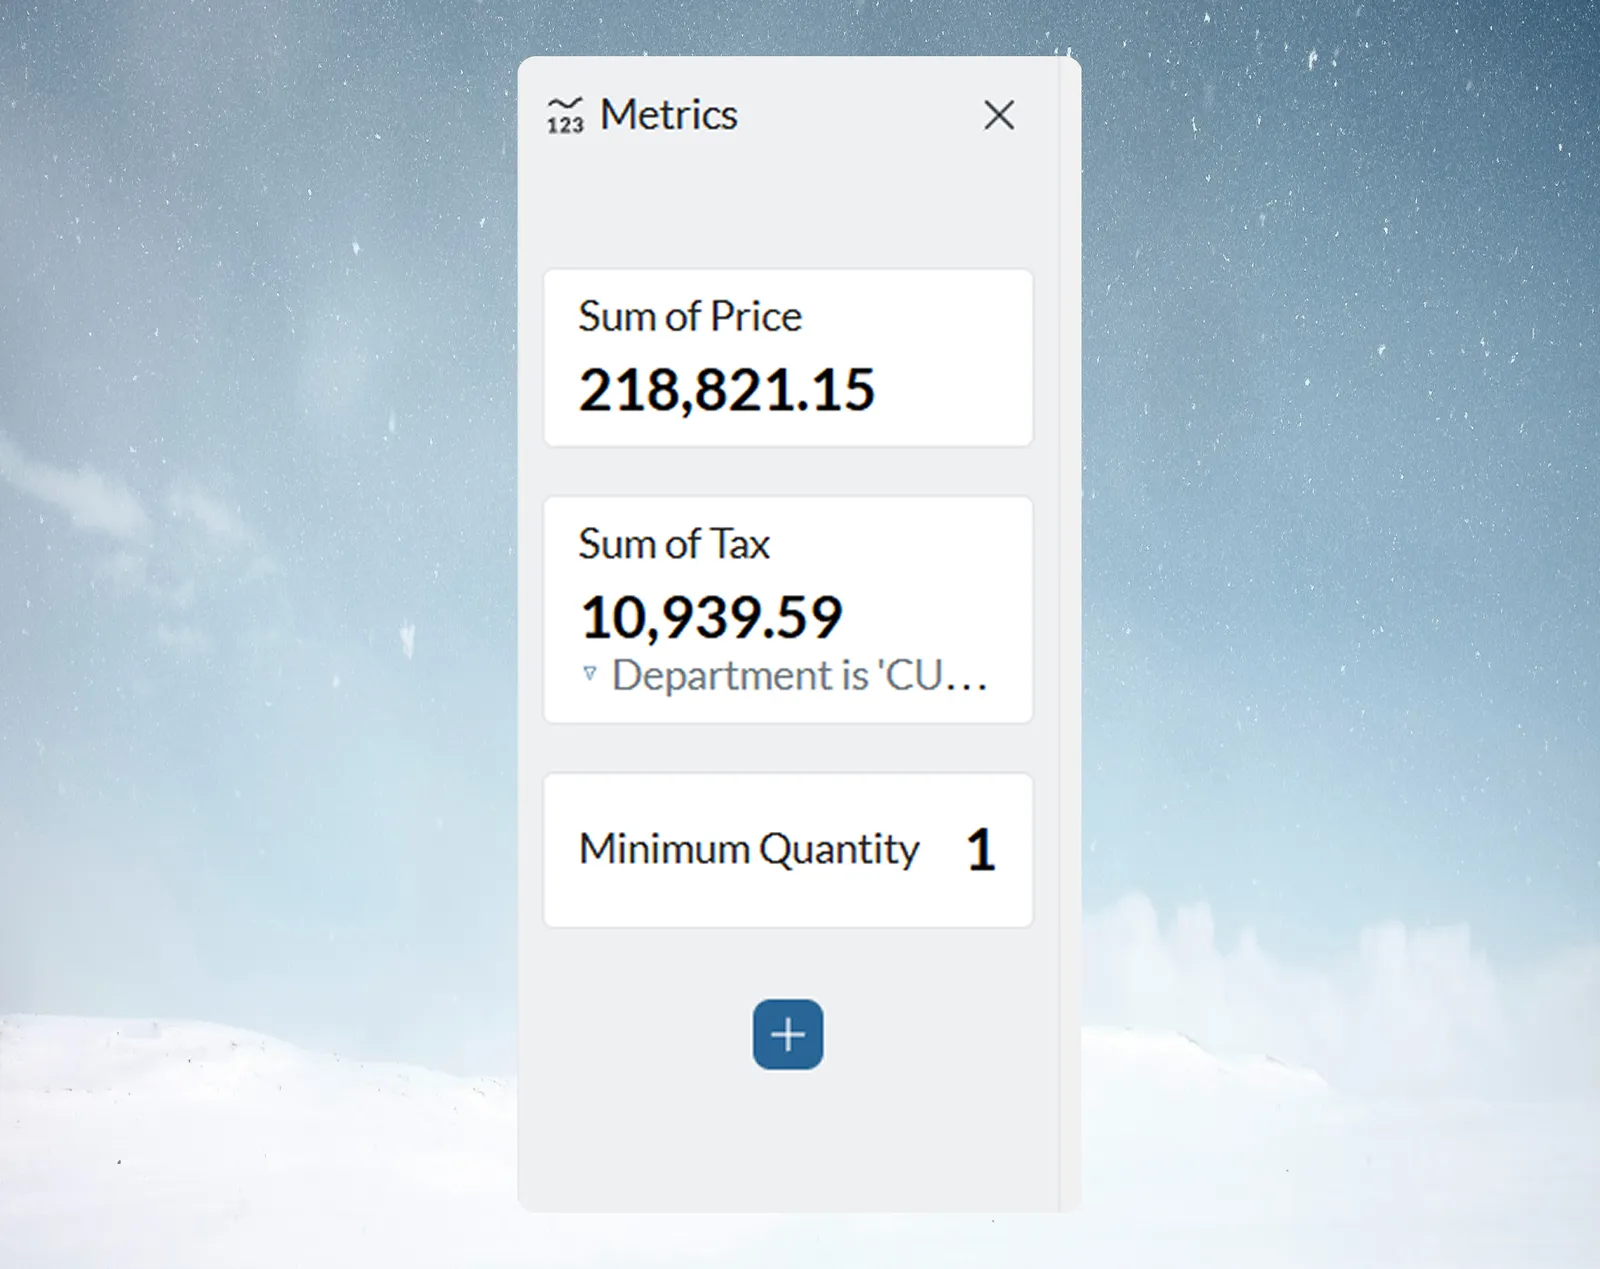
The Metrics panel creates single-value metrics and KPIs. They update with the View and your explore filters, unless you lock a metric to keep its value fixed. It prepares numbers for dashboards but does not create dashboards.
- Good for: specific KPIs, ratios and percentages, watching a number as you filter, and comparing aggregations.
- Not for: basic column statistics (Explore Cards already show them) or full data profiling.
- Example: "I'm building a sales dashboard and need conversion rate, average deal size and quota attainment."
Use View Insights for an AI summary
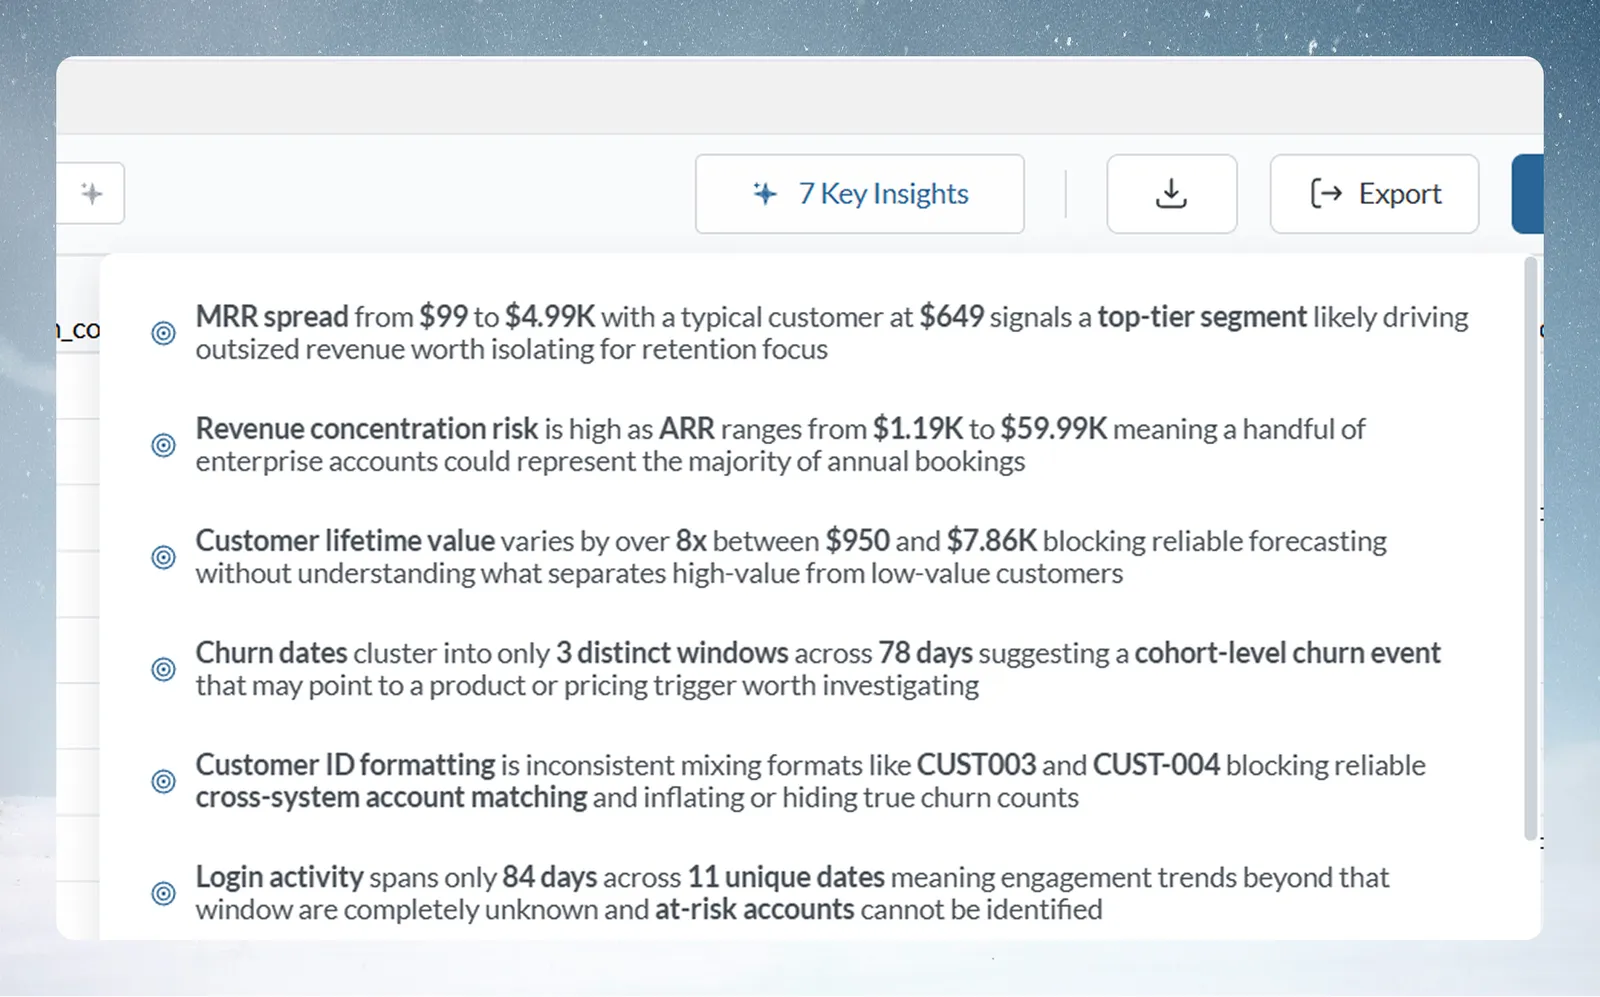
View Insights reads the current View and writes 3–7 business observations about patterns, trends and anomalies. The AI picks the count, and you can't set it. Before the first run, the button on the right of the action bar reads View Insights; afterwards it shows the count, for example 5 Key Insights.
- Good for: briefings, finding trends you didn't know to look for, and "what should I know about this data?"
- Not for: quality scores or interactive exploration.
- Limits: no follow-up questions, no export button (copy the text yourself), and the current View only.
- Example: "I need to present quarterly results to the board and want the main trends highlighted."
Use the Data Quality Report before you rely on the data
The Data Quality Report scores the current View on six DAMA (Data Management Association) dimensions and recommends pipeline tasks, such as Remove Duplicate Rows, Conditional Filter, Text Formatting or Math Function, labelled High Priority, Medium or Low. Open it from View Data Quality in the footer below the grid; View Details opens the full report. There is no one-click apply: you build the tasks yourself.
- Good for: checks before production, audit and compliance evidence, and planning which cleaning steps to build.
- Not for: quick exploration, or issues you already know and accept.
- Limits: no export (screenshot or copy), a snapshot rather than continuous monitoring, the current View only, and no custom dimensions beyond the DAMA six.
- Example: "This data feeds our finance dashboard. I need to check it before executives see it."
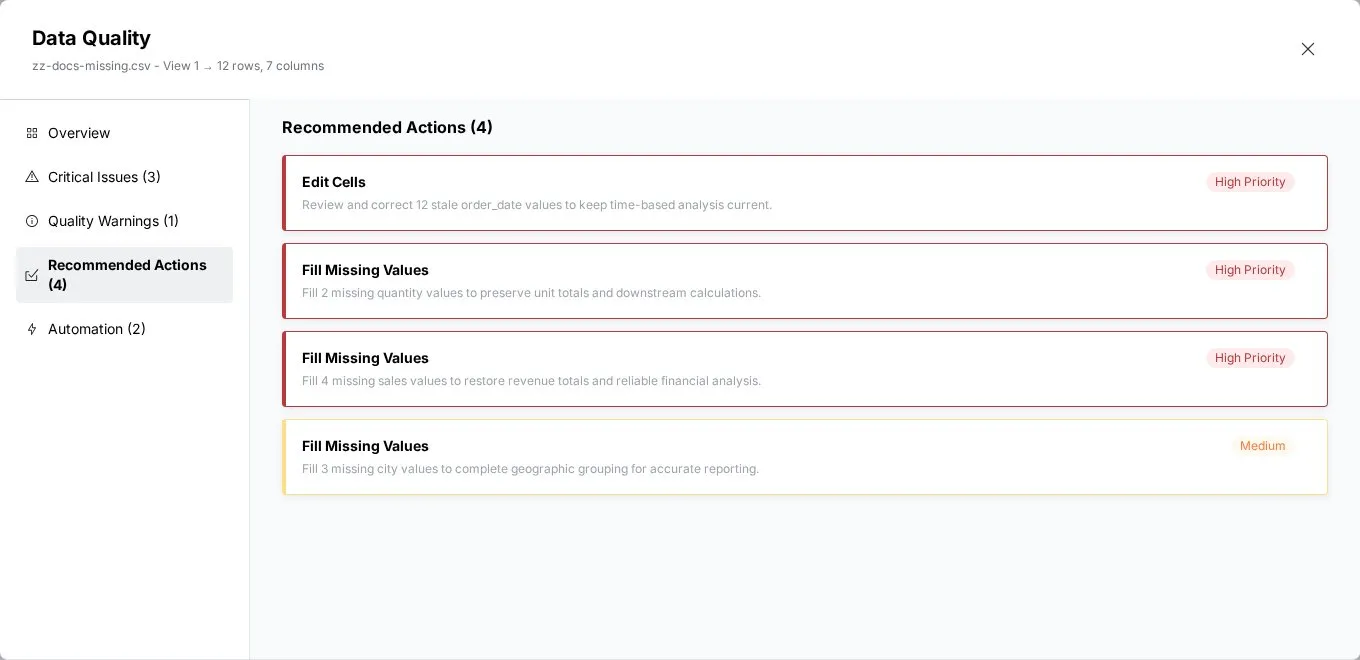
Run the report as soon as you connect a new data source, and fix critical issues before you spend time on a pipeline.
What each explore tool sees and when it refreshes
| Tool | Data it reads | When it refreshes |
|---|---|---|
| Explore Cards | The View after its pipeline, narrowed by your explore filters | As you filter and as the View's data changes |
| Metrics panel | The same, unless a metric is locked | As you filter and as the View's data changes |
| View Insights | The whole View after its pipeline; explore filters don't change it | Only when you click the button. A saved result is cleared when the View's data changes |
| Data Quality Report | The whole View after its pipeline; explore filters don't change it | Only when you click the button. A saved result is cleared when the View's data changes |
To make View Insights or the Data Quality Report look at a subset, add a Conditional Filter task to the pipeline. See Filter rows.
Combine the explore tools in a workflow
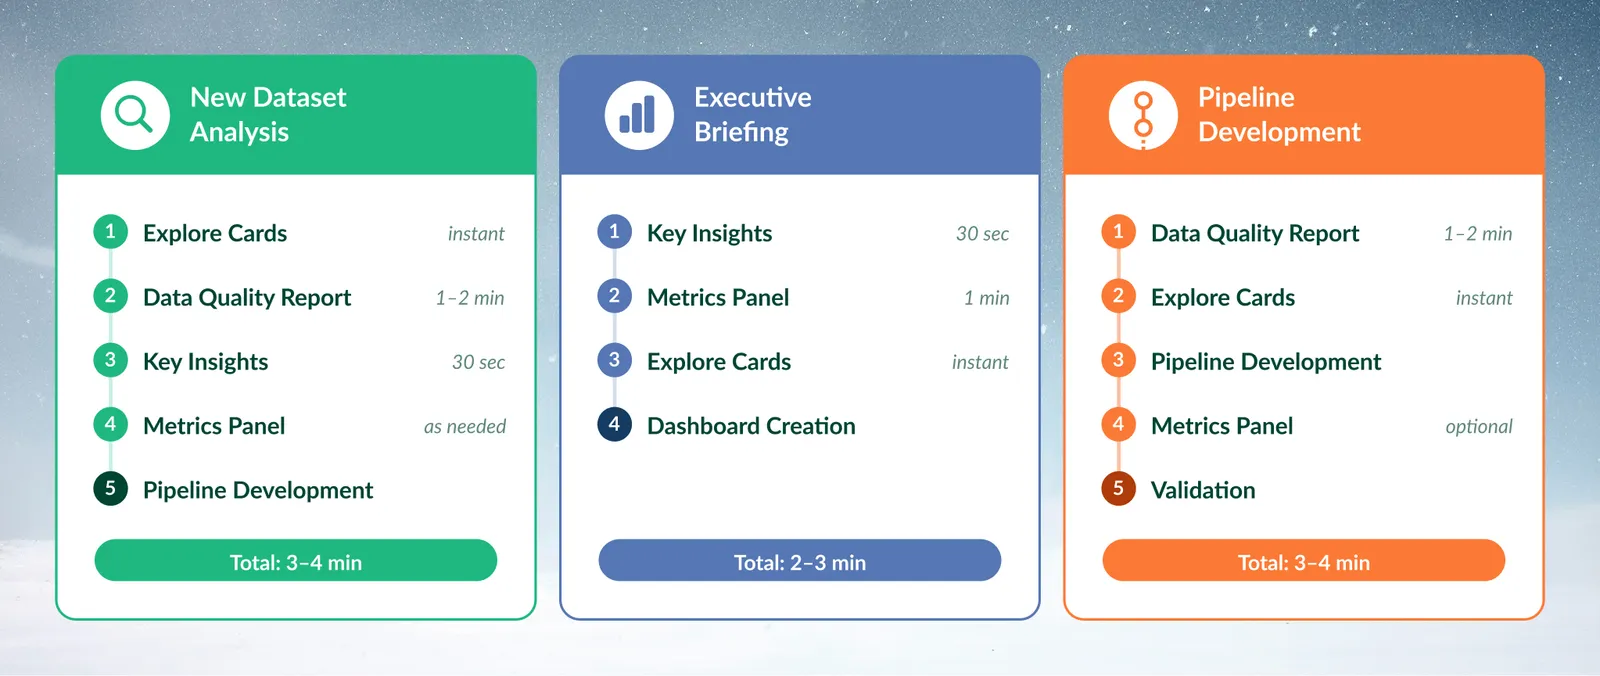
New dataset:
- Explore Cards to see structure and distributions.
- Data Quality Report to check the data is ready.
- View Insights to find business patterns.
- Metrics panel for the KPIs you need.
- Turn what you found into pipeline tasks.
Briefing for a manager or board:
- View Insights for the main trends.
- Metrics panel for the numbers behind each point.
- Explore Cards to confirm the patterns visually.
- Build a dashboard from the metrics.
Production pipeline:
- Data Quality Report to find what needs fixing.
- Explore Cards to understand the columns you will transform.
- Build the pipeline tasks.
- Metrics panel (optional) for success measures.
- Run the tools again to confirm the improvement.
Examples by industry
- Financial services, monthly regulatory reporting: run the Data Quality Report for completeness and accuracy, check unusual transactions with Explore Cards, calculate key ratios in Metrics, then use View Insights for a summary for the compliance team.
- Manufacturing, production line analysis: check defect rates by product line with Explore Cards, let View Insights point out patterns, calculate yield in Metrics, then confirm sensor data with the Data Quality Report.
- Hospitality, revenue management: use View Insights for seasonal patterns, filter peak and off-peak periods with Explore Cards, calculate occupancy, RevPAR and ADR in Metrics, then check booking data completeness with the Data Quality Report.
Choose an explore tool for common situations
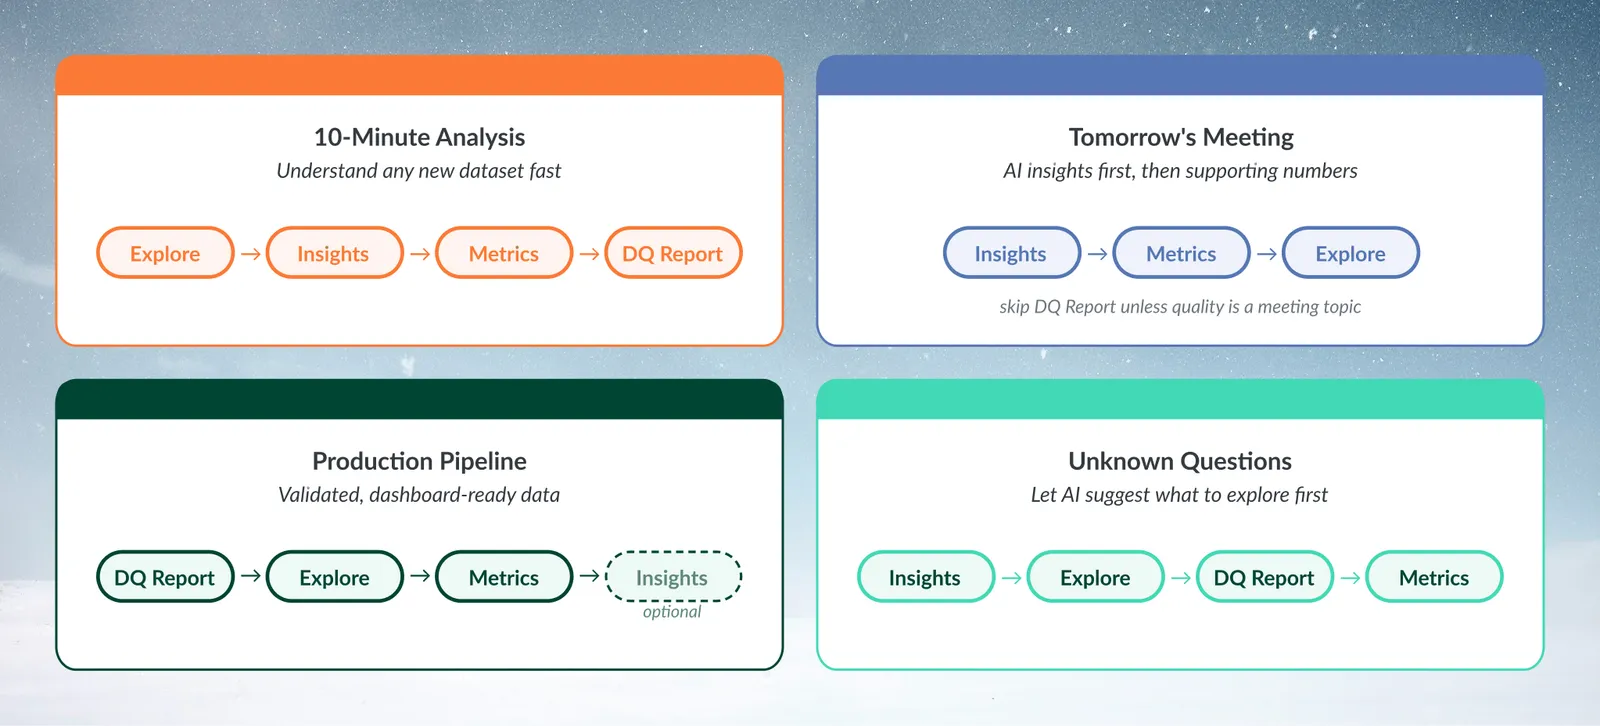
| Situation | Order to use the tools |
|---|---|
| "I have 10 minutes to understand this dataset" | Explore Cards, View Insights, a few metrics, then the Data Quality Report. Use any time left to plan next steps |
| "My boss needs insights for tomorrow's meeting" | View Insights first, Metrics for the numbers, Explore Cards if questions come up. Skip the Data Quality Report unless quality is on the agenda |
| "This data feeds our production dashboard" | Data Quality Report, Explore Cards for thresholds, Metrics for exact KPIs. View Insights is optional |
| "I'm not sure what questions to ask" | View Insights first, Explore Cards to follow its leads, the Data Quality Report for limits, then Metrics for ratios you find |
To check a finding, use more than one tool. For example, View Insights says "Revenue grew 23% in Q3". Filter to Q3 in Explore Cards, calculate month-over-month growth in Metrics, then check revenue completeness in the Data Quality Report.
Turn what you find into action
- Explore Card filters become a Conditional Filter task or a new View. See Explore Cards.
- An Explore Card's chart goes on a dashboard from its More options menu (Add to dashboard…).
- Data Quality Report recommendations become tasks you build in the pipeline.
- View Insights patterns are leads to research with Explore Cards. Copy the text for documentation or talking points.
- Metrics feed dashboards.
- Data Quality Report scores work as quality gates in your pipeline process.
- View Insights output can document a dataset, and findings can be copied or screenshotted for stakeholders.
Troubleshooting explore tool choices
| Symptom | Cause | Fix |
|---|---|---|
| "I used View Insights but need specific numbers" | View Insights gives observations, not calculations | Use the Metrics panel |
| "The button showed 5 Key Insights but now I get 3" | The count is set by the AI each time, between 3 and 7, and can differ on the same data | Nothing to fix. You can't set the count |
| "The Data Quality Report found issues but I need quick insights" | Patterns on dirty data can mislead | Build the recommended tasks for critical issues first, then run View Insights |
| "Explore Cards don't show the patterns I expected" | A card to the right of a filtered card shows only the filtered rows (its header notes this), or the column has no card | Use Clear filters, and check you added the columns you want |
| "The tools give different numbers" | Explore Cards and Metrics follow your explore filters; View Insights and the Data Quality Report don't | Clear the explore filters, or add a Conditional Filter task so every tool reads the same rows |
| "I don't have time to run all four" | Quick overview: Explore Cards. Briefing: View Insights and Metrics. Production check: Data Quality Report. Full analysis: all four in sequence |
Related
- How the pipeline works: where your explore findings become repeatable tasks.
- Filter rows: the Conditional Filter task that explore filters turn into.
- Create a dashboard: show your metrics and charts to others.
Something wrong? support@mammoth.io