Build dashboards in Mammoth with AI
Dashboards turn the data in your Mammoth project into interactive, shareable reports, built through a conversation with AI. You describe what you want to see, and the AI builds a styled dashboard from your columns. Open them from Dashboards in the left sidebar; anyone who builds or shares reports can use this section, and you need edit rights in a project to create one there.
Which page do I need?
| I want to... | Go to |
|---|---|
| Build my first dashboard from my data | Create a dashboard |
| Rebuild a Power BI, Tableau, PDF or screenshot report | Import an existing report |
| Start from a finished design on sample data | Start from a template |
| Change a dashboard by asking the AI | Edit with AI in the dashboard editor |
| See or swap the data a dashboard reads | See the data behind a dashboard |
| Add a chart or pick the right chart type | Add and change charts |
| Change a chart's fields, Top N or axes | Set up a chart |
| Style a chart, add a target line or a caption | Chart style, annotations and captions |
| Let readers filter, drill down or see rows | What readers can do with a chart |
| Draw a chart the library doesn't have | Custom charts |
| Edit a table, KPI cards, key insights or a note | Tables, KPI cards, insights and text |
| Change the header or add a cover page | Title band and cover page |
| Add filters for readers | Filters |
| Split a dashboard into pages | Pages and navigation |
| Change colours, fonts and layout style | Themes |
| Write a doc or a slide deck instead | Docs and slides |
| Let readers ask questions or dig through rows | Explore and Q&A pages |
| Teach the AI my terms and goals | Give the AI context |
| Search, tag, sync, archive or delete dashboards | Manage your dashboards |
| Rebuild a dashboard on new data, copy it, or export it to Power BI or Tableau | Change data, copy or export |
| Fix a dashboard that won't load or update | Fix dashboard problems |
| Publish and share a dashboard | Publish and share a dashboard |
Find your dashboards in the library
The Dashboards page has three tabs: Dashboards, Context and Templates. The Dashboards tab lists everything you can open. It is a searchable library with a shelf of collections on the left. Select a row to open a details panel.
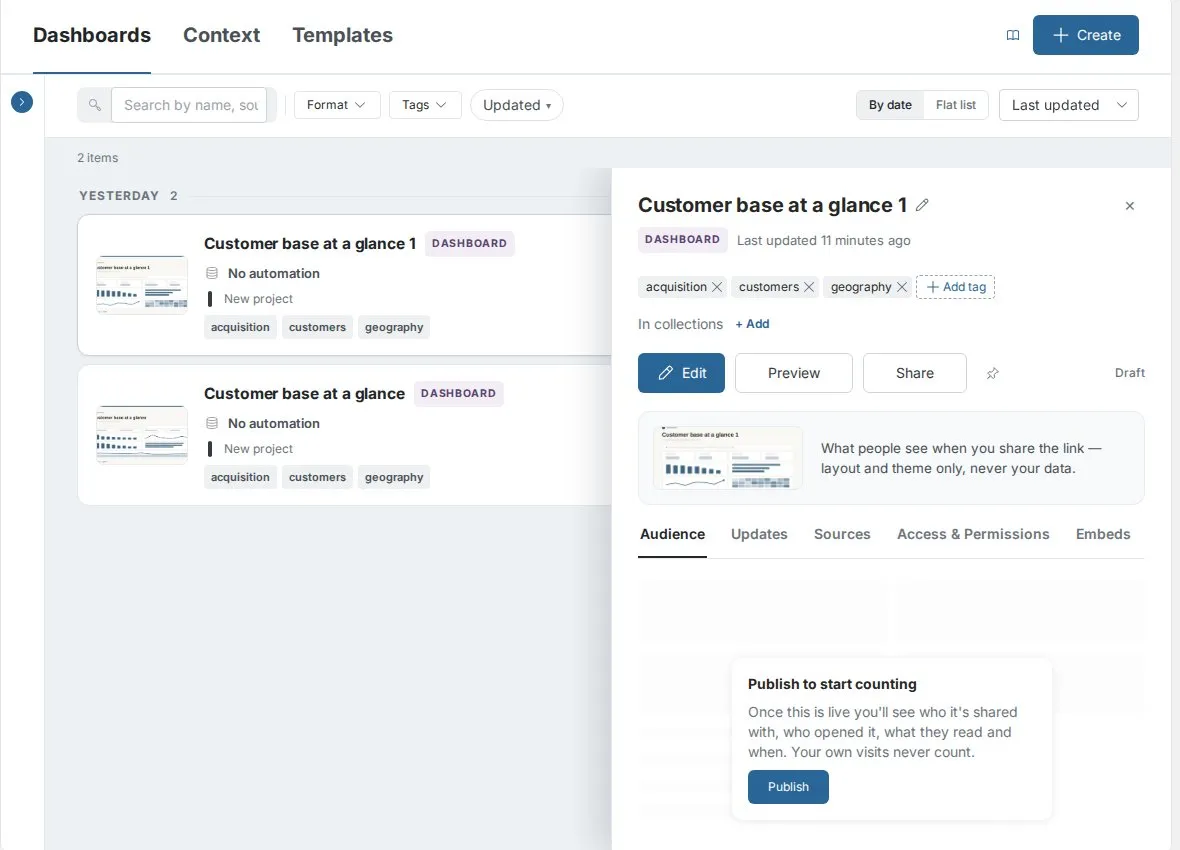
What you can do with Mammoth dashboards
- Create with AI: Pick your data, choose a format and describe what you want. The AI builds it from your columns. See Create a dashboard.
- Build five formats: Each item in the library is a Dashboard, Doc, Slides deck, Q&A page or Explore page. See Docs and slides and Explore and Q&A pages.
- Start from something that exists: Use a template, copy one of your own, or bring a report over from a PDF, a screenshot, Power BI, Tableau, Markdown or plain text.
- Edit with AI or by hand: Ask the AI chat for changes, or edit charts, tables, KPI cards and text, and the title band and cover directly.
- Filter and explore: Add chips, checklists, dropdowns, search boxes, range sliders and a playable date timeline. See Filters.
- Organise across pages: Group charts into pages, including pages built on other tables. See Pages and navigation.
- Give the AI context: Attach definitions, goals and reference files so the writing matches how your business talks. See Give the AI context.
- Choose a style: Pick a system style or build your own from your logo or website, in light or dark mode. See Themes.
- Publish and share: Share with signed-in users, anyone with the link, or anyone with the link and a password. Send email updates, embed it in a web page, and see who reads it in audience and engagement.
- Manage: Search, filter, tag, pin, archive and group dashboards into collections. See Manage your dashboards.
How Mammoth builds a dashboard from your data
You pick the data a dashboard is built on. The AI reads its column names, data types and sample values. It then suggests the most relevant charts and filters for your data. You refine the result in the editor with the AI chat, the Design tab and the Add menu.
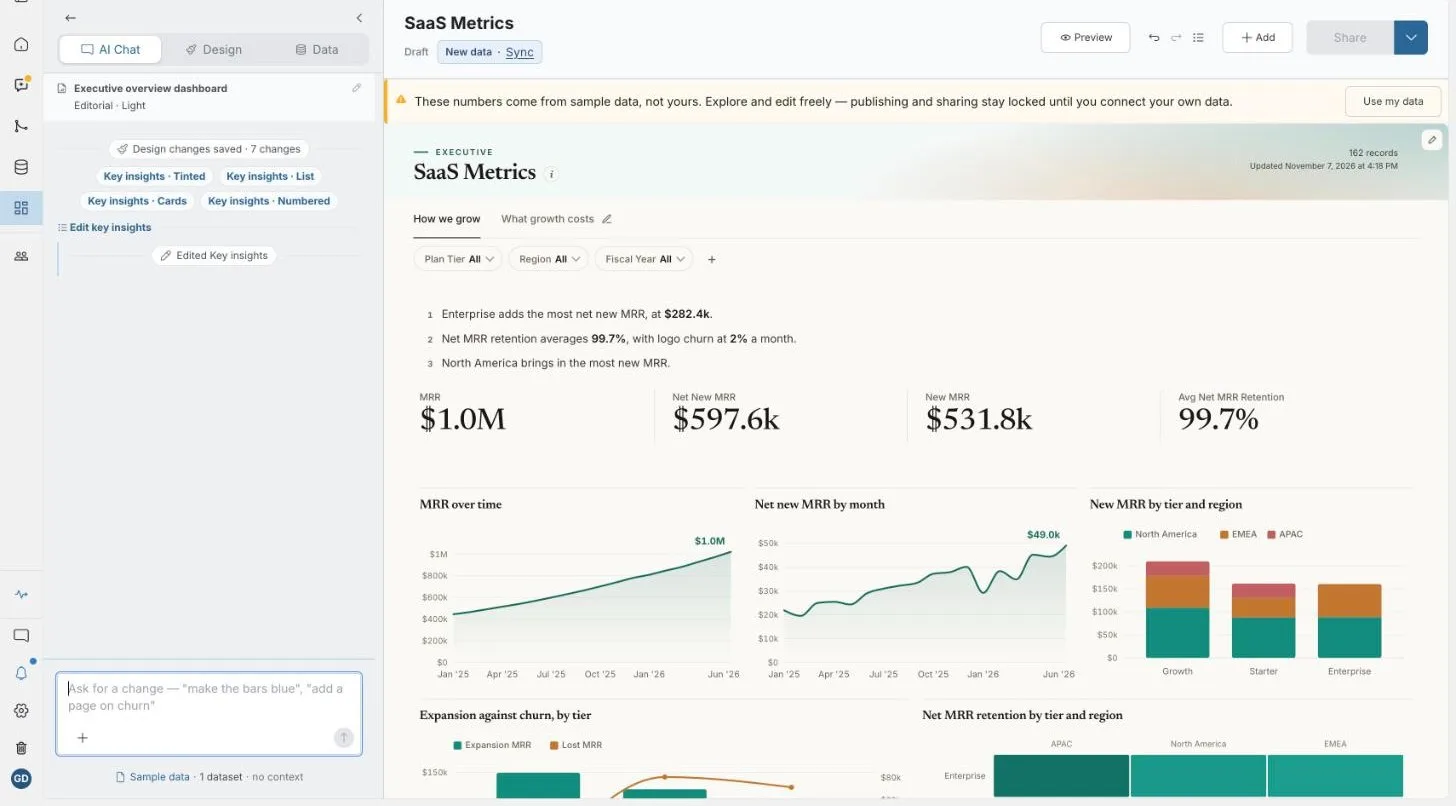
Dashboards compared with Views and Published Views
A View is the prepared version of your data in a project. A Published View shares that raw data.
| Dashboards | Views | Published Views | |
|---|---|---|---|
| Purpose | Interactive visualization | Data preparation | Raw data sharing |
| AI-built | Yes | No | No |
| Shareable externally | Yes (3 modes) | No | Yes |
| Interactive filters | Yes | N/A | No |
| Best for | Executive reports, stakeholder updates | Data cleaning, transformation | Data exports |
Who can see a dashboard
Everyone in a dashboard's project has access to it. You can also invite people outside the project by email. Or publish it as Anyone with the link or Anyone with the link and password, for clients and external stakeholders who don't have Mammoth accounts. Invited people are always viewers. See Publish and share a dashboard.
Related
Sharing lives in its own section:
- Publish and share a dashboard: publish, share by sign-in, link or password.
- Row-level security: show each reader only their rows.
- What viewers see: the reader's side, on desktop and phone.
- Email updates: send the dashboard by email on a schedule.
- Audience and engagement: who read it and what they asked.
Something wrong? support@mammoth.io