See running, stuck and paused work in Monitor
Click Monitor at the bottom of the left sidebar, then the Running tab for what is executing or queued, or Paused for what has Auto-sync turned off. Monitor refreshes every 5 seconds while open, so items that finish between polls disappear on the next refresh. For items waiting on you, see Monitor.
See what is running now
The Running tab lists all pipeline Views, export tasks and automations running or queued. With nothing running and no Active Retentions, it shows a checkmark, "Nothing running" and "No tasks are processing right now." Otherwise a banner appears at the top:
| Banner | Meaning |
|---|---|
| Executing (green dot) | Tasks are running and progressing normally |
| Stuck (red dot) | One or more tasks have run past their thresholds. The banner reads "All active pipeline and export tasks across the workspace appear here. Tasks that have been running for an unusually long time may be marked as stuck." |
Each row shows the item name (a link to the Data Editor), a status pill and detail text. Only pipeline rows have a Show in workflow icon button, and automation names aren't links.
| Status | What it means |
|---|---|
| Queued | Waiting its turn. It starts automatically |
| Executing | Processing right now |
| Waiting for Worker | Sent, but no worker has picked it up yet |
| Registering Lock | Taking a resource lock before processing |
| Waiting for Lock | Another task holds the lock. It starts when released |
| Stuck | The task has likely hung |
Automation progress and task types
| Phase | Text shown |
|---|---|
| Collecting files | 12 file(s) collected |
| Validating | Validating 4 / 12 files |
| Appending | Appending 12 files |
| Finalizing | Finalizing... |
| Label | What it is |
|---|---|
| Dataset Refresh | A scheduled cloud dataset refresh |
| Data Consolidation | A file consolidation run |
| File Collection | A cloud storage file retrieval run |
| Messaging | A scheduled email send |
| Add File as Batch | Adding a file as a new data batch |
| Delete Batches | Batch cleanup |
| Cloud Storage Retrieval | Fetching files from cloud storage |
| Run Pipeline | Pipeline execution |
| Tag File | File tagging during retrieval |
Active retentions
Below the task rows, Active Retentions lists running data retention policies: the dataset name, Deleting or Suspending with the rule, and a progress bar of affected batches out of the total. A search box filters by dataset name.
Fix a task marked Stuck
Mammoth marks a task Stuck when it is unlikely to finish on its own:
| Condition | Threshold |
|---|---|
| Waiting for Worker | More than 10 minutes |
| Registering Lock | More than 5 minutes |
| Executing | More than 5 hours |
| All tasks Waiting for Lock, none younger than 5 minutes | Straight away |
- For a pipeline or task row, click the View name to open the View.
- Look for the This pipeline has errors banner and the failing task it points to. For an automation, open it from Data Library > Automations and read its Last run result (for a Data Consolidation, also its History).
- Fix the cause. Common causes are expired connector credentials, a deleted source dataset, or a schema change upstream.
- Return to Monitor to confirm the next run clears.
The Activity Log records who changed what, not run errors, so it won't show why a run is stuck.
See what has Auto-sync turned off
The Paused tab lists pipeline tasks, exports, Mammoth Managed DB publishes and live links with Auto-sync off. Upstream changes don't flow through them, so downstream datasets may be stale. The tab notes: "Items intentionally paused via Auto-Sync controls. These are working as configured. Review them periodically to ensure nothing is left paused accidentally."
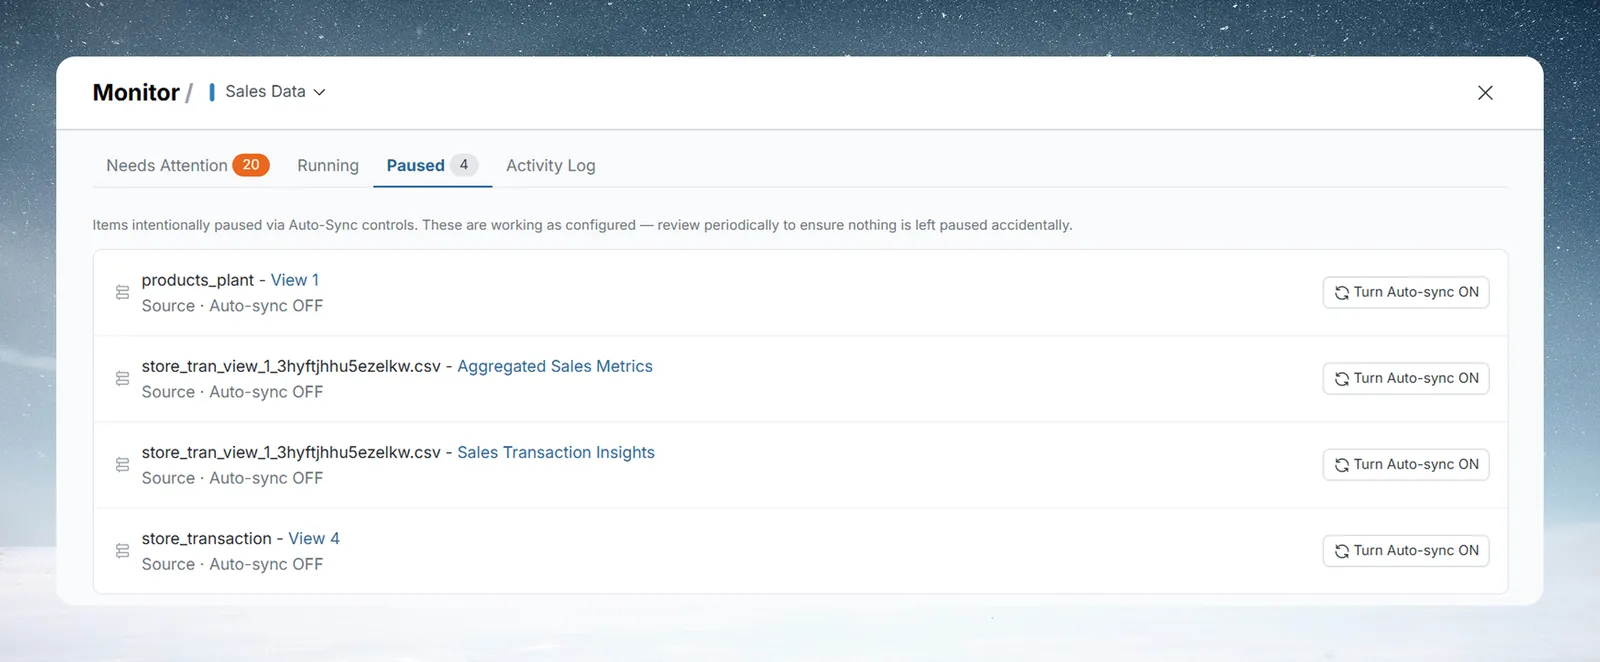
Each row shows the dataset and View name (a link), the operation type with "Auto-sync OFF", Paused since with the date, and Turn Auto-sync ON, sorted by dataset name, then View name. With nothing paused, the tab shows "Nothing paused" and "Every task is syncing automatically."
Row types are Join, Lookup and Crosstab tasks, Send to Dataset (a task that sends data to another dataset), Export (connector name) (for example Export BigQuery or Export Snowflake), Mammoth Managed DB (a View published as a Mammoth Managed database) and Live link (a published live data link).
Turn Auto-sync back on
- Check that the upstream data is still structurally compatible. Otherwise the task may error straight away.
- Click Turn Auto-sync ON. The button is disabled and the status reads "Auto-sync on, syncing now" while the change applies.
- The row clears once sync is active.
Troubleshooting
| Symptom | Cause | Fix |
|---|---|---|
| A pipeline you started isn't in Running | Monitor refreshes every 5 seconds, and fast pipelines can finish before the next poll | Check the View itself |
| An automation appears Stuck in Running | Expired Live Connection credentials, a deleted source dataset, or a file format change in the source folder | Open it from Data Library > Automations and read Last run result. For a Data Consolidation, its History lists each file and why it didn't go in |
Related
- Monitor: act on items in Needs Attention.
- Control when Views update with Auto-sync: what Paused items mean.
- Read automation statuses: Last run result and History.
- Manage automations: suspend or edit a stuck automation.
Something wrong? support@mammoth.io