Use Mammoth's explore tools together on a dataset
Explore Cards, the Metrics panel, View Insights and the Data Quality Report answer different questions, so most work uses them in sequence. Pick the sequence for your situation below, then turn what you find into pipeline tasks. Which tool to start with, and what each does on its own: Compare the explore tools.
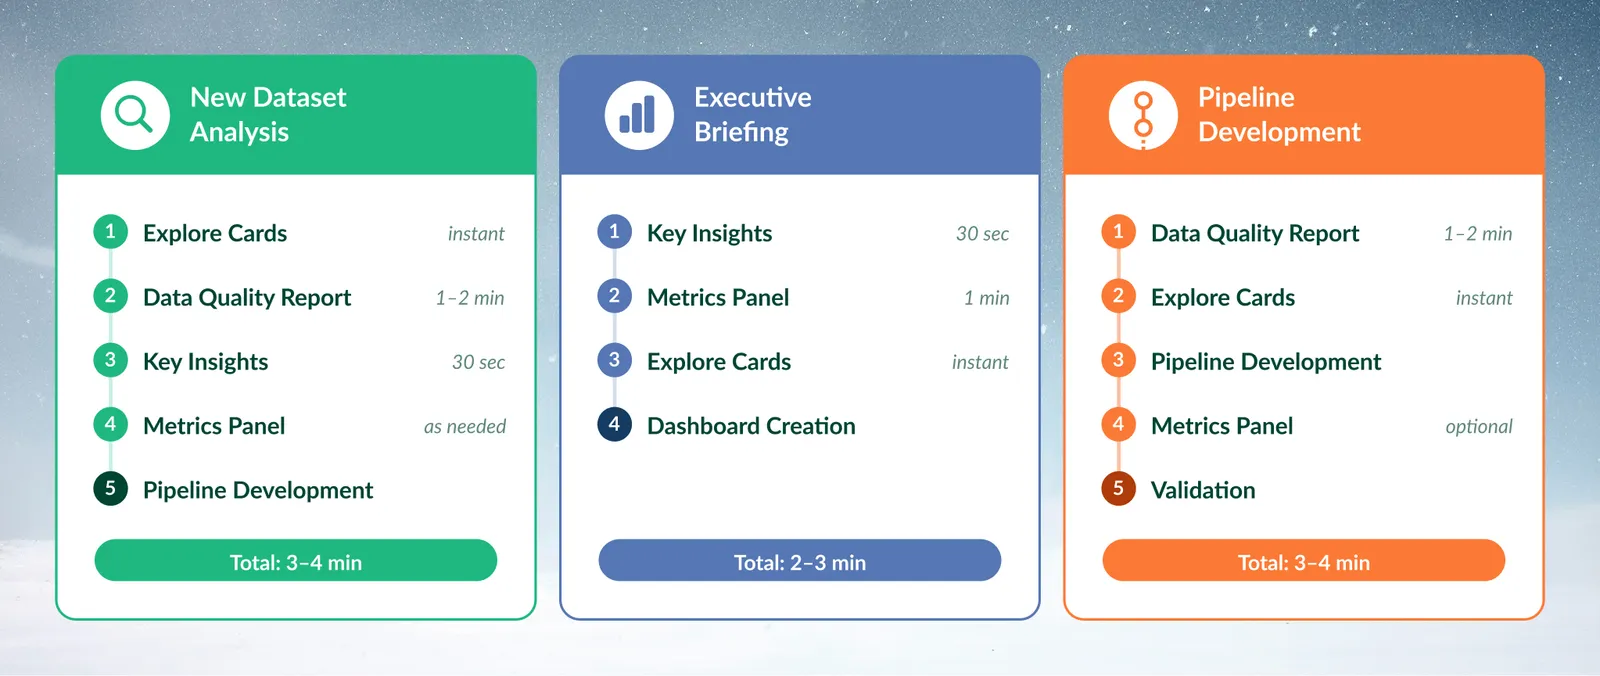
Combine the explore tools in a workflow
| Step | New dataset | Briefing for a manager or board | Production pipeline |
|---|---|---|---|
| 1 | Explore Cards to see structure and distributions | View Insights for the main trends | Data Quality Report to find what needs fixing |
| 2 | Data Quality Report to check the data is ready | Metrics panel for the numbers behind each point | Explore Cards to understand the columns you will transform |
| 3 | View Insights to find business patterns | Explore Cards to confirm the patterns visually | Build the pipeline tasks |
| 4 | Metrics panel for the KPIs you need | Build a dashboard from the metrics | Metrics panel (optional) for success measures |
| 5 | Turn what you found into pipeline tasks | Run the tools again to confirm the improvement |
To check a finding, use more than one tool. For example, View Insights says "Revenue grew 23% in Q3". Filter to Q3 in Explore Cards, calculate month-over-month growth in Metrics, then check revenue completeness in the Data Quality Report.
Examples by industry
| Industry | Sequence |
|---|---|
| Financial services, monthly regulatory reporting | Run the Data Quality Report for completeness and accuracy, check unusual transactions with Explore Cards, calculate key ratios in Metrics, then use View Insights for a summary for the compliance team |
| Manufacturing, production line analysis | Check defect rates by product line with Explore Cards, let View Insights point out patterns, calculate yield in Metrics, then confirm sensor data with the Data Quality Report |
| Hospitality, revenue management | Use View Insights for seasonal patterns, filter peak and off-peak periods with Explore Cards, calculate occupancy, RevPAR and ADR in Metrics, then check booking data completeness with the Data Quality Report |
Turn what you find into action
| Finding | What it becomes |
|---|---|
| Explore Card filters | A Conditional Filter task or a new View. See Save explore filters |
| An Explore Card's chart | A dashboard tile, from its More options menu (Add to dashboard…) |
| Data Quality Report recommendations | Tasks you build in the pipeline. Scores work as quality gates in your pipeline process |
| View Insights patterns | Leads to research with Explore Cards. Copy the text for documentation or talking points; the output can document a dataset |
| Metrics | Dashboards |
Findings from any tool can be copied or screenshotted for stakeholders.
Related
- How the pipeline works: where your explore findings become repeatable tasks.
- Filter rows: the Conditional Filter task that explore filters turn into.
- Create a dashboard: show your metrics and charts to others.
Was this page helpful?
Something wrong? support@mammoth.io