Add a colour scale to a number or date column
A Color Scale in Conditional Highlights colours a number or date column with a gradient based on its range, to show distributions and rankings. Like other highlights it doesn't change your data and is saved to the View. For single-colour rules, see Highlight cells and rows with colour.
Create a colour scale
- Click New conditional highlight.
- Click the Color Scale tab.
- Pick a column. Only visible Numeric and Date columns are listed.
- Pick a scale preset.
- For a 3-colour scale, optionally set Colors change at to move the midpoint.
- Optionally enter Min and Max to replace the detected range.
- Click Save highlight.
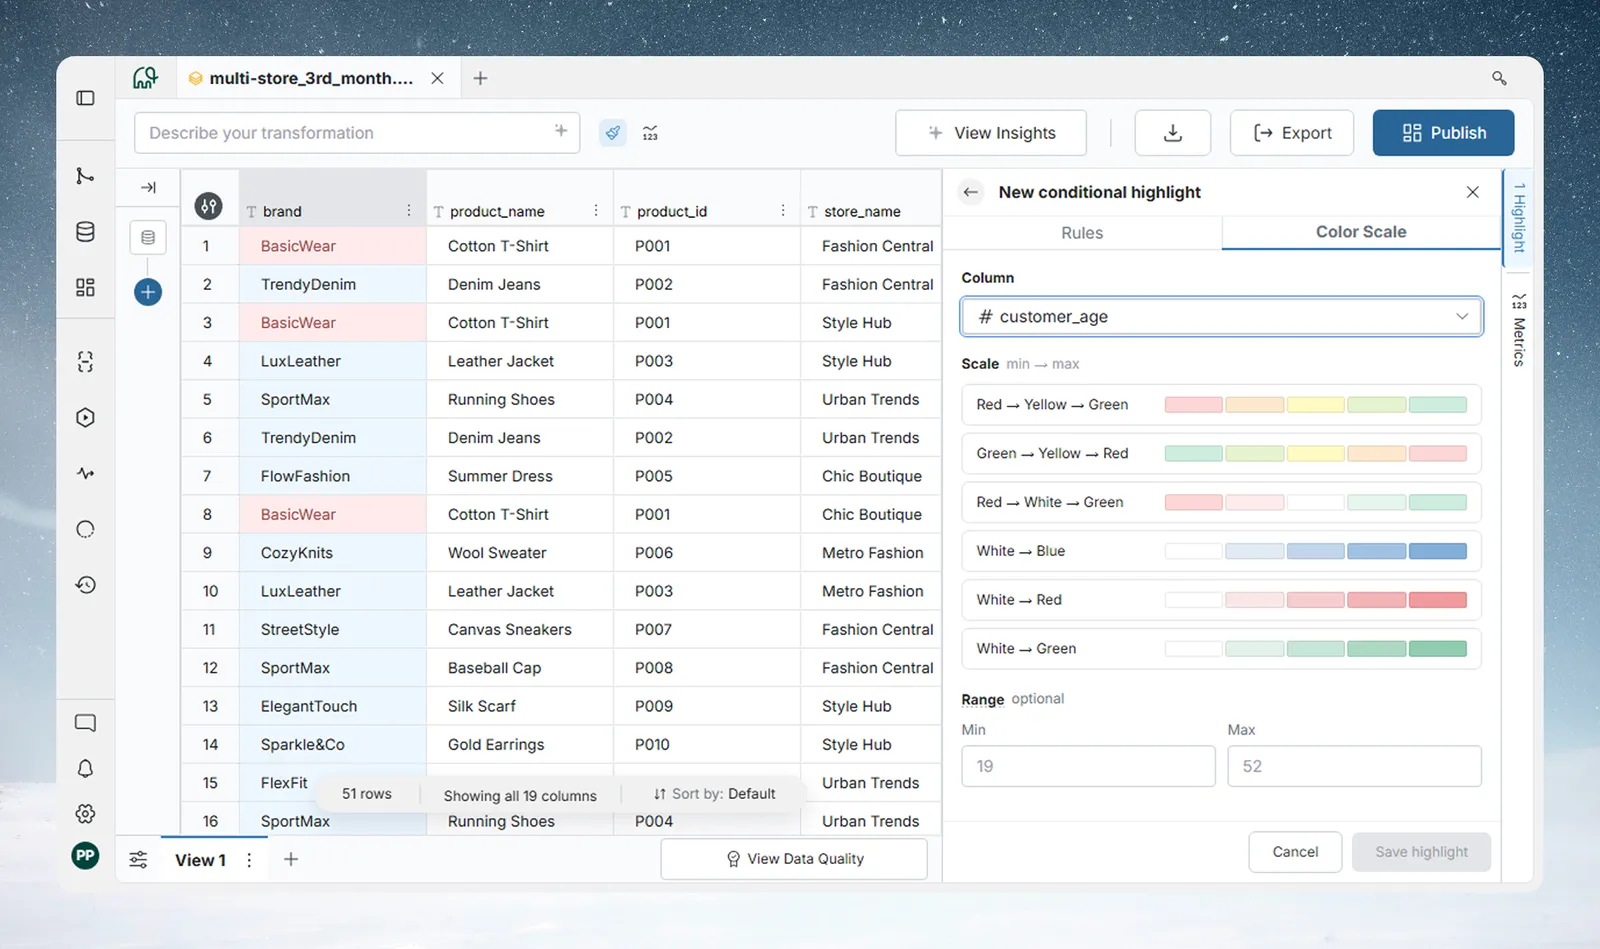
| Preset | Low value | Mid value | High value | Colors change at |
|---|---|---|---|---|
| Red → Yellow → Green | Red | Yellow | Green | Yes |
| Green → Yellow → Red | Green | Yellow | Red | Yes |
| Red → White → Green | Red | White | Green | Yes |
| White → Blue | White | None | Blue | No |
| White → Red | White | None | Red | No |
| White → Green | White | None | Green | No |
Colors change at sets where the middle colour sits. It takes a number for Numeric columns and shows a date picker for Date columns. Leave it blank to split the gradient evenly.
By default the scale uses the column's own minimum and maximum, shown as the Min and Max placeholders. Enter your own to keep colours the same across Views or over time.
Troubleshooting colour scales
| Symptom | Cause | Fix |
|---|---|---|
| A column is missing from the Color Scale list | Only visible Numeric and Date columns are listed | Show the column, or convert it to a number or date |
A Color Scale placed above a Condition Rule colours every value in its column: see Which highlight rule wins.
Related
- Highlight cells and rows with colour: open the panel and manage rules.
- Convert text to dates and numbers: make a column numeric so it can take a scale.
- Browse columns: show a hidden column.
Something wrong? support@mammoth.io