Explore Cards: see column values and filter the grid
Explore Cards show what is inside a column: the distinct values of a text column, the spread of a number column, or the timeline of a date column. Open them with the Explore toggle in the action bar of the data editor, add a card with Add card, then click values to filter the grid. Anyone who can open the View can read the cards; you need edit access to the workspace to filter.
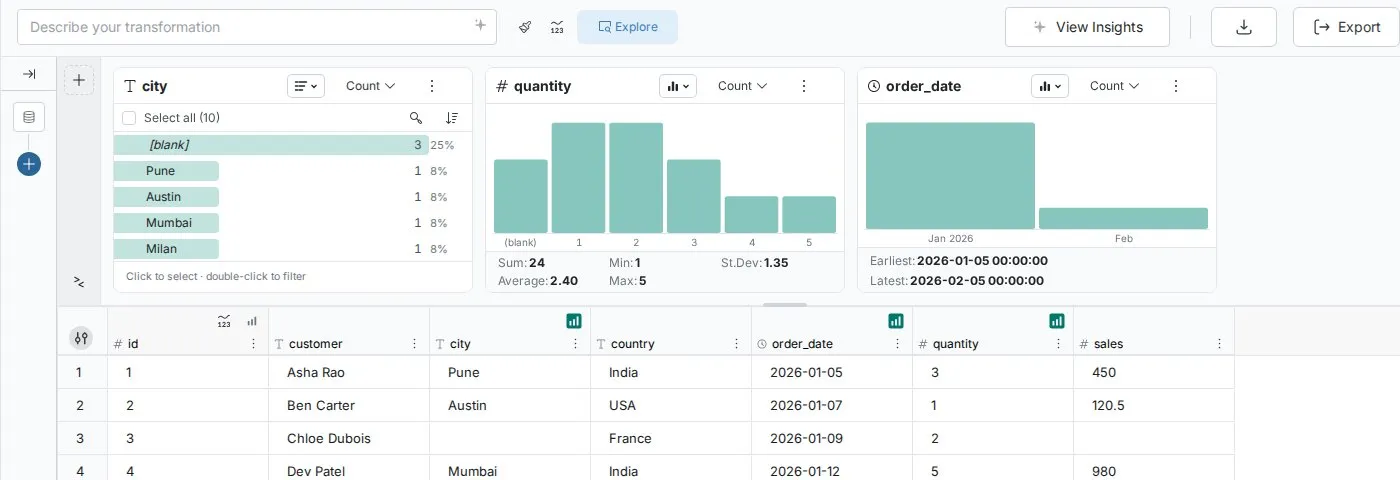
Open the Explore panel
The Explore panel sits above the data grid. The Explore toggle in the action bar shows or hides it. When explore filters are on, a filter badge with a count appears beside the toggle, and each filtered card shows its filter as a pill in its header.
A View with no cards shows No cards yet and the hint "See what's in any column, then click values to filter the grid." Mammoth may offer a few Suggested columns to start from.
Each card queries the View, so it describes the View's data after its pipeline.
Add, move and remove Explore Cards
Mammoth remembers the cards you add for the View.
- Click Add card on the left of the panel. The Explore a column list opens.
- Find a column with Search columns.
- Select it. A card for that column appears.
You can also add several columns at once from the Column Browser with Open in Explore Columns. See Browse columns.
To arrange the cards:
- Drag a card by its header to reorder it.
- Drag a card's edge to change its width.
- Close a card with Close card.
- Resize the panel by dragging its edge, or choose a panel height (small, medium or large).
The Add card menu also adds three other kinds of card:
| Menu entry | Card | What it does |
|---|---|---|
| Describe a filter in plain words | Ask | Turns a sentence such as "channel is Amazon and quantity over 2" into filter rules |
| Search all columns | Search | Finds a word or number in every column and highlights the matches in the grid |
| Compare two number columns | Compare | Plots one number column against another |
How to use each one: Ask, Search and Compare cards.
Card types for text, number and date columns
Each column card matches its column's data type. Switch views with the chart type dropdown in the card header.
| Column type | Default view | Other views | Below the chart |
|---|---|---|---|
| Text | Ranked list of distinct values by frequency, with a bar and percentage share | Donut, Treemap | |
| Number | Bar chart of value ranges (Columns) | List | Sum, Min, St.Dev, Average, Max |
| Date | Bar chart of time periods (Columns) | Timeline, List | Earliest, Latest |
Every control on each card is on Text, number and date cards.
Spot data quality problems with Explore Cards
- Blank values appear as a
(blank)row on text cards, so gaps are visible at once. - Outliers stand out at the ends of number bar charts.
- Missing time periods show as gaps in date charts.
After you load new data, scan the cards for your key columns as a quick quality check. For a scored check, use the Data quality report.
Select values with a click, filter with a double-click
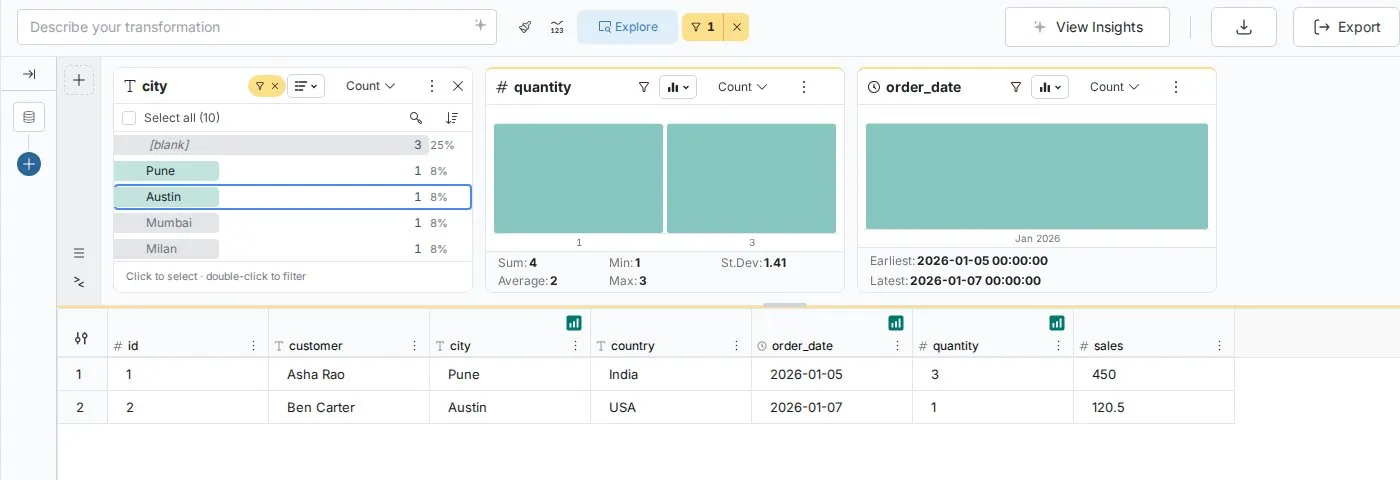
A single click selects a value without filtering. A double-click filters at once.
Select values first, then filter or exclude
When you click a value:
- The value is marked as selected (a checkbox in list views, a highlighted bar in chart views).
- A selection bar shows how many values and rows are selected, with Filter, Exclude and Clear selection buttons.
- The grid does not change yet.
To select more than one value:
- Click more values. A plain click toggles a value on or off.
- Shift-click to select a run of values from the last one you clicked.
- Drag across bars in a chart view to select a range.
- In list views, use Select all or Invert.
Then choose:
- Filter (or press Enter): show only rows with the selected values.
- Exclude: hide rows with the selected values.
- Clear selection (the × button, or press Esc): deselect everything.
Selecting first is useful when you want to check the row count in the selection bar before filtering, or open Bulk Replace on suspicious values without filtering.
Double-click to filter at once
When you double-click a value:
- The filter is applied with no confirmation.
- The card shows a Filtered chip (or Excluding, if you used Exclude), and the badge beside the Explore toggle updates.
- The grid shows only the matching rows.
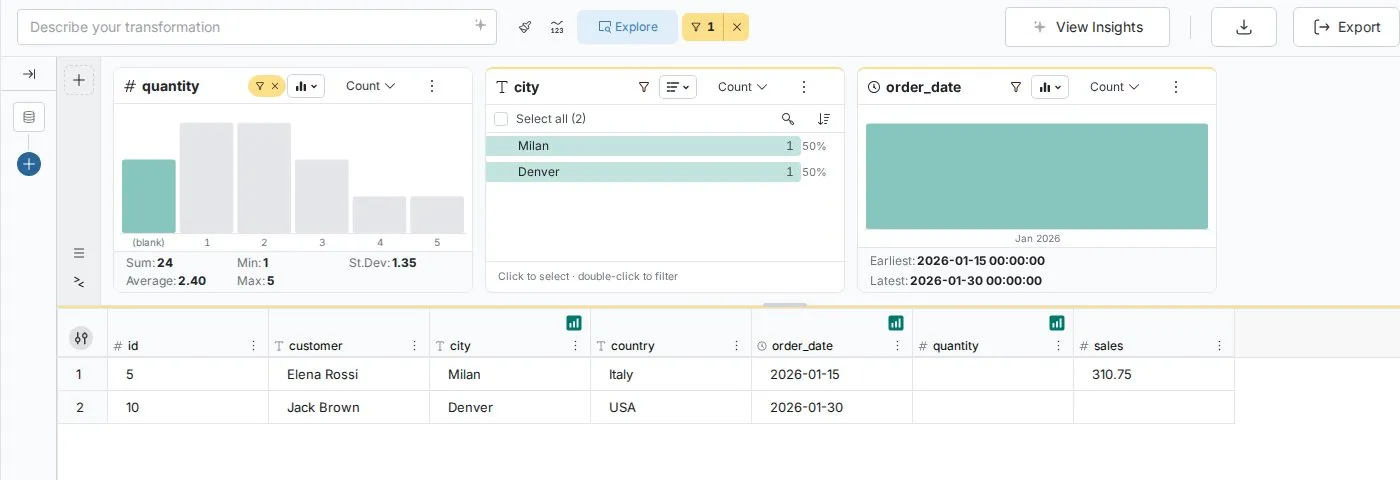
- The cards to the right recalculate on the filtered rows.
In chart views, double-clicking a bar also drills into it. A Drill path appears so you can step back to All.
Worked example: find the cause of a defect spike
Each filter narrows the rows the next cards describe. This is called progressive discovery.
- Double-click "Fabrication Line Beta" on the line_name card. The grid drops from 2,847 rows to 892.
- Read the cards to the right. The shift card now shows Day 60%, Evening 25%, Night 15%. The defect_severity card shows Critical 35%, which is unusually high. The date card shows a spike in the weeks of March 15–22.
- Double-click "Critical" on defect_severity. The operator_name card now shows 3 operators behind 80% of critical defects.
Other patterns that work the same way:
- Category, then numbers: double-click "Enterprise" in customer_tier; the revenue card to its right shows the Enterprise revenue spread.
- Time, then category: double-click "Q4 2024" on a date card; the product_category card shows Q4 performance.
- Outliers: double-click the highest bar on an amount card; the customer_name and region cards show who and where.
- Several filters: "West" (3,200 rows), then "Electronics" (1,850), then "Q4 2024" (420).
Common investigations with Explore Cards
- Inconsistent values: spot variants such as "Apple Inc.", "Apple Inc" and "Apple Incorporated" on a text card, click them, then use Replace all values like this (Bulk Replace) to standardize.
- Outliers: double-click an extreme bar (for example prices at $999,999), check the other cards for date, category and source, then decide whether to exclude the rows with a Conditional Filter.
- Time patterns: double-click a spike on a date card and read the cards to its right for the cause; save the period as its own View if you need it again.
- Segments: filter by a main attribute, refine with more filters, then save the segment as a View or a task.
Shortcuts in the card's More options menu
The card's More options (⋮) menu offers shortcuts. With values selected, and when you can edit the View, it opens the matching function in the Functions panel with your selection filled in, so you can review it before applying.
| Menu item | Text columns | Number and date columns |
|---|---|---|
| Replace all values like this | Opens Bulk Replace | Opens Label & Insert Values |
| Remove all values like this | Opens Conditional Filter set to remove | Opens Conditional Filter set to remove |
| Keep all values like this | Opens Conditional Filter set to keep | Opens Conditional Filter set to keep |
For all column cards, the menu also has:
- Add to dashboard…, when you can create or edit dashboards in the project. See Add an Explore Card to a dashboard.
- Copy values to clipboard: copies the selected values with their counts, or every value if none is selected, as tab-separated text. Ctrl+C does the same when values are selected.
- Export list as CSV.
- Export Image as PNG (chart views only).
Manage and clear explore filters
The filter badge beside the Explore toggle shows how many explore filters are on, including Search, Ask and Compare cards. It shows whether or not the panel is open. The × beside it clears all explore filters.
Click the badge to see the list. Each row shows the column and what it is filtered or excluded to, in plain words, such as region and West.
How several filters combine
- Several cards use AND: filtering
regionto West,product_typeto Electronics andstatusto Active shows only rows matching all three. - Several values on one card use OR: selecting "Active" and "Pending" on status and clicking Filter shows rows with either value.
Why card order matters
Cards filter the cards to their right. When you change or clear a filter on a card, filters on the cards after it are cleared, because those cards were showing values from the earlier selection. A card with a filter moves toward the front of the row. A card showing a subset because of an earlier card's filter has a filter icon in its header.
Remove filters
- One filter: use Clear this card's filter (the close button in the badge list, or on the card's Filtered chip).
- All filters: click Clear filters in the badge list, or the × beside the badge.
Save explore filters as a pipeline task or a new View
Explore filters are temporary. To keep the logic, click the Use these filters button (⋮) beside the filter badge. It shows only while explore filters are on, and not in preview mode.
| Option | What happens | Choose it when |
|---|---|---|
| Create New View with these filters applied | A name box opens (default "Filtered View"); click Submit. A new View in the same dataset opens with your filters applied. The original View is unchanged | Several people need this segment, or it is a regular business segment such as "Enterprise Customers West Coast" |
| Convert these filters into a Task in the Pipeline | The Functions panel opens with a Conditional Filter filled in from your filters. Review it and apply it; the task then runs with the pipeline | You want to change the current View for good, or the filters are data quality rules |
Explore filters compared with Conditional Filter tasks
| Explore filters | Conditional Filter tasks | |
|---|---|---|
| Purpose | Exploration and investigation | Automated data processing |
| Created by | Explore Card clicks | The Transform menu, or converting explore filters |
| Where you see them | The filter badge and chips on cards | Tasks in the pipeline panel |
| Scope | What the grid and cards show while you explore | Part of the pipeline; runs on every data refresh |
| Best for | "Let me look at this segment" | "Always exclude test data from this View" |
More on the task: Filter rows.
Add an Explore Card to a dashboard
You can turn a column card into a dashboard tile. Open the card's More options menu and choose Add to dashboard…. The dialog is titled Add "column" to a dashboard, with the column's name.
Who can use it: the item shows to people who can edit the View's pipeline. It is greyed out, with the tooltip "You can't create or edit dashboards in this project.", when your project role does not let you create or edit dashboards. The Ask, Search and Compare cards can't be added: they filter rows and have no chart.
Choose the dashboard and page
Under Dashboard, pick Existing or New dashboard.
| Option | What it does |
|---|---|
| Existing | Lists the dashboards built on this View that you can edit, most recently edited first. Use Search dashboards to find one, and Open to look at it in a new tab. A note under the list says how many other dashboards are hidden because they use a different View or you can only view them |
| New dashboard | Creates a dashboard on this View. Title starts as the View name followed by "Explore". The name must be new in the project, or you see "A dashboard with this name already exists in this project." |
A dashboard reads from one View, so a card can only go on a dashboard built on the same View. If there is none you can edit, the dialog opens on New dashboard and explains why. If there is exactly one, it is picked for you.
For an existing dashboard, choose under Page:
- New page: adds a page, named From Explore unless you type another name.
- Existing page: adds the tile to a page you pick from the list.
If the dashboard already has a page with the name in the New page box, the dialog picks that page under Existing page, so repeat adds collect on one page. A new dashboard gets the tile on its first page.
The line at the top confirms where the tile goes, for example "Adding to Sales board → page "From Explore" · as a draft". The button names the dashboard: Add to "dashboard" or Create "dashboard" and add.
How each card becomes a tile
The right side previews the tile, with its title (for example "Count by city") and "All of" the View name. Notes under the preview list what changes.
| Card | Tile |
|---|---|
| Text, list view | Horizontal bar chart of the top 10 values. If you sorted the card by name, the tile picks the top 10 by value and shows them by name |
| Text, donut view | Donut chart: top 7 values plus Other |
| Text, treemap view | Treemap: top 24 values plus Other |
| Date, columns or list view | Bar chart over time |
| Date, timeline view | Line chart |
| Number, any view | Bar chart of the card's ranges. The ranges are fixed when you add the tile: later values outside them land in the first or last bar |
Dashboards group dates by month, quarter or year. A card grouped by day, hour, minute or second becomes a month tile, and the note says so. The tile keeps the card's Show values by setting (count, distinct count, sum, average, min, max or std dev).
What does not carry over:
- Explore filters: the tile shows the whole View. The note reads, for example, "Your 2 explore filters aren't added to dashboards."
- Drilling in: a card you drilled into shows every value on the tile.
- Unrun steps and preview: dashboards show the View's last run. A banner warns you if the View has steps that haven't run, or if you are previewing an earlier step.
After you add the tile
The tile goes into the dashboard's draft, so viewers don't see it until you publish. A message confirms "Added to" the dashboard and page, with an Open link that opens the dashboard in a new tab with the tile highlighted. The data editor stays where it was.
If the add fails, the dialog says why, for example "Couldn't add the tile. The dashboard is being saved by someone else. Try again." If a new dashboard was created but the tile wasn't added, adding again puts the tile on that dashboard instead of creating a second one, and Open the empty dashboard opens it.
Troubleshooting Explore Cards
| Symptom | Cause | Fix |
|---|---|---|
| Double-click doesn't filter | Two slow clicks count as two clicks, which toggle the selection on and off | Double-click quickly, on the value itself rather than the space around it, or click Filter to apply the selection |
| You can't filter at all | Filtering needs edit access; it is unavailable in view-only workspaces | Ask a workspace admin for edit access |
| Other cards don't recalculate | Only cards to the right of the filtered card recalculate | Drag the card you want to study to the right of the filtered card, and check the badge shows the filter |
| A filter shows different rows than expected | The filter list doesn't match what you meant, or the values are spelled differently in the data | Open the badge list and check each row; select values first and check the row count before filtering |
| A card shows only some rows | A filter on an earlier card applies (filter icon in its header) | Use Clear filters to see the full spread |
| The display seems stuck | Refresh the View, or remove and re-add the filter |
Related
- Text, number and date cards: every control on each card type.
- Ask, Search and Compare cards: filter by a sentence, a search term or a box on a scatter plot.
- Browse columns: open several columns as cards at once.
- Metrics: numbers that update as you filter.
- Filter rows: the Conditional Filter task your explore filters become.
- Find and replace values: Bulk Replace, opened from a text card.
- Add and change charts: edit the tile once it is on a dashboard.
Something wrong? support@mammoth.io