Publish and share a Mammoth dashboard by link
Publishing makes a live version of a dashboard at a link you can share with teammates, clients or anyone else. Open the dashboard in the editor and click Publish (or Share once it's live) in the header to open the Share panel. Editors of the dashboard (members of its project) can publish and share it.
Open the Share panel
- Open your dashboard in the editor and save your changes. You can't publish with unsaved changes.
- Click the primary button in the header. It reads Publish while the dashboard has something to publish, and Share when it's live and up to date.
The Share panel opens. Before publishing it reads Not published yet. The panel has two tabs at the top: Share and Embed.
Publish a dashboard
Click Publish to make the dashboard live. Click Publish & copy link to publish and copy the link in one step.
Once published, the panel shows:
- A Live badge and when it was Last published
- View, which opens the live dashboard
- The share link, with a Copy button
- An Audience row with the views and people in the last 7 days (see Audience and engagement)
- More ways to share, with the link preview, downloads and video
- Unpublish
What stops a dashboard from publishing
- Sample data. A template on sample data can't be published until you connect your own data (Use my data). See Start from a template.
- Plan limit. If your plan's published-dashboard limit is reached, unpublish another dashboard or upgrade. The limit depends on your plan.
Publish or discard unpublished changes
Once a dashboard is live, your edits don't reach viewers until you publish again. When the draft differs from what's published, the editor header shows a chip beside the Live pill, for example 3 unpublished changes, with a Publish part on its right. The Share panel lists the same Unpublished changes.
Click the chip to open Changes since last publish ("Viewers still see the last published version."). Each row shows:
- What changed, or "3 edits" when several edits are grouped
- Who made it ("Assistant edit" for changes made by the AI)
- How long ago ("just now", "5m ago", "2h ago", "yesterday")
Click a row to select that change on the canvas. Long lists end with "and 4 more". If the draft differs but no edit is named, the list reads "The draft differs from the published version, but no edit is listed by name. This happens after a layout change."
Publish the changes
Click Publish to make the changes live. When another author made some of them, the Share panel offers Let Priya know it's published, naming those authors.
Discard the changes
- Click Discard changes…. It only appears once the dashboard has a published version.
- Read the confirm. It reads, for example, "Discard 5 unpublished changes?" and "The draft goes back to the published version, the one viewers see now. Viewers aren't affected." It breaks the changes down by author ("3 changes by you", "2 by" followed by a teammate's name).
- Click Discard changes.
The toast reads "Draft reset to the published version" with Undo, so you can take it back straight away.
| Message | What it means |
|---|---|
| "The draft changed while you were deciding. Check the list again before you discard." | Someone else edited while the confirm was open |
| "Couldn't discard the changes. Nothing was lost." | The discard failed. Try again |
New data from the dashboard's sources can also go live without a manual publish. See Sync new data into a dashboard automatically.
Choose who can open the dashboard link
The panel shows who has access. By default, everyone in the dashboard's project does. The Access menu controls who else can open the published link.
| Option | Sign-in | Password | Invite viewers, row-level security and email updates |
|---|---|---|---|
| Sign-in required | Yes | No | Yes |
| Anyone with the link and password | No | Yes | No |
| Anyone with the link | No | No | No |
Sign-in required
Viewers must sign in to Mammoth. Everyone in the project has access, and you can invite people outside the project by email.
Best for: internal dashboards, sensitive business data, or when you want to control exactly who has access.
Anyone with the link and password
No sign-in is needed, but viewers must enter a password.
- In Access, choose Anyone with the link and password.
- Click Set password.
- Enter a password of 8 to 128 characters and click Save password.
- Share the link and, separately, the password with the people you want to let in.
To change it later, click Change password. A password link is not signed-in access, so you can't invite viewers or use row-level security on it. See What viewers see for the password screen.
Best for: board packs, client reports, and other external sharing where a bare public link is too open.
Anyone with the link
Anyone with the link can view the dashboard, including all of its data. No sign-in is required.
Best for: public data, or summaries you are happy for anyone to see.
Invite viewers by email
- Set Access to Sign-in required.
- Enter email addresses in Invite by email.
- Click the invite button. For a draft it reads Publish & invite: it publishes first, then sends the invite.
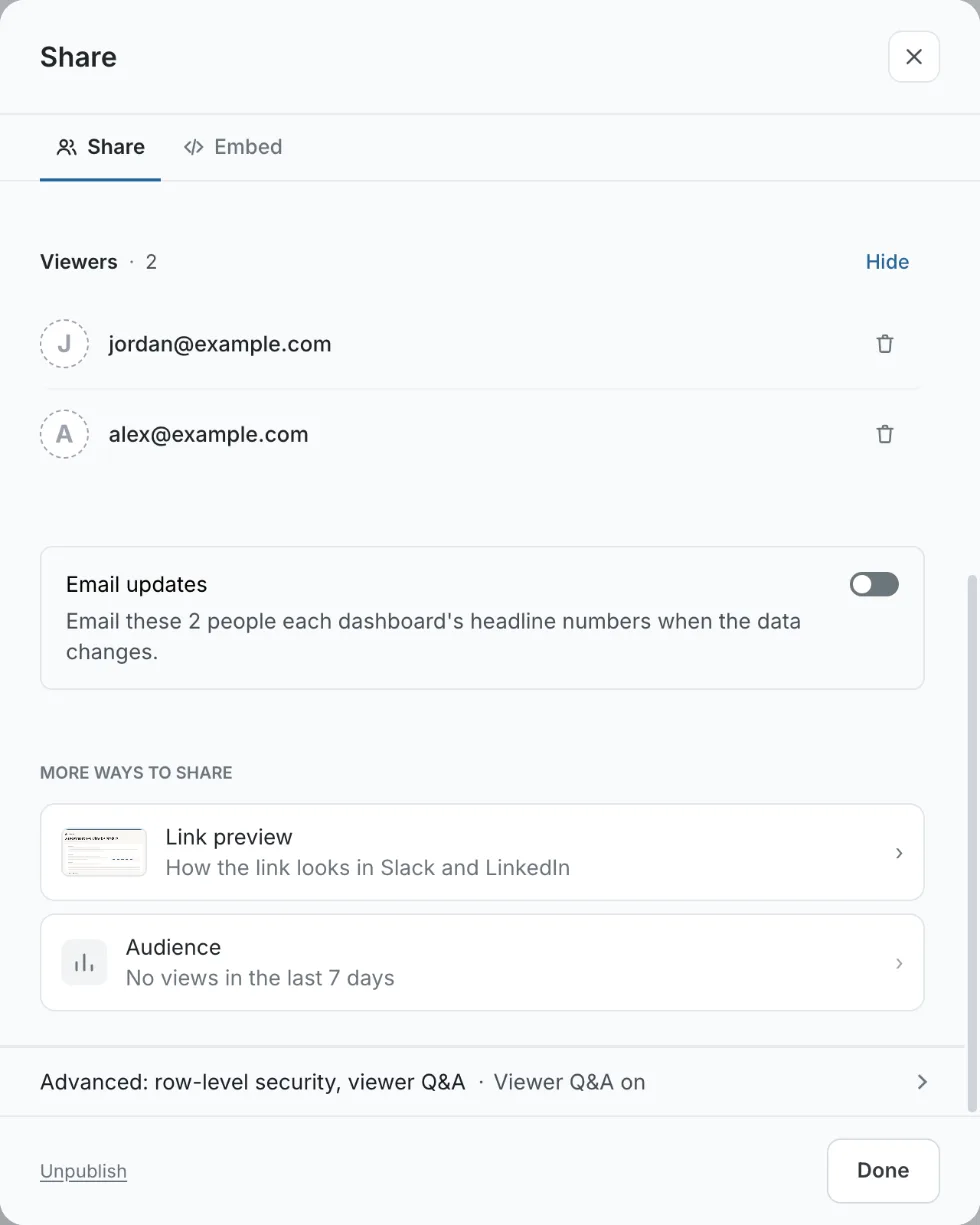
Invited people are always viewers. The panel lists your Viewers, and you can remove one to end their access.
Viewers can't edit the dashboard. To let someone edit it, give them a role in the project (see Projects). For what viewers can do on the board (filters, drill down, see the rows), see What viewers see.
Give each viewer only their own rows
The Share panel's Advanced: row-level security, viewer Q&A row holds row-level security (RLS). It filters the dashboard per signed-in viewer, so each one sees only the rows that match the values you assign them. RLS needs the Pro plan and Sign-in required access. For every step and message, see Row-level security.
Let viewers ask questions of the dashboard
The Advanced: row-level security, viewer Q&A section also holds Let viewers ask questions. Viewers ask questions of the dashboard's data on its Q&A page. It isn't available on an Anyone with the link link. See Explore and Q&A pages.
Email viewers the headline numbers
Email updates sends the people a dashboard is shared with its headline numbers, either when new data is published or on a schedule. Find it in the Share panel, under Viewers. You can also reach it from Audience: "Rather put the numbers in front of them each time the data changes?" with Email them updates.
The section appears for a published dashboard with Sign-in required access and at least one viewer. With nobody to send to, it reads "Share it with someone first. Updates go to the people it's shared with." For every option, status message and the unsubscribe flow, see Email updates.
Share several dashboards at once with a collection
To share several dashboards with the same people, put them in a collection and share that. Everyone you invite gets every dashboard in it, plus any you add later. See Collections.
Control the link preview in Slack, LinkedIn and WordPress
Under More ways to share, the Link preview row ("How the link looks in Slack and LinkedIn") expands to show the card that Slack and LinkedIn draw when someone pastes your link. The caption says it shows "layout and theme only, never your data."
Sites that read oEmbed, such as WordPress and Ghost, can show the live board instead of a card. A note under the link tells you which you get:
| Your settings | What WordPress and Ghost show |
|---|---|
| Anyone with the link, and embed framing set to Any site | The live board ("the same link shows the live board") |
| Embed framing set to Only these sites | A card ("you've limited which sites can frame this board") |
| Any access other than Anyone with the link | A card ("a key or per-viewer token can't travel in a pasted link") |
Download a dashboard as PDF, PNG or PowerPoint
The Download group under More ways to share saves the dashboard as PDF, PNG (the page you are on), or PowerPoint. Dashboards that can be exported to BI tools also list Power BI and Tableau. See Export a dashboard to Power BI or Tableau.
Share a dashboard as a video
For a published motion story, More ways to share → Share as video records one full sweep of the story as a silent MP4.
- Pick a Video frame:
| Frame | Made for | Notes |
|---|---|---|
| 16:9 | YouTube · slides | "For YouTube, slides, websites and email. Plays small in a phone feed." |
| 1:1 | Any feed · X | "Plays uncropped in any feed, X included." |
| 4:5 (Best for posts, the default) | LinkedIn · Instagram | Fills the most of a phone screen in the LinkedIn, Instagram and Facebook feeds, never cropped |
| 9:16 | Reels · Shorts | "Full screen in Reels, Stories, TikTok and YouTube Shorts. A normal feed crops it." |
- Click Generate video. Progress reads "Starting up…", "Capturing frames 120 / 360…", then "Encoding…". You can close the panel, and the video keeps going. You can't change the frame while a video renders.
- Check the preview ("15s · 1920×1080 · 8.4 MB") and click Download MP4.
To post it on LinkedIn, download the video and upload it to your post (not as a link). Then paste your share link in the post text.
If you change the story, the panel says "Video is from a previous version of this story". Click Regenerate for a fresh one. If it fails, you see "Video generation failed." with Try again.
Turn a dashboard into a LinkedIn carousel
A carousel turns a dashboard into image cards sized for a LinkedIn carousel post.
- In the editor, open the caret next to Publish and choose Share as carousel….
- The Share as a carousel dialog shows the cards: "6 cards at 1080×1350, sized for a LinkedIn carousel. One claim per card." The last card is "The board, and a link back to it". Click Why only 6 cards? to see why some were left out.
- Click Download carousel.
The menu item is greyed out, with the reason on hover, when a board has no story to tell. For example: "There isn't a story to tell here yet. A carousel needs a measure that changes over time, or a breakdown where one group clearly leads." It reads "Still loading this board." while the board loads. On sample data, every card says the numbers are demo numbers.
Embed the dashboard in your own site
To put the dashboard in a page you control (your site, an intranet, Notion or Confluence), open the Embed tab at the top of the Share panel. You can also get there from the Publish caret → Embed, a library row's ⋯ → Embed, the frame icon on a tile, or the Embedded · 2 badge in the editor header. Embedding is available on every plan.
In the Embed tab you choose:
- What goes in the page? The whole board, one page, or one chart
- Who sees it: anyone (over the public link), Basic (a key in the page) or Advanced (a token per viewer, which can carry row-level security)
- Which sites may frame it: Any site or Only these sites
- How it looks: theme, which parts show, and the height
Then click Copy snippet and paste it into your page. Where it's showing lists the sites the board has loaded on. For each option, see Embedding.
Unpublish a dashboard
- Open the Share panel and click Unpublish.
- Confirm. Unpublishing revokes the shareable link, and anyone who has it loses access immediately.
If the dashboard is embedded, the confirm lists the sites ("Unpublishing breaks 2 embeds: intranet.example.com, wiki.example.com"). Tick I understand embeds will stop working before you can continue.
Your draft and its settings stay intact. You can republish later and the same link works again.
Check what viewers see
Open the viewer's view yourself from Preview in the library or View in the Share panel. Your own visits aren't counted in Audience. For every screen a viewer can meet, see What viewers see.
Related
- Row-level security: give each signed-in viewer their own slice of the data.
- What viewers see: the sign-in, password and board screens from the viewer's side.
- Email updates: send viewers the headline numbers when data changes.
- Collections: share a group of dashboards as one.
- Audience and engagement: see who opened the dashboard and what they read.
- Manage your dashboards: the library, sync settings and draft versions.
Something wrong? support@mammoth.io