Check data quality with the Data Quality Report
The Data Quality Report scores a View's data on six DAMA (Data Management Association) dimensions, lists critical issues and warnings in plain language, and recommends pipeline tasks. Click View Data Quality in the footer below the data grid, then View Details for the full report. The report never changes your data or adds tasks: you build the fixes yourself. It is unavailable while the pipeline runs, in preview or edit mode, and in View-only workspaces.
Explore Cards show patterns in single columns; this report diagnoses the whole View.
Generate a Data Quality Report
- Open the View.
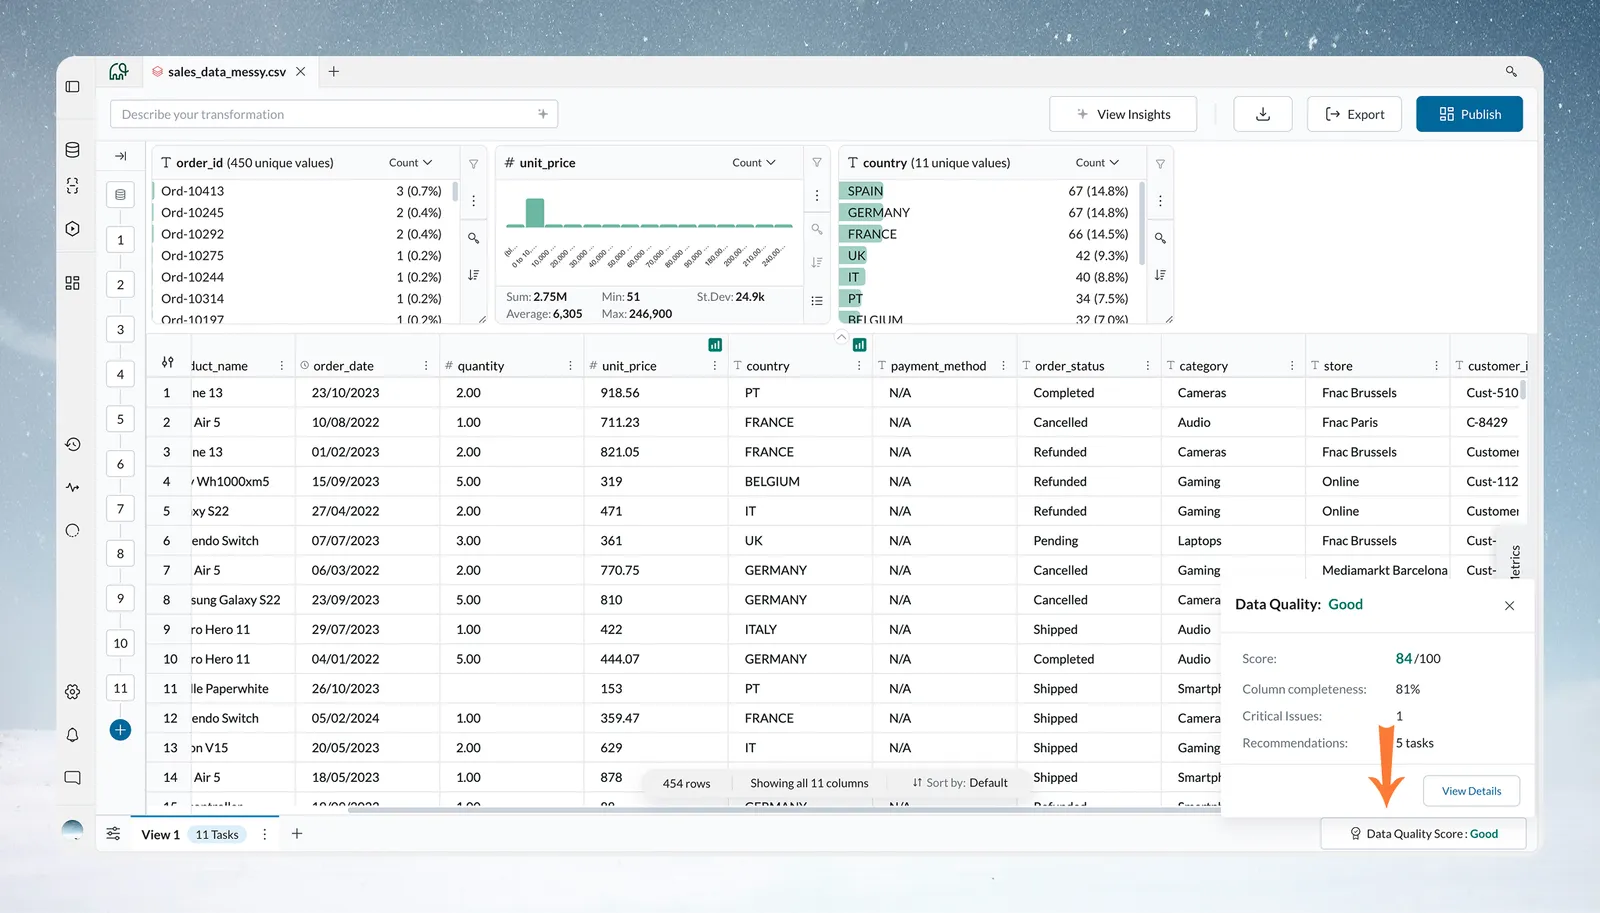
- Click View Data Quality in the footer. While it runs, the button reads "Analyzing Data Quality" with a progress indicator.
- When it finishes, the summary popover opens. Once a report exists, the button reads Data Quality Score followed by the level, for example Good.
- Click View Details to open the full report.
Mammoth analyzes every column, so you don't pick any. If the analysis fails, Mammoth shows an error message and the button stays as it was.
What happens during the analysis
Mammoth builds column statistics for the View: completeness, uniqueness, minimum and maximum, sample values and so on. AI then classifies each column by its likely role (identifier, measure, dimension, date or text) and flags likely problems based on what each column is for. Mammoth checks those flags against the statistics and removes any the data doesn't support.
The report reads the View after its pipeline. Filters you apply in Explore Cards don't change it. To check a subset, add a Conditional Filter task to the pipeline and generate the report again.
Read the summary and the full report
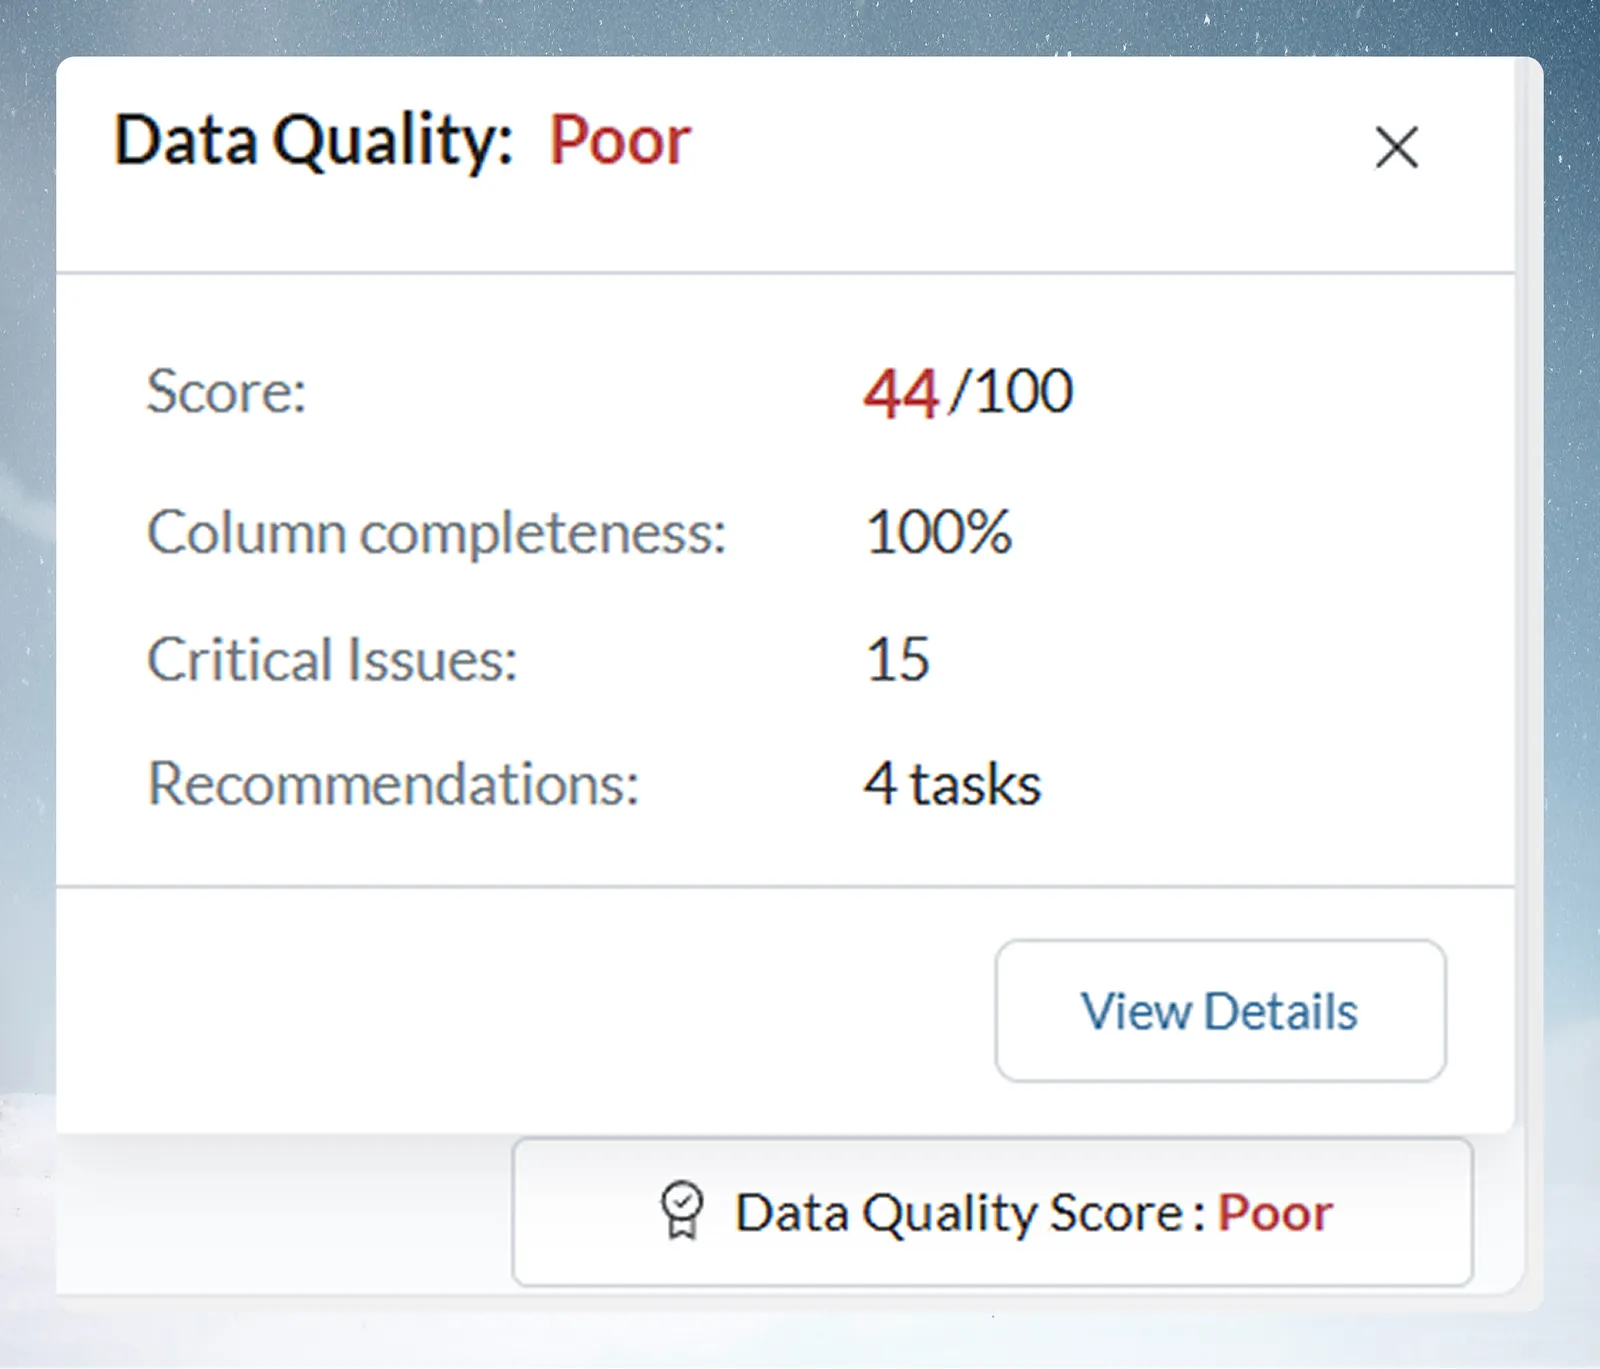
The summary popover is titled Data Quality with the score level. It shows the Score out of 100, Column completeness, the number of Critical Issues, and Recommendations as a task count.
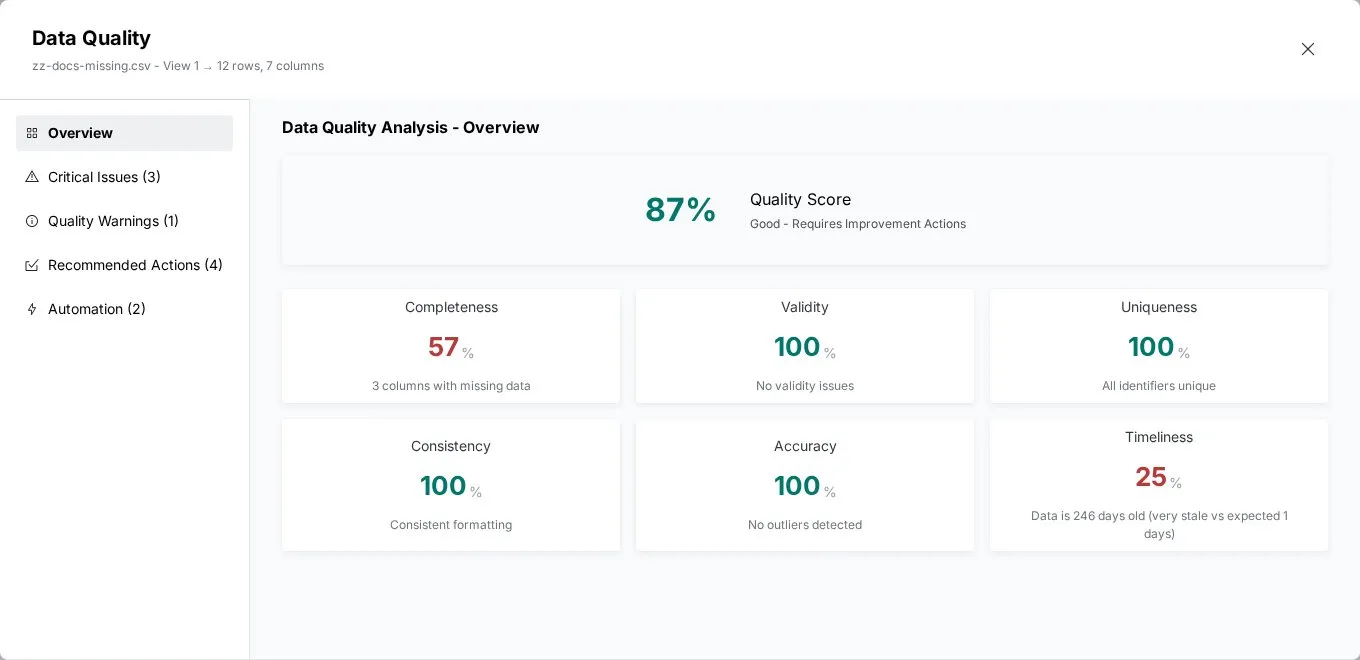
View Details opens the report with sections in the left navigation. Overview always shows; the others show only when the analysis finds something for them. A View with no issues shows only the Overview.
| Section | What it lists |
|---|---|
| Overview | The overall score, its status, and a tile per dimension |
| Impact Analysis | The quality areas affected and what each means for the business |
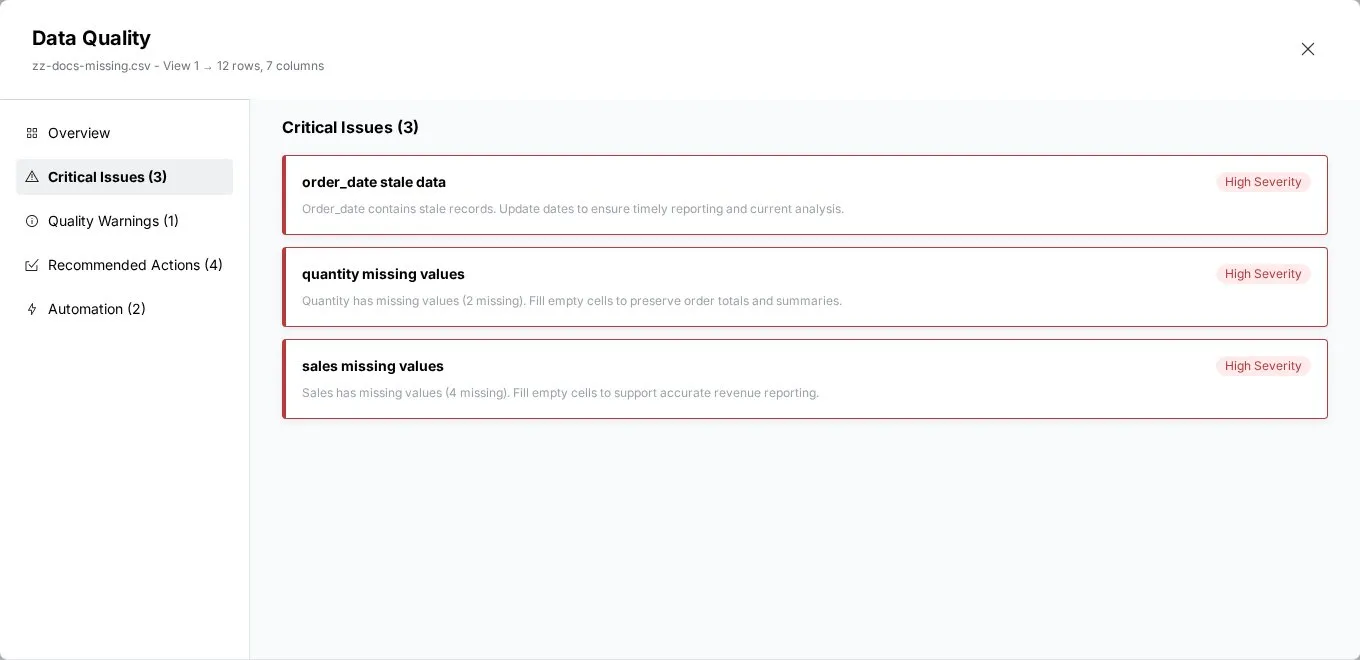
| Critical Issues | High-severity problems needing attention now |
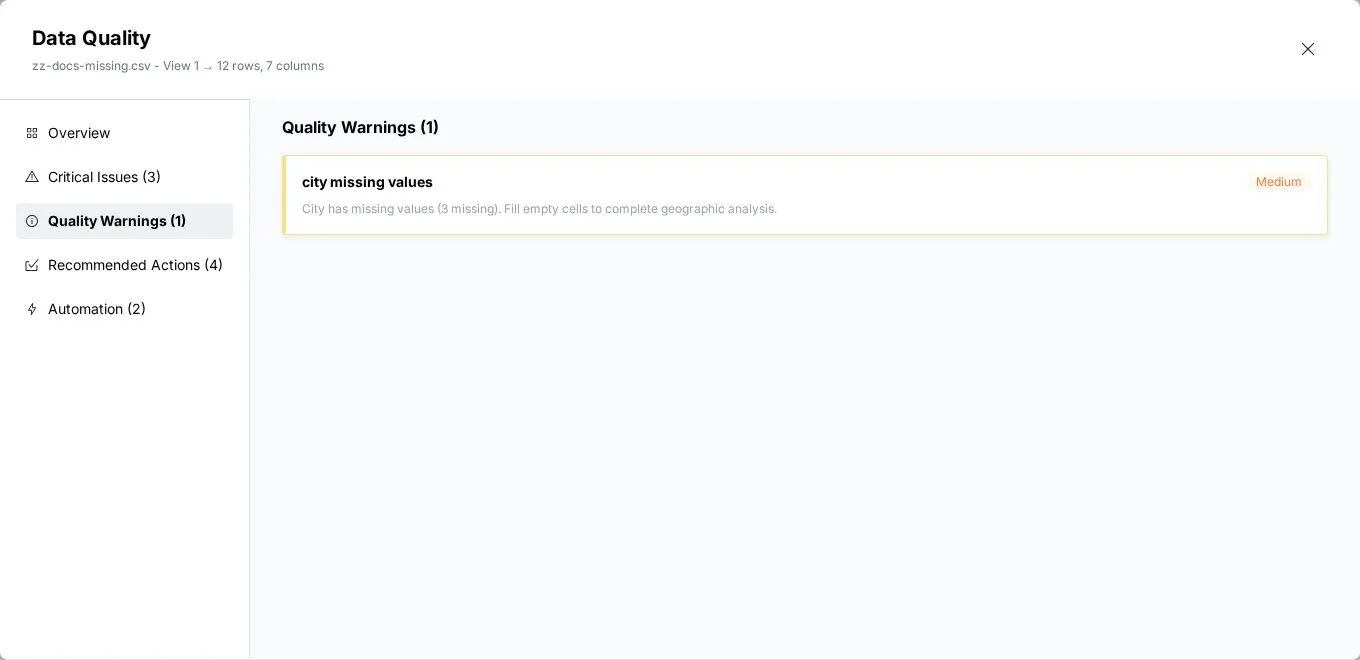
| Quality Warnings | Medium-severity issues worth fixing |
| Recommended Actions | Prioritized pipeline tasks that fix the issues |
| Automation | Workflow suggestions that group fixes |
Overview: score and dimension tiles
Example from a store_transaction dataset (669,430 rows, 14 columns):
Overall Score: 44%, Poor (Critical remediation required)
Completeness: 100% All columns complete
Validity: 28% 10 validity issues
Uniqueness: - 1 identifier(s) with duplicates
Consistency: 66% 2 case inconsistencies
Accuracy: 60% 4 columns with outliers
Timeliness: 25% Data is 1678 days old (very stale vs expected 1 day)
A dimension that scores 0% shows a dash ("-") instead of a number. For Uniqueness, this happens when every identifier column has duplicates, or when the View has no identifier columns. The note under the dash says which.
Impact Analysis
The label carries a count, for example Impact Analysis (3): the number of quality areas affected. Each card shows the area name in bold, a plain-language note on what it means for the business, and a priority pill (High Priority, Medium or Low). Cards are sorted highest priority first, with a matching coloured left border. Up to three show first (fewer if they wouldn't fit without scrolling); Load more shows the rest. The cards are read-only.
Use this section to decide what to explain to the people who use the View, and the next two sections to find and fix it.
Critical Issues and Quality Warnings
Each card gives the issue name, what was found, the rows or percentages affected, and the business impact. Critical Issues are High Severity; Quality Warnings are Medium. Each section shows as many cards as fit, then Load more.
Transaction ID low uniqueness: High Severity
Transaction ID has low uniqueness (4.11% unique). Remove duplicate rows
by key to ensure reliable joins.

Price unexpected negatives: High Severity
Price contains unexpected negative values (1,210 negative). Review and
correct negative prices to ensure valid monetary reporting.

Department case inconsistency: Medium
Department has inconsistent casing across values. Standardize text case
to enable reliable grouping and reporting.

Time stale data: Medium
Time contains stale entries (1678 days old median). Filter or refresh
time values to restore recency for time-based analysis.
Other examples from the same data: "Price contains unexpected zero values (7,400 zero)", "Subtotal contains unexpected negatives (1,230 negative)", "Category has inconsistent casing across values", and "Price has potential outliers (1 detected)".
Recommended Actions
This section turns the issues into specific pipeline tasks, typically 3 to 5, each with a priority. Each card says what the task does and which issues it fixes. Suggestions come from tasks such as Remove Duplicate Rows, Conditional Filter, Text Formatting, Bulk Replace, Find & Replace, Fill Missing Values, Remove Column and Math Function. The cards are read-only: there is no apply button.
Remove Duplicate Rows: High Priority
Remove duplicate rows where Transaction ID repeats (approx. 641,912
duplicate rows) and keep one canonical record per transaction.

Conditional Filter: High Priority
Filter rows with negative monetary amounts (Price 1,210; Subtotal 1,230;
Tax 1,230; Total 1,470) and investigate before inclusion.

Math Function: High Priority
Recompute Total = Subtotal + Tax - Discount and flag mismatches
(33,471 subtotal/tax/total outliers).

Text Formatting: Medium Priority
Apply text formatting to Department and Category to normalize casing.
Automation
The section appears, for example as "Automation (2)", only when the report has workflow suggestions, which are made only when high-severity issues exist. Each card groups related fixes under one name, such as "Monetary Validation & Repair: Automate filtering of negative/zero monetary rows, recalculate totals with Math, and flag mismatches for review." The cards are guidance only: there is no Configure button, so build the tasks yourself.
How the data quality score is calculated
Each dimension scores 0–100%. Dimensions count columns with a problem, not rows, so one bad column lowers a dimension by its share of the columns checked. The overall score is the weighted average, rounded down to a whole number.
| Dimension | Weight | What it measures | How it's scored |
|---|---|---|---|
| Validity | 25% | Values unexpected for what the column holds | Share of columns without unexpected negatives (prices, quantities), unexpected zeros, or future dates. Text formats such as email or phone patterns are not checked |
| Uniqueness | 25% | Duplicates in columns that should be unique | Share of identifier columns (IDs and keys) without duplicates. A column is flagged when it is less than 95% unique. No identifier columns scores 0% (a dash) |
| Completeness | 20% | Nulls, empty fields, empty columns | Share of columns with no missing values |
| Consistency | 15% | Case variants in text columns, such as "Active", "ACTIVE" and "active" | Share of text columns without case variants. No text columns scores 100%. Relationships between columns are not checked |
| Accuracy | 10% | Numeric outliers, found with the interquartile range (IQR) method | Share of number columns without outliers. Never below 60%, because outliers need domain knowledge to judge. No number columns scores 100% |
| Timeliness | 5% | Age of the newest date against the refresh frequency the AI expects (for example, daily for transactions) | 100% within the expected age, 70% up to twice it, 50% up to four times, 25% beyond. With no expected cadence: 100% up to 30 days old, 70% up to 90 days, 50% beyond. No date columns scores 100% |
The report states the measured age and, when there is one, the expected cadence, for example "Data is 1678 days old (very stale vs expected 1 day)". Common causes of stale data are ETL jobs failing silently and sources that stopped sending.
Score levels
| Score | Level | What it means | Typical next step |
|---|---|---|---|
| 95–100% | Excellent | Production-ready; minor formatting issues at most | Publish dashboards, share, automate reporting; record the score for audit or compliance; set up an automation to refresh the data on a schedule |
| 80–94% | Good | Acceptable with awareness: some missing values, formatting or minor duplicates | Note the limits; consider minor cleanup |
| 60–79% | Fair | Several dimensions affected, some critical issues | Fix critical issues before production; development use only |
| Below 60% | Poor | Major problems; results may be unreliable. Quality assessment only, not suitable for analysis | Fix critical issues first; don't proceed to analysis until quality improves; consider fixing at the source |
Fix common data quality problems
Build these steps in the pipeline. See How the pipeline works.
Remove duplicate rows (low Uniqueness)
Duplicates usually come from a source exporting the same records twice, a refresh running twice before deduplication, or files combined without deduplication.
- Add a Remove Duplicate Rows step after your data source.
- Under Evaluate duplicates from, choose the columns that decide whether two rows match (for example transaction ID, or customer ID + date).
- Apply the step, then compare the row count before and after.
More: Remove duplicates and check data.
Handle missing values (low Completeness)
Nulls come from optional fields left empty, left joins with no match, or cells skipped on import.
| Strategy | When to use | Pipeline step |
|---|---|---|
| Replace nulls with a default | 0 is meaningful, or a text placeholder is acceptable | Fill Missing Values: choose the column and how to fill it |
| Remove rows with nulls | Analysis needs complete records | Conditional Filter: keep rows where each critical column has a value |
| Leave nulls | Null means "not applicable" | None; note what null means in the dataset description |
Before removing null rows, check what share of the data they are. A high null rate often means a collection problem at the source.
Fix data type mismatches
Dates stored as text ("January 15, 2024"), numbers with symbols ("$1,250.00"), or "Yes"/"No" in place of true/false make sorting, filtering and calculations misbehave.
- Add a Convert Column Type step.
- Select the column and choose the target type.
- For dates, give the format the text is written in.
- For numbers with currency symbols, first add a Find & Replace step to strip them, then convert.
More: Column types.
Deal with outliers (Accuracy)
Outliers can be real extremes or errors, such as 99999 entered as a placeholder.
| Strategy | When to use | Pipeline step |
|---|---|---|
| Remove outlier rows | Entry errors or test data | Conditional Filter: keep rows below an upper bound you choose after investigating |
| Cap outlier values | Real values that should be limited for analysis | Math Function in SQL mode, for example CASE WHEN amount > 10000 THEN 10000 ELSE amount END |
| Flag and keep | Real, meaningful values to mark | Label & Insert Values to label rows meeting a condition, or keep them and filter in the dashboard |
Check the actual values before removing anything, and ask the data owner. Removing valid outliers makes analysis misleading.
Standardize inconsistent text (Consistency)
- Add a Text Formatting step and use Change text case to normalize case.
- Add a Find & Replace step to map variants such as "USA" and "United States" to "US" (repeat for each variant).
- Add a Text Formatting step with Normalize whitespace to remove extra spaces.
More: Work with text and JSON and Find and replace values.
Apply several fixes in the right order
- Types first: null counts and outlier detection depend on the right type.
- Duplicates second: so filling nulls doesn't create false completeness.
- Nulls third: decide which to fill or remove.
- Standardize values last.
Generate the report again after each group of fixes, or after every 3–4 tasks, to track progress and avoid over-fixing.
When to run the report and when it refreshes
- After upload: find show-stoppers before building transformations. If the score is Poor, start with critical issues.
- Mid-pipeline: after major transformations, to confirm the improvement.
- Before production: before sharing or feeding dashboards. Good (80%+) usually means ready. Regulated industries need this final check.
- Compliance and migration: the score and dimension breakdown serve as DAMA quality evidence. For a migration, set acceptance criteria (for example a minimum of 90%) and track the score, such as 43% to 68% to 87% to 92%.
The report is a snapshot saved with the View. When the View's data changes, it is cleared and the button returns to View Data Quality. A new report replaces the old one.
Data Quality Report limits
- A snapshot, not continuous monitoring.
- The current View only; you can't compare quality across datasets.
- No export: screenshot or copy the text.
- Recommended Actions and Automation cards describe tasks but don't create them.
- No custom dimensions beyond the DAMA six.
Troubleshooting the Data Quality Report
| Symptom | Cause | Fix |
|---|---|---|
| The report doesn't generate, or shows an error | The View is empty, or the pipeline is running | Check the View has data, wait for the pipeline, refresh the page and try again |
| View Data Quality is greyed out | Running pipeline, preview or edit mode, or a View-only workspace | Wait, or exit the mode |
| The score seems too low or too high | Dimensions count columns, so a View with few columns swings sharply; the weights may not match your priorities | Read the dimension tiles and the issue cards, not only the total; some flags may be acceptable for your use |
| A dimension shows a dash | It scored 0%. For Uniqueness: every identifier column has duplicates, or there are none | Read the note under the dash and the Critical Issues section |
| Score is below 80% and you don't know why | Find the lowest tile in Overview, read Critical Issues and Quality Warnings, check those columns in the grid, then build the Recommended Actions | |
| The report disappeared | The View's data changed | Click View Data Quality again |
| Issues persist after your fixes | The problem is in the source, or a recent pipeline change caused it | Compare a sample of raw source data with what Mammoth imported; review recent steps; contact support@mammoth.io with your workspace name, dataset name and the issue |
Related
- Which explore tool to use: how the report fits with the other tools.
- Text, number and date cards: find the problem rows behind an issue.
- View Insights: business patterns once the data is sound.
- Remove duplicates and check data: build the deduplication step.
- Filter rows: check a subset, or remove bad rows.
- Fix a failing step: when a fix breaks the pipeline.
Something wrong? support@mammoth.io