Let readers ask questions and explore dashboard data
Two kinds of dashboard page let people go beyond the charts you built. A Q&A page is a notebook where people ask questions in plain words and get answer cards grounded in your data. An Explore page lets signed-in readers filter and dig through the dashboard's table themselves, read-only. Editors add both from Add → Page; viewers use them on the published dashboard.
Add a Q&A page to a dashboard
Any of these adds a Q&A page or board:
- When you create a dashboard, choose the Q&A format and click Open a notebook →.
- In the editor, click Add → Page → Q&A, then Create page. A dashboard holds one Q&A page.
- Switch a whole board to the Q&A format under Design → Format. See Change a dashboard's theme.
For a Q&A-format board, the Design tab only has Style and a Context section. There you attach context that grounds the answers (see Give the AI context).
An empty Q&A page says "Ask your first question in the chat, and the answer becomes the first card in this notebook." The heading reads "Ask anything about" followed by the table's name, for example "Ask anything about Sales". Editors can click it to rename it.
Ask a question and read the answer card
Type a question in the ask box (up to 2,000 characters). While it works you see "Planning the grounded query…", then "Running the query…". Bigger questions can take a minute.
Each answer card has:
| Part | What it does |
|---|---|
| The answer | A number, chart or table, under your question. |
| Read as | How Mammoth understood the question. Click Not what I meant? to correct it. |
| Source chip | Says how the answer was worked out, for example "computed from 8 rows" or "reasoned over 3 steps". Expand it to see the dataset, operation, filters and rows behind the answer. |
| Expand, View data, Download CSV, Copy | Open the answer larger, see its rows, download them, or copy the answer. |
| Good answer / Bad answer | Feedback on the answer. |
| Follow up | Ask a follow-up question that builds on this answer. |
| Add to pinned section | Editors only, on a Q&A page inside a dashboard: pin the answer to the page. A board in the Q&A format can't pin. |
| Comments | Add a comment… opens a Discussion thread on the card. |
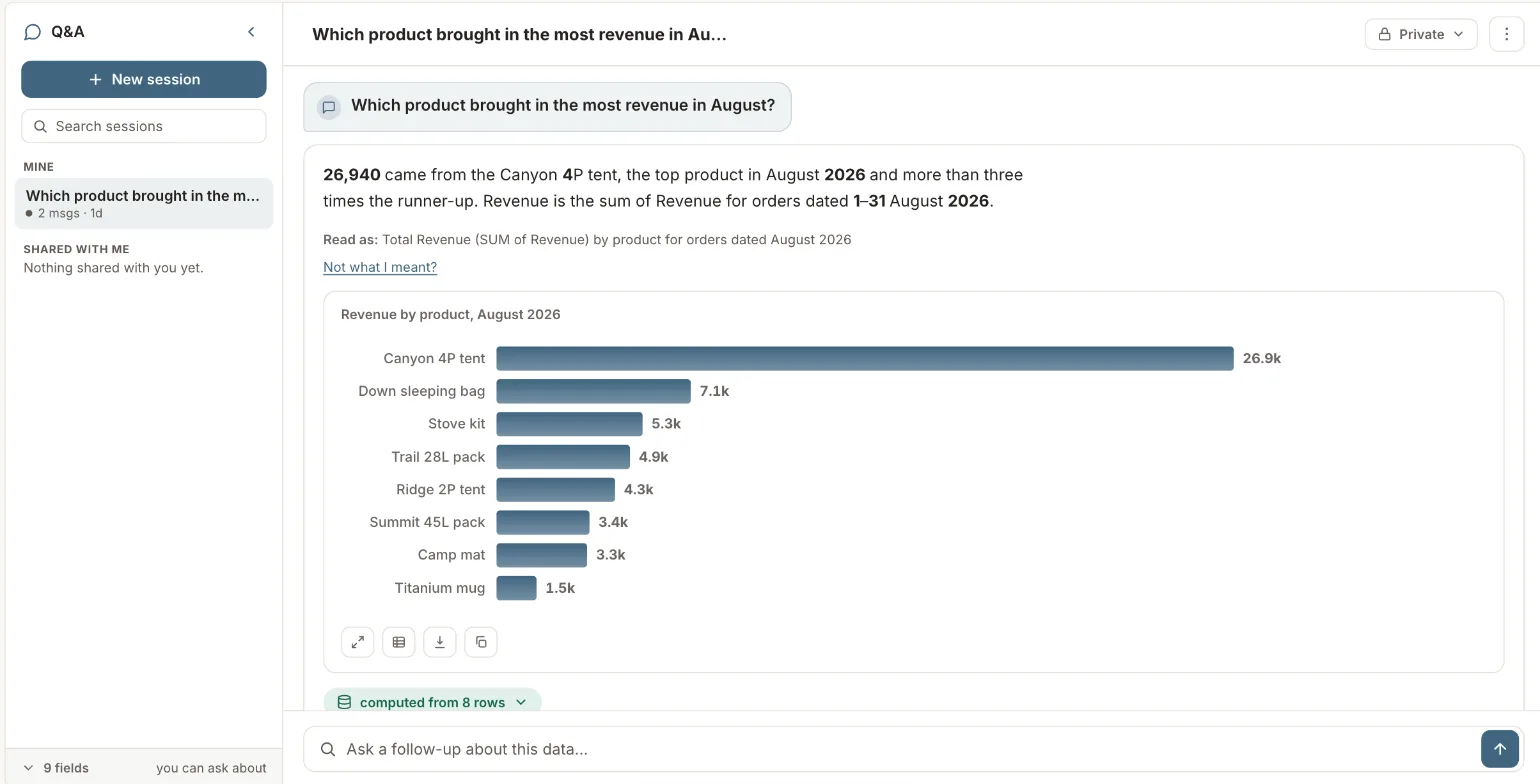
Ask about a specific table on a multi-table dashboard
On a dashboard that reads two or more tables, the ask box has an Asking about picker. Choose which table the question is asked of. See Add a page that reads another table.
Keep and share Q&A sessions with your team
Each conversation is a session. Click Show sessions to open the sessions list:
- New session starts a fresh conversation.
- Search sessions finds an earlier one.
- Shared with me lists sessions others shared.
- Delete session removes one of yours.
Each session is either:
| Visibility | Who can see it |
|---|---|
| Private | Only you can see this session. |
| Shared | Anyone in the workspace can view and comment. |
Someone else's shared session opens read-only. To keep asking from where they left off, click Continue in a copy.
Let viewers ask questions on a published dashboard
Viewers of the published dashboard can ask their own questions on its Q&A page. Every answer is computed on the server and shows its source.
- Open the Share panel.
- Open Advanced: row-level security, viewer Q&A.
- Turn on Let viewers ask questions. The Share panel then shows Viewer Q&A on.
The same switch is in a Q&A session's ⋯ menu.
- It's on by default. The setting on a dashboard overrides the workspace default.
- It doesn't work on an Anyone with the link share: "Not available on a public link — viewer questions need a signed-in viewer."
- Viewers see a note that their questions are shared anonymously with the dashboard's editors.
For the rest of the Share panel, see Publish and share a dashboard.
How many questions viewers can ask
| Limit | What happens |
|---|---|
| Plan | Viewer questions aren't included on the Free and Starter plans. Team and Pro include a monthly number of viewer questions per workspace (see Limits and quotas). When the month's questions are used, viewers see "This workspace has used all the dashboard Q&A questions its plan includes this month." |
| Per viewer, per dashboard, per day | 200 questions from each viewer. After that, that viewer sees "This dashboard has reached its Q&A question limit for today — try again tomorrow". |
Editors' own questions don't count against either limit.
Add an Explore page to a dashboard
An Explore page gives readers the column summaries, drill-down and data grid from the data editor, read-only, on the dashboard's own data.
- When you create a dashboard, choose Explore and click Open an Explore page →.
- In the editor, click Add → Page → Explore, then Create page.
Explore isn't available while row-level security is on: the Explore card shows Not with row security.
Who can use an Explore page
- Only signed-in readers of the published dashboard. Explore never works over a public link or a password link.
- Not on a dashboard with row-level security: "Explore isn't available on a board with row security."
- Readers don't need access to the source data. They only get the columns you allow. Mammoth never sends sensitive, contact-like or derived columns, whatever you allow.
- If the page can't load, readers see "This Explore page isn't available right now."
The editor preview doesn't show reader-only tools such as What stands out.
Explore a dashboard's rows as a reader
The page header shows the table's name and "Same data as the board". Board filters don't apply here: Explore starts from every row.
| Control | What it does |
|---|---|
| Column cards | Each card summarises a column. Use Add card to explore another column, or Search all columns. You can also compare two number columns. |
| Filters | Filter the rows from the cards, or describe a filter in plain words. Clear filters removes them all. |
| Grid | The rows that match, with a count such as "120 of 4,800 rows". |
| Start over | Goes back to the board's starting cards. |
| Metrics | A read-only list of the table's saved metrics ("Numbers you define, kept beside the data"). If there are none: "This table has no saved metrics yet." See Metrics. |
| Ask about this | Puts a question about the table (and your filters) into the dashboard's Q&A box. Shown only when viewers can ask questions. |
On a dashboard that reads more than one table, the Explore page has one tab per table. Each tab reads the same copy of the data as the dashboard's charts.
Find the values that stand out with What stands out
What stands out appears when your open cards include a number column and a category column. It finds the values that stand out, for example "Revenue by Region". It offers a button such as Filter to North, West to narrow the grid to them.
Results are worked out from the totals of every row, not estimated, and ignore your filters. If nothing stands out, it says the number is spread evenly across the values.
Download the rows you filtered as CSV or Excel
- Click the download button (for example Download 1,250 rows).
- Choose CSV or Excel (.xlsx).
- A file holds up to 500,000 rows. Past that you see "The file holds the first 500,000 of 812,000 rows. Add a filter to narrow it down."
- The file has only the columns readers can explore.
- Downloading works only when the editor allows it in Explore settings.
Choose what readers can explore
- Open Manage pages (see Pages and navigation).
- Click the gear (Explore settings) on the Explore page's row.
- Set the options below, then click Save.
| Setting | What it does |
|---|---|
| Readers can explore | The columns readers may use. Select all or Clear. Columns left out are never sent to the browser. |
| Readers can download what they filter | On by default. A file of the rows they filtered, with only the columns readers can explore. |
| Opens with | The cards a reader sees before they touch anything. Leave it unset to use suggested cards. With no cards chosen, the page opens as a plain table, and readers can still explore any allowed column themselves. |
Limits
- Ask box: up to 2,000 characters per question.
- One Q&A page per dashboard.
- Viewer questions: not on Free and Starter; a monthly number per workspace on Team and Pro; 200 per viewer, per dashboard, per day.
- Viewer questions and Explore need signed-in readers: not on Anyone with the link shares. Explore also doesn't work over a password link.
- Explore isn't available with row-level security.
- Explore downloads: up to 500,000 rows per file.
Troubleshooting Q&A and Explore pages
| Message | Cause | Fix |
|---|---|---|
| "Not available on a public link — viewer questions need a signed-in viewer." | The dashboard is shared with Anyone with the link. | Share with Sign-in required instead. |
| "This workspace has used all the dashboard Q&A questions its plan includes this month." | The workspace used its monthly viewer questions. | Wait for next month, or change plan. |
| "This dashboard has reached its Q&A question limit for today — try again tomorrow" | That viewer asked 200 questions today on this dashboard. | Try again tomorrow. |
| Not with row security on the Explore card | Row-level security is on. | Turn off row security to add Explore. |
| "This Explore page isn't available right now." | The page couldn't load. | Reload later. |
| "The file holds the first 500,000 of 812,000 rows. Add a filter to narrow it down." | The download is over 500,000 rows. | Add a filter before downloading. |
Related
- Pages and navigation: add Q&A and Explore pages and manage them.
- Give the AI context: ground Q&A answers in your definitions.
- Publish and share a dashboard: the Share panel and viewer Q&A switch.
- Limits and quotas: monthly viewer questions by plan.
- Which explore tool to use: the same column cards in the data editor.
Something wrong? support@mammoth.io