Read a date Explore Card and change its granularity
A date card shows a vertical bar chart, oldest period on the left. Each bar is a period, and its height shows how many rows fall in it; hover a bar for the exact period and value. Add one with Add card in the Explore panel; the shortcuts that change values need edit access to the View.
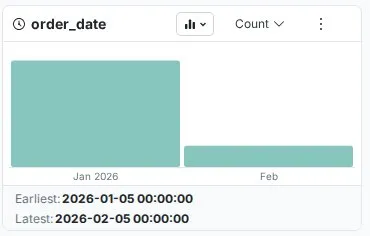
Date card views, Earliest and Latest
| View | Best for |
|---|---|
| Columns (default) | Trends and seasonality |
| Timeline | The same periods drawn as a line over time |
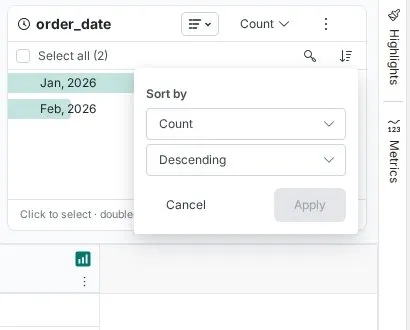
| List | Reading exact counts per period. Sort by sorts by the measure or by period in date order |
Below the chart, Earliest and Latest show the oldest and newest values with full date and time, for example 2024-01-02 12:00:00 and 2024-12-23 12:00:00. A future date in historical data, or a Latest value much older than expected, stands out here.
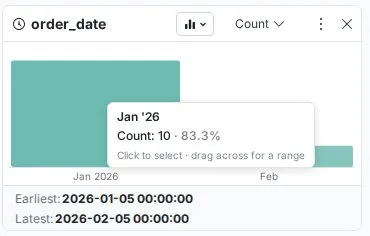

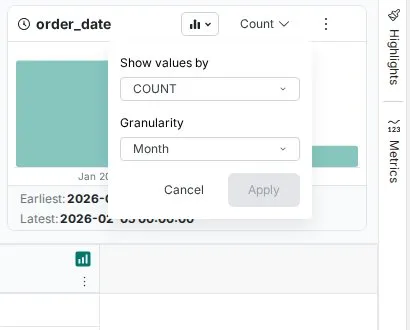
Change a date card to day, month, year or hour
Mammoth picks the period from the earliest and latest values: Year if they fall in different calendar years, Month if they fall in different months of the same year, otherwise Day. Automatic selection only ever picks Day, Month or Year, even for data that spans a few hours. It is recalculated when a filter narrows the dates.
- Click the aggregation menu in the card header (it reads Count).
- Choose a Granularity.
- Click Apply.
| Granularity | Example labels | Best for |
|---|---|---|
| Day | 01-Aug-2024 (list) or 1, 2 (chart) | Daily operations, short-term trends |
| Month | Jan '24 (list) or Jan-2024 (chart) | Seasonal patterns, monthly performance |
| Year | 2022, 2023, 2024 | Long-term trends, year-over-year |
| Hour | 01-Aug-2024 08:00 (list) or 8 am (chart) | Intraday patterns, shift analysis |
| Minute | 01-Aug-2024 08:15 (list) or 8:15 am (chart) | Process timing, high-frequency data |
| Second | 01-Aug-2024 08:15:00 (list) or 8:15:00 am (chart) | Real-time monitoring, event logs |
Changing granularity doesn't change your data.
Patterns and problems a date card reveals
| Pattern | What you see |
|---|---|
| Seasonality | Holiday spikes in retail, new-year bumps in subscriptions, summer slowdowns in B2B |
| Trends | Rising bars mean growth; falling bars mean decline |
| Operational rhythms | Weekday against weekend, month-end spikes, shift patterns |
| Missing periods | Absent bars where daily data should appear every day point to a collection problem |
| Future dates | A Latest value after today in historical data |
| Batch artifacts | Heavy clustering on one date, such as 90% of rows on the last day of each month |
Worked example: an orders card by month shows 500–700 orders a month from January to October, 2,400 in November and 3,100 in December. Double-click November and read the product category card to its right: "Gifts" dominates. For website visits over one week, switching to Hour shows peaks at 12:00–14:00 and 20:00–22:00 and a lull at 02:00–06:00.
Troubleshooting date cards
| Symptom | Cause | Fix |
|---|---|---|
| Date column appears as text, not a chart | Dates in mixed formats (for example MM/DD/YYYY and DD-MM-YYYY) | Use Convert Column Type. See Work with dates |
| Seasonal pattern not visible | Data covers less than one full cycle, or the granularity hides it | Check Earliest and Latest; a year is needed for annual seasonality; try another granularity |
| Earliest or Latest looks wrong | Both include the time part, or the data has future or impossible dates | Read the full datetime; check for dates before the business or system existed |
| Chart changes period after filtering | Automatic granularity follows the rows currently counted | Set the granularity you want and click Apply |
Related
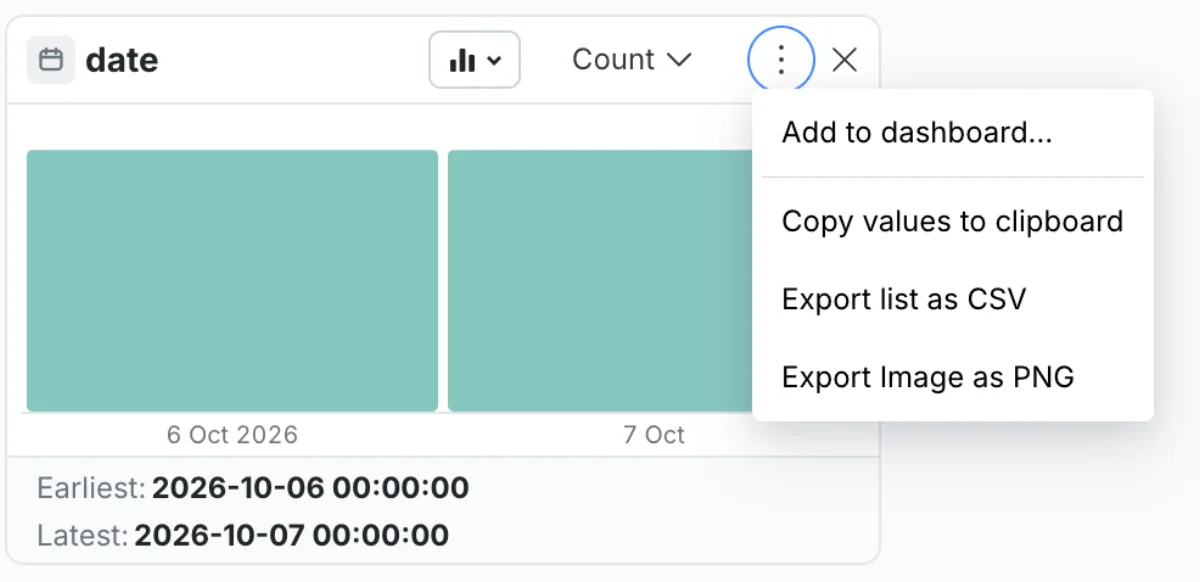
- Text, number and date cards: Show values by, sorting and the More options menu.
- Work with dates: convert and reformat date columns.
- Investigate a pattern with Explore Cards: follow a spike into the cards to its right.
Something wrong? support@mammoth.io