Mammoth quick start: from a CSV file to a shared dashboard
This tutorial takes a small, messy sales file through the whole Mammoth workflow: upload, explore, clean, download, then publish a dashboard and share its link. You start in Data > New dataset and finish in the dashboard's Share panel. You need the Project Editor or Project Admin role in a project.
Before you start
- A Mammoth account. To get one, sign up for Mammoth.
- The Project Editor or Project Admin role in a project. A Project Viewer can't add data or tasks.
- A CSV file of sales orders, such as
sales_data_messy.csv, with the columnsproduct_nameandorder_date. It works best with:- product names written in several variations;
- dates in inconsistent formats;
- duplicate entries.
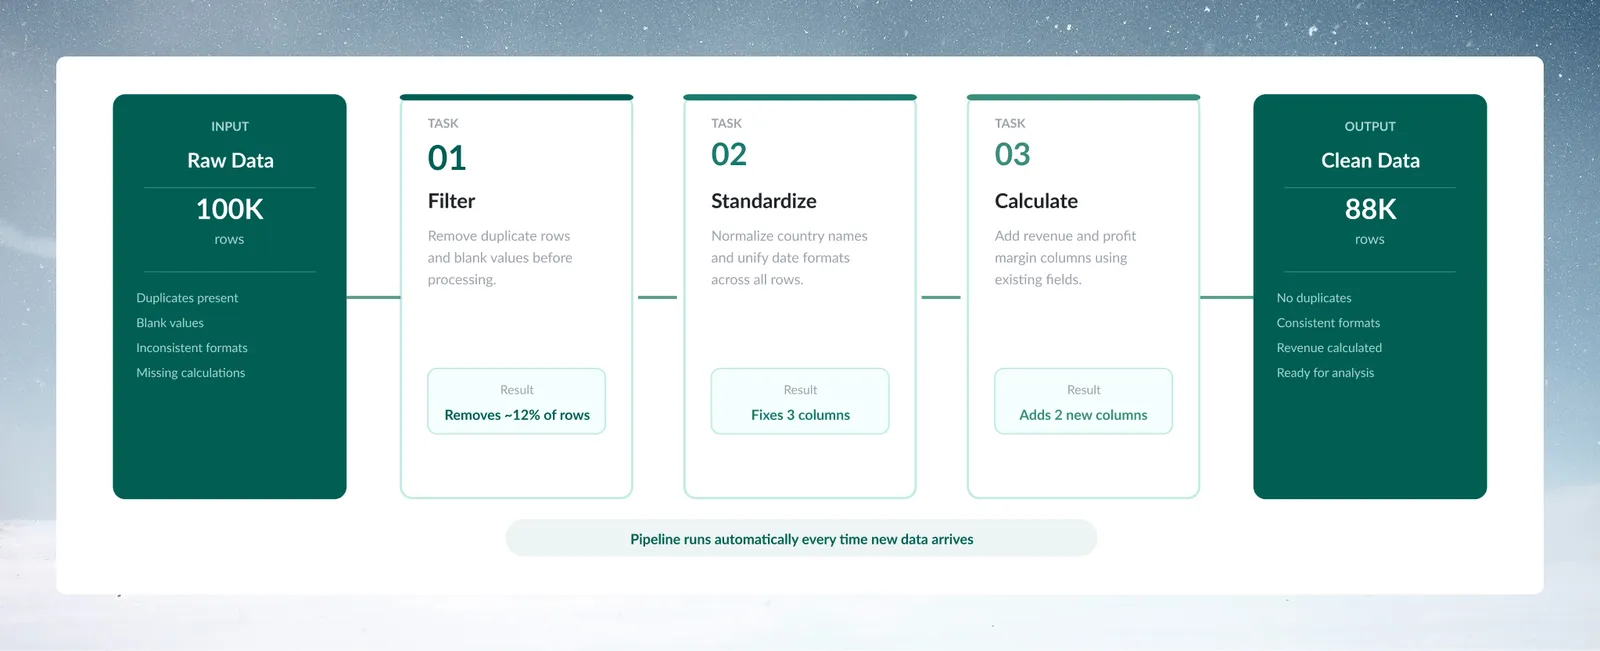
You finish with a clean dataset you can download, a three-task pipeline that cleans next month's file the same way, and a dashboard on the clean data. For a tutorial on built-in sample data instead, see Build your first pipeline.
Step 1: Upload the sales CSV as a dataset
- Click Data in the left sidebar to open the Data Library.
- Click New dataset.
- In the New dataset dialog, choose Upload (the default).
- Drag your file into the drop area, or click Upload file.
- Click Submit.
Mammoth reads your CSV and creates a dataset in your project. The dialog closes right away, the file appears in the Data Library while it loads, and a progress header shows "Upload complete" when it's done. Uploads can be up to 50 MB. See Upload files.
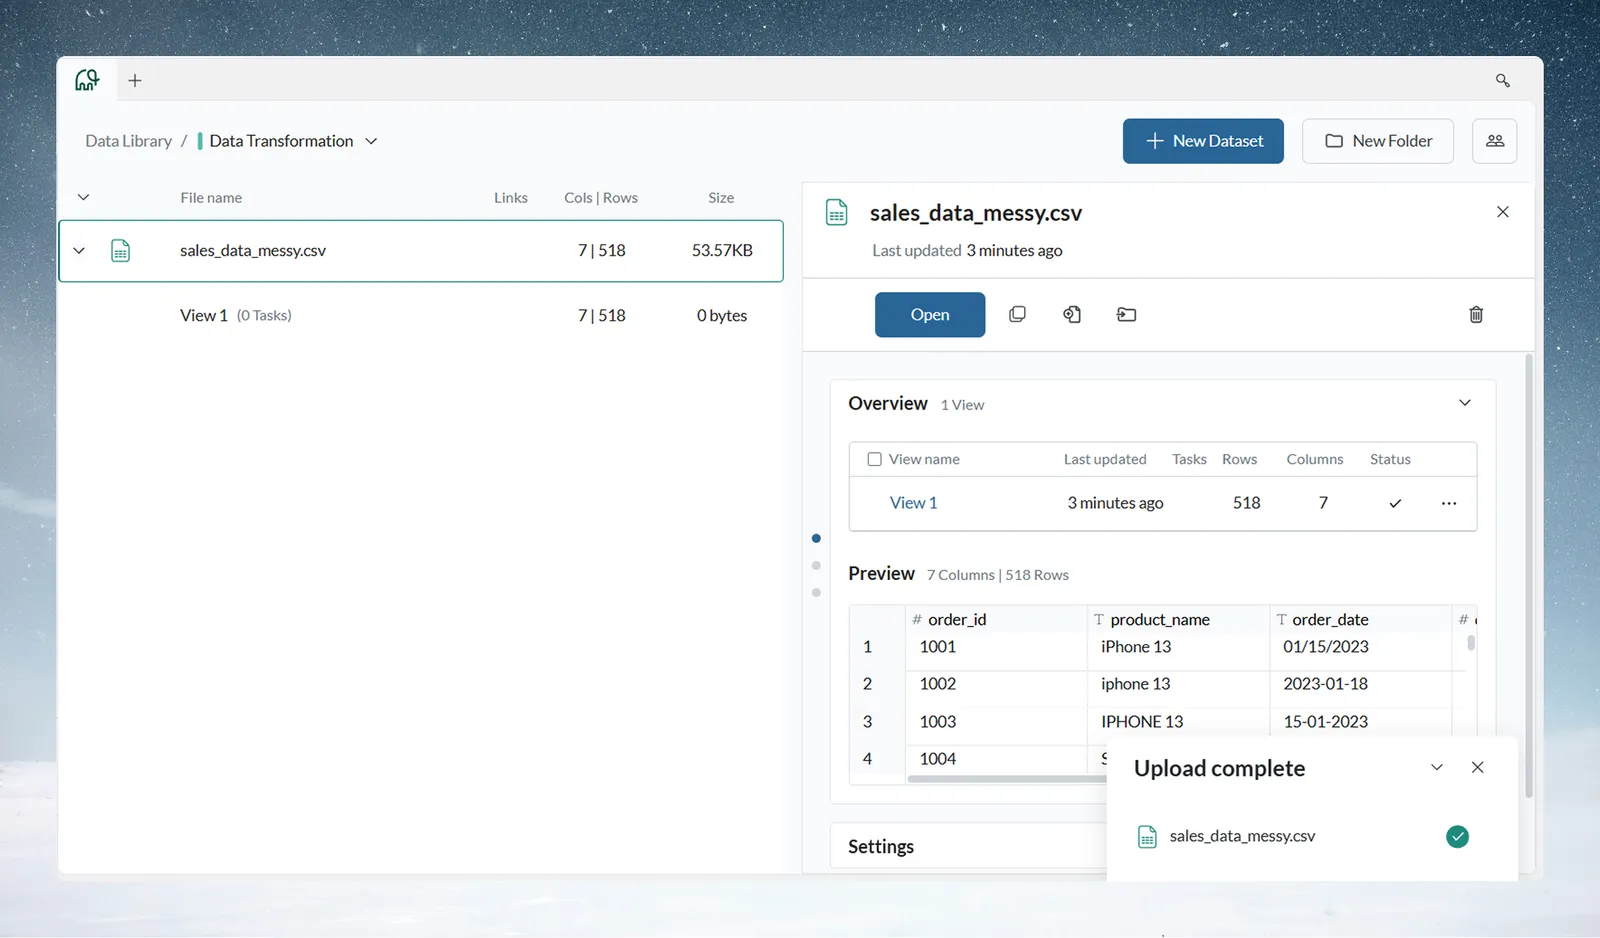
Open the dataset from the list to see it in a view. A view is the data editor where you explore and transform data.
Step 2: Profile the sales columns with Explore Cards
Check the data's quality and patterns before you change anything. The Explore panel sits above the data grid. If it's hidden, click the Explore toggle in the action bar.
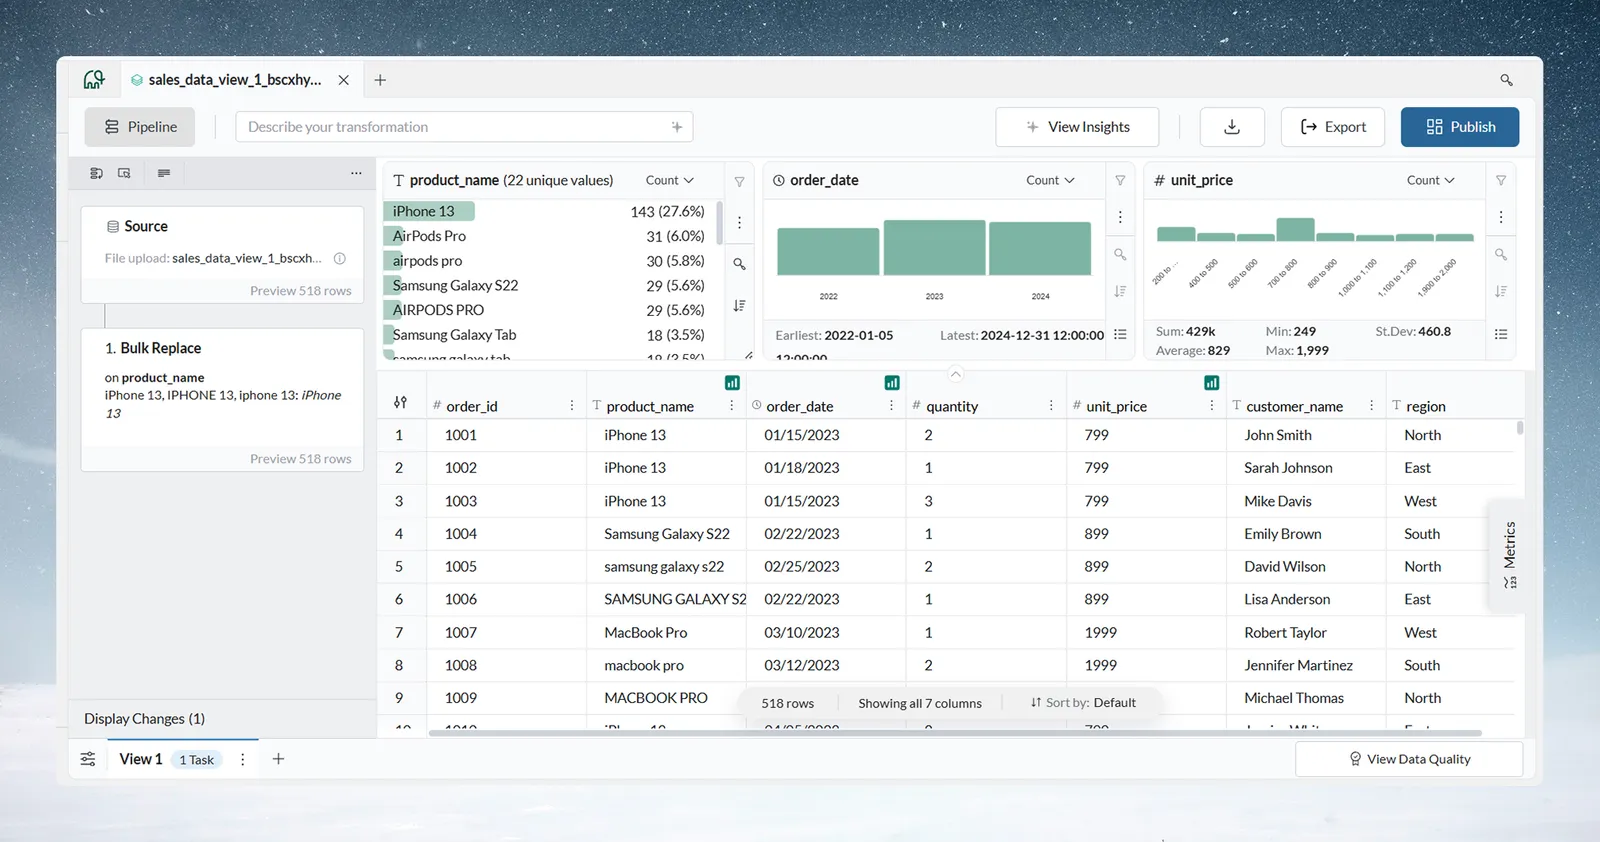
- Click Add card and choose product_name in the Explore a column list. The card lists each distinct value with its row count. Notice the variations: "iPhone 13", "iphone 13" and "IPHONE 13" appear as separate values.
- Add a card for order_date the same way. A date column shows a timeline of the orders. If the card treats order_date as text, the mixed formats are why. You can fix the type later with a Convert Column Type task.
- Click View Data Quality in the footer of the view. The summary shows the Score out of 100, Column completeness, Critical Issues and Recommendations.
- Click View Details for the full report.
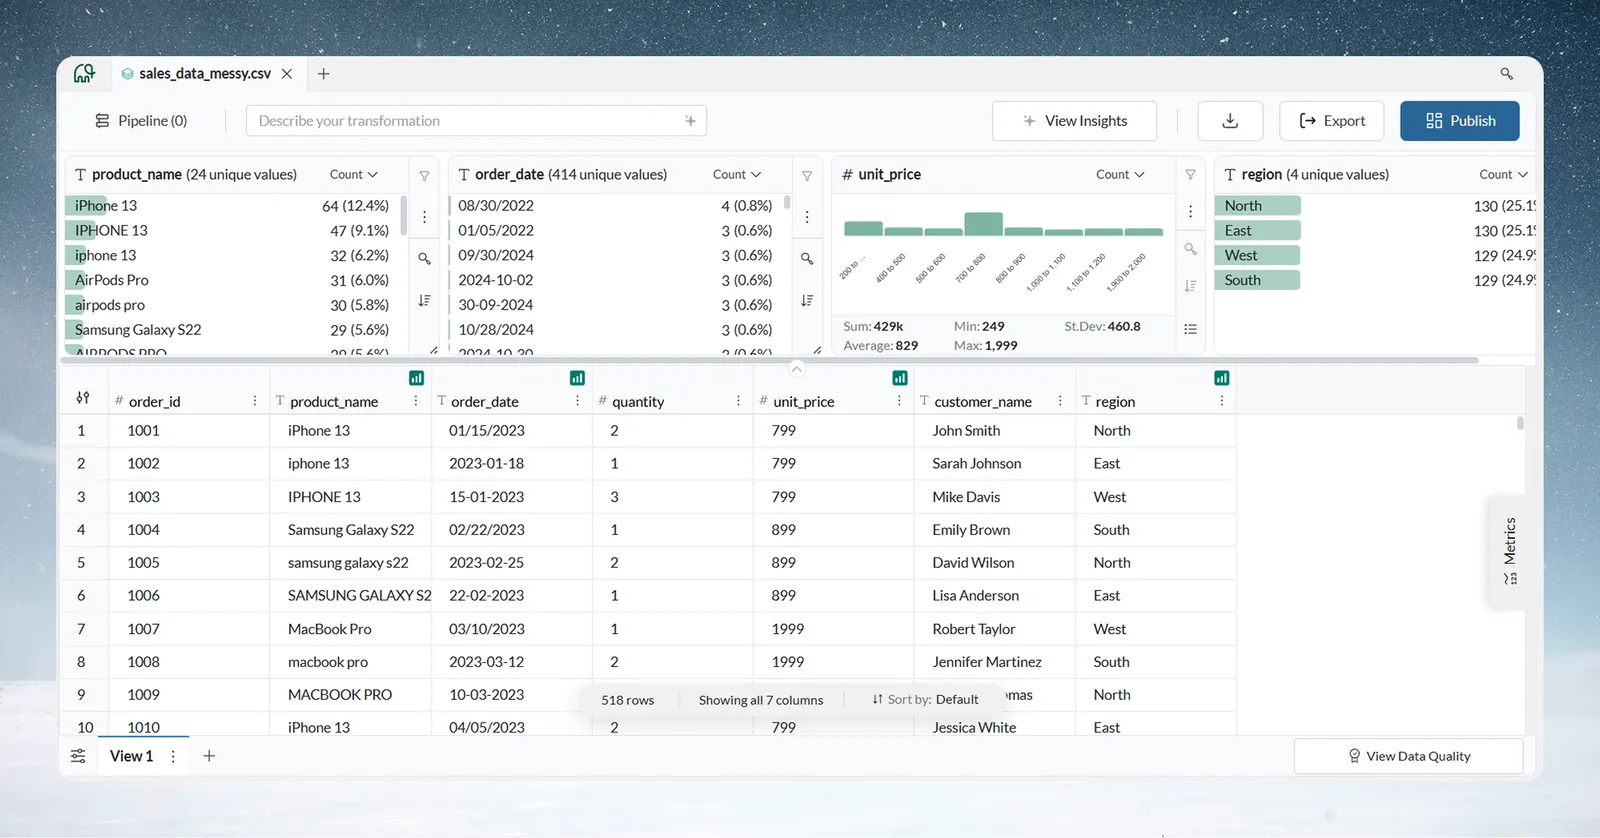
Double-click a value on a card to filter the grid to those rows. The filter shows as a pill in the card header. Remove it at any time, or turn it into a pipeline task. See Explore cards.
The sample file has three common real-world issues, which Step 3 fixes:
| Issue | Example |
|---|---|
| Product names in several variations | "iPhone 13", "iphone 13", "IPHONE 13" |
| Duplicate records | The same order appears more than once |
| Old orders | A mix of old and recent orders |
Step 3: Standardise product names with Bulk Replace
Each cleaning step you add becomes a task in the view's pipeline and runs again on future data.
- Click the 3-dot menu button in the product_name column header.
- Select Bulk Replace.
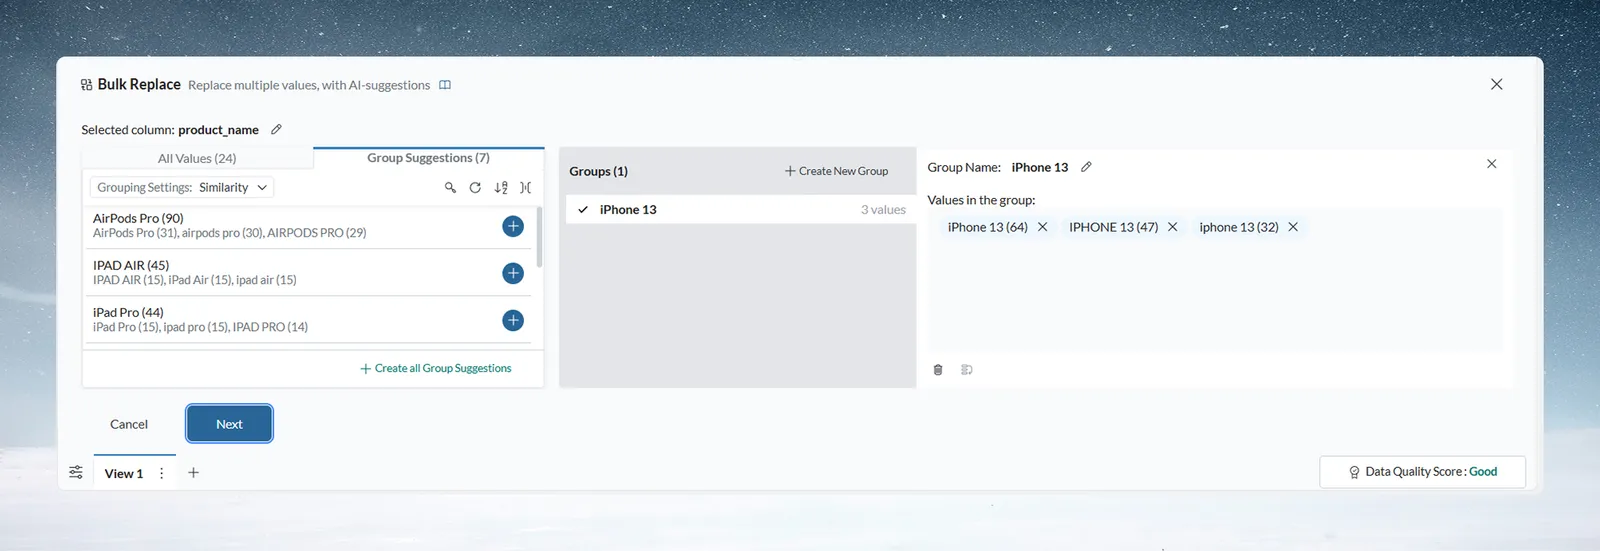
- Open the Group Suggestions tab. Mammoth proposes groups of values that look like variants of one another, for example "iPhone 13", "iphone 13" and "IPHONE 13".
- Click Add suggestion on each group you want, or Create all Group Suggestions. Each group's Group Name is the value that replaces its variants.
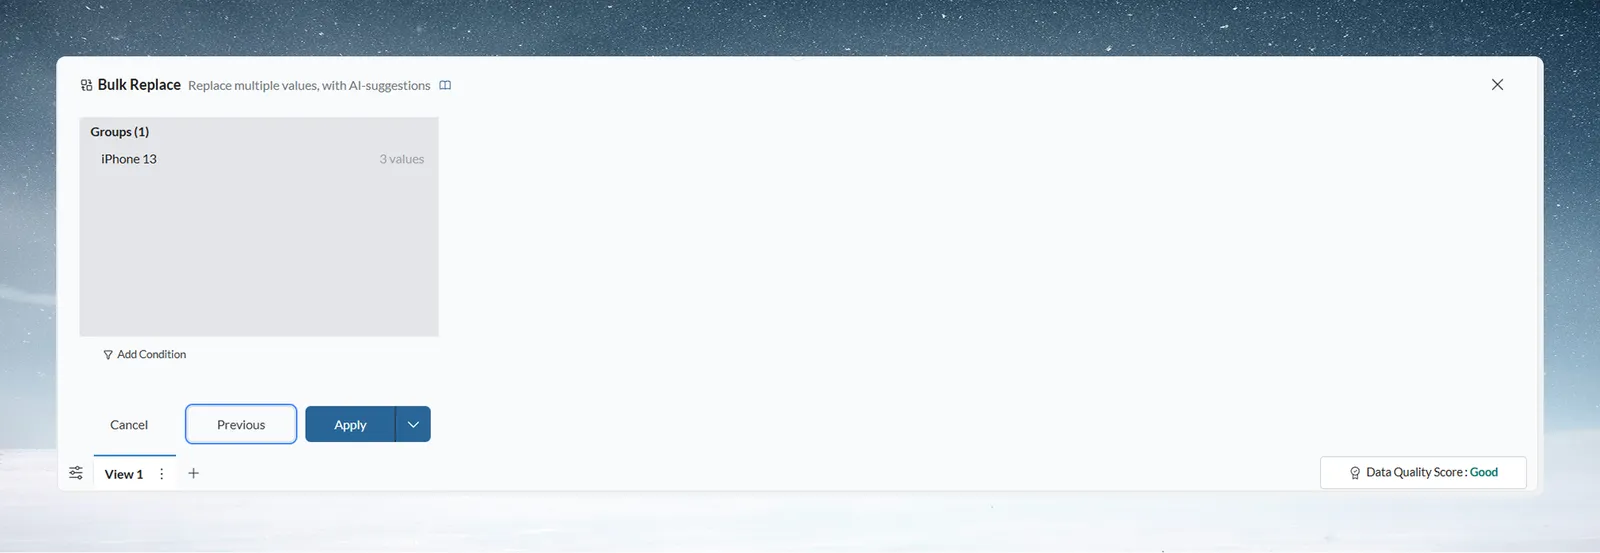
- Click Next to review the groups.
- Click Apply.
A Bulk Replace task now appears in the Pipeline panel on the left. The same task runs on any new data added to this dataset. See Find and replace values.
Step 4: Remove duplicate rows
- Click the + button (tooltip "Add a task").
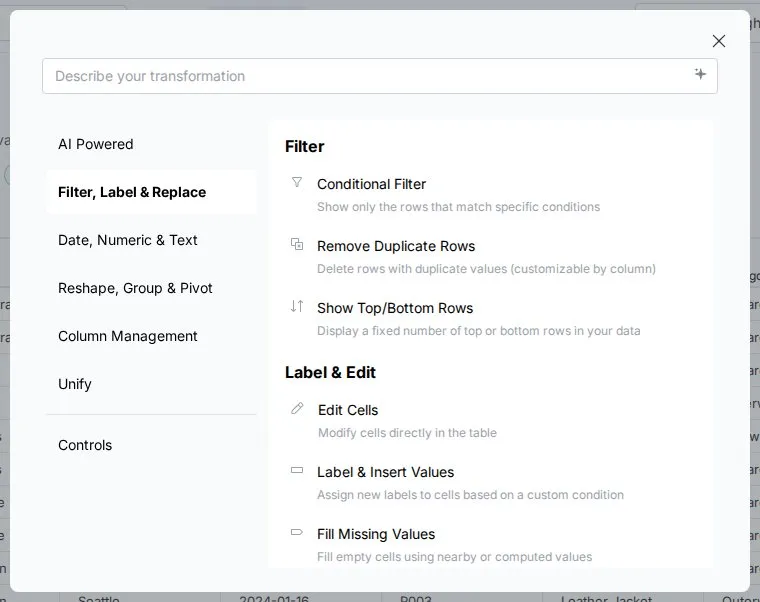
- In the Transform menu, open Filter, Label & Replace.
- Select Remove Duplicate Rows.
- Under Evaluate duplicates from, keep All columns to compare every column.
- Click Apply.
A Remove Duplicate Rows task appears under the first one, and the row count goes down. See Remove duplicates and check data.
Tasks run from top to bottom in your pipeline. You can drag tasks into a new order, and Mammoth runs the pipeline again in the new sequence.
Step 5: Filter to recent orders with a Conditional Filter
- Click +, then Filter, Label & Replace > Conditional Filter.
- The filter opens in SQL mode. Switch the SQL / Builder toggle to Builder.
- Set the column to order_date.
- Set the condition to is later than.
- Set the date to 2023-01-01.
- Click Apply.
Date conditions need a date column. If order_date is text, add a Convert Column Type task first (see Column types). The pipeline now has three tasks. See Filter rows for every condition.
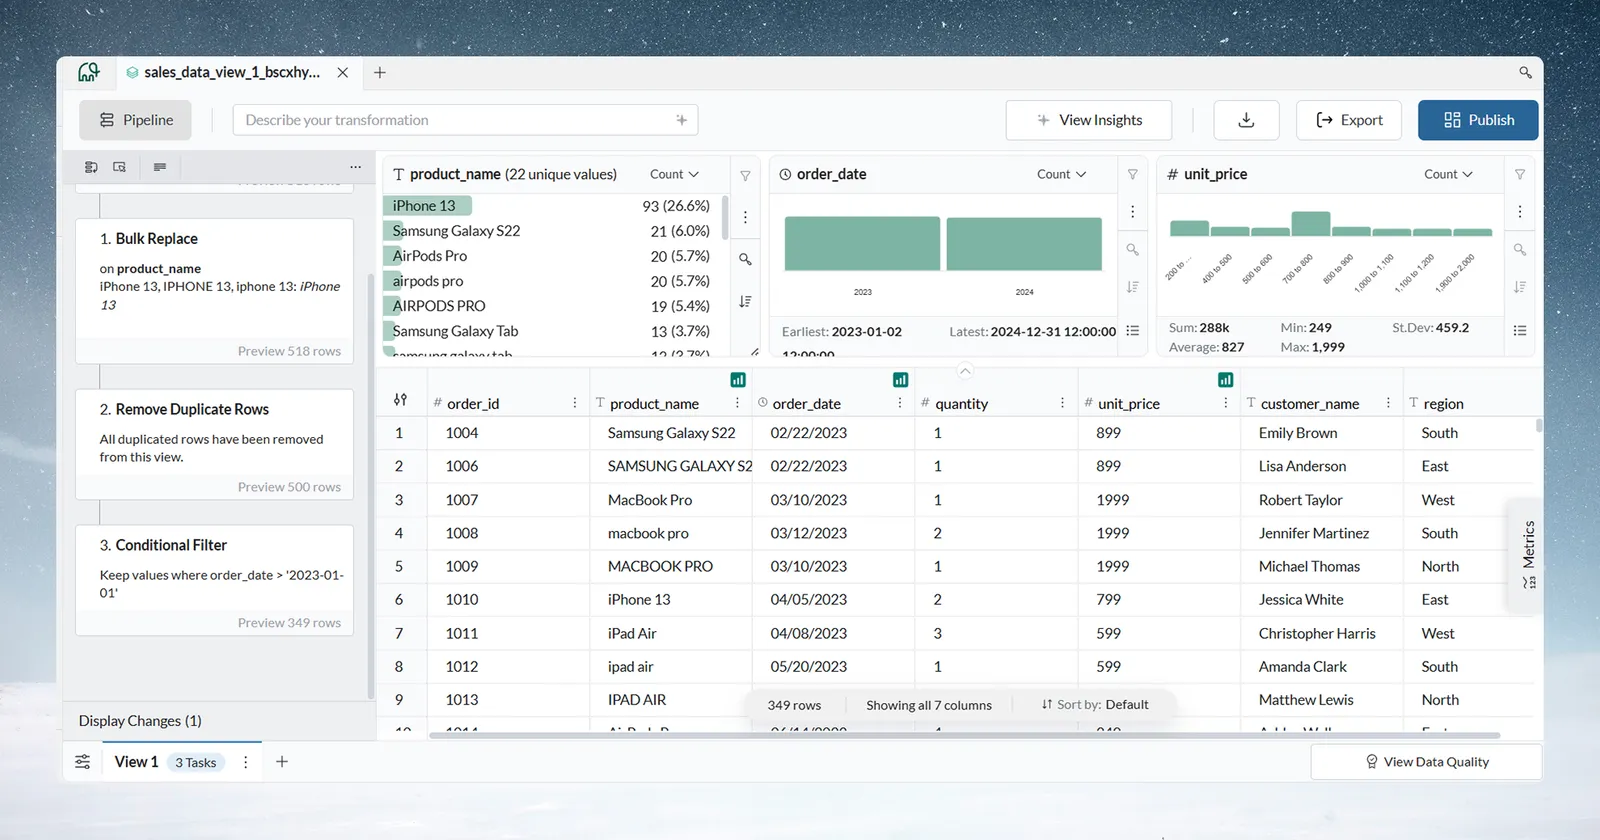
You built a three-task pipeline without writing code. Each task runs in order and you see the result straight away. The pipeline is saved with the view, so the same steps apply when new data arrives.
Step 6: Check each task in the pipeline
- Look at the Pipeline panel on the left of the view. Each task card shows its function and key settings.
- Click a task to open its settings in the function panel, where you can change them.
- To see the data as it was right after a task, hover the row count in the task card's footer (tooltip "Preview Data at this Task") and click it.
- Click Exit Preview to go back.
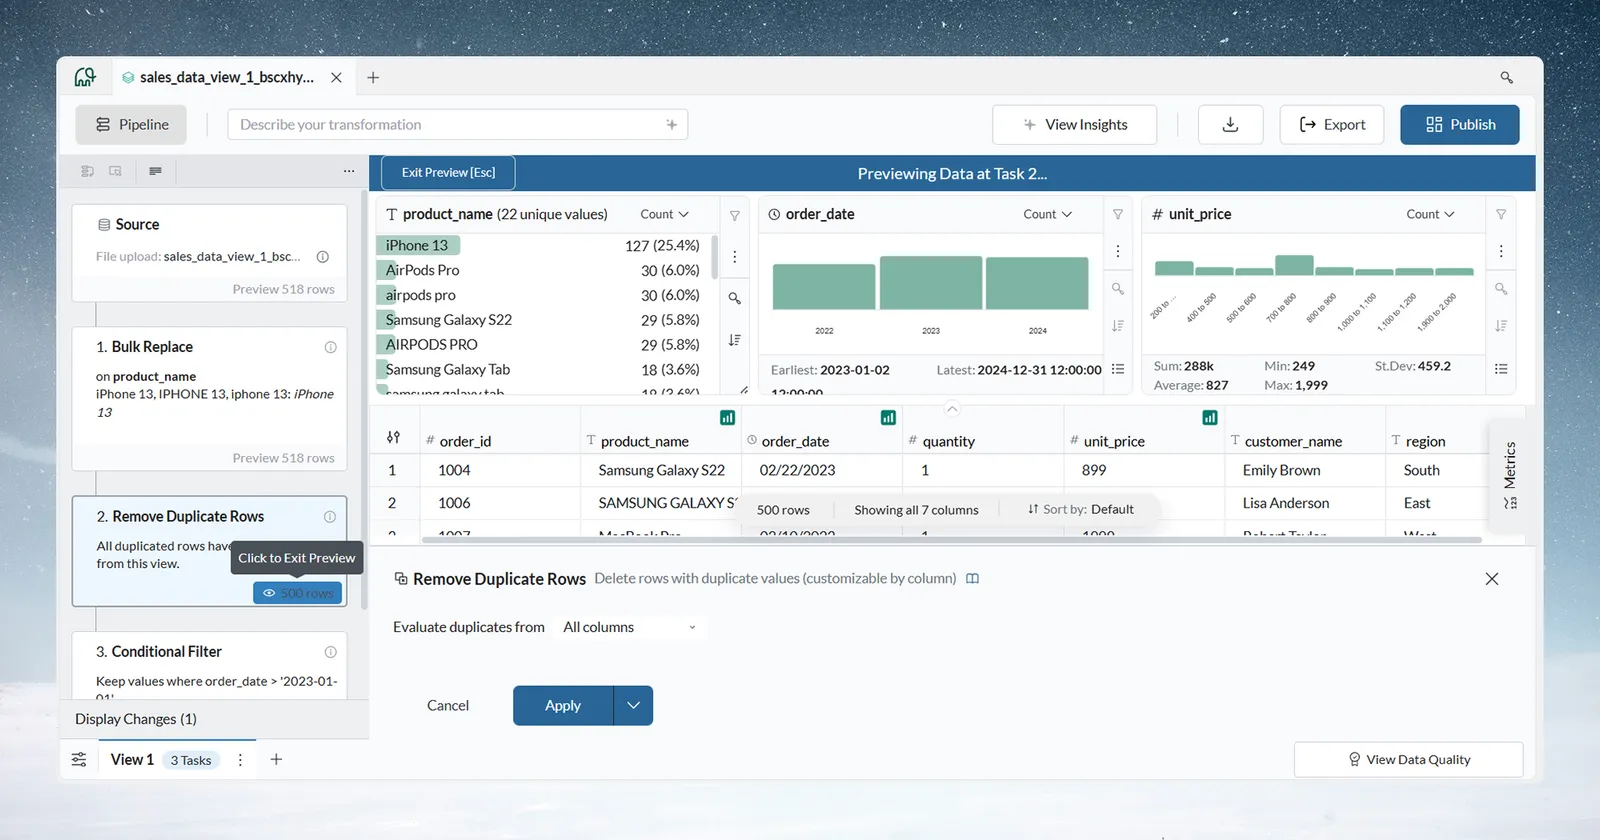
Every change is listed as a task, so team members can follow your logic. The pipeline is:
- Repeatable: new batches of data run through the same tasks.
- Readable: every transformation is listed in the Pipeline panel.
- Reusable: you can copy tasks into another view.
Step 7: Download the cleaned data as a CSV file
- Click the download icon (⬇) in the view toolbar to open the Save a copy menu.
- Keep Download file selected.
- Under Format, select CSV.
- Click Download CSV.
- Open the file. Product names are consistent, duplicates are gone, and only recent orders remain.
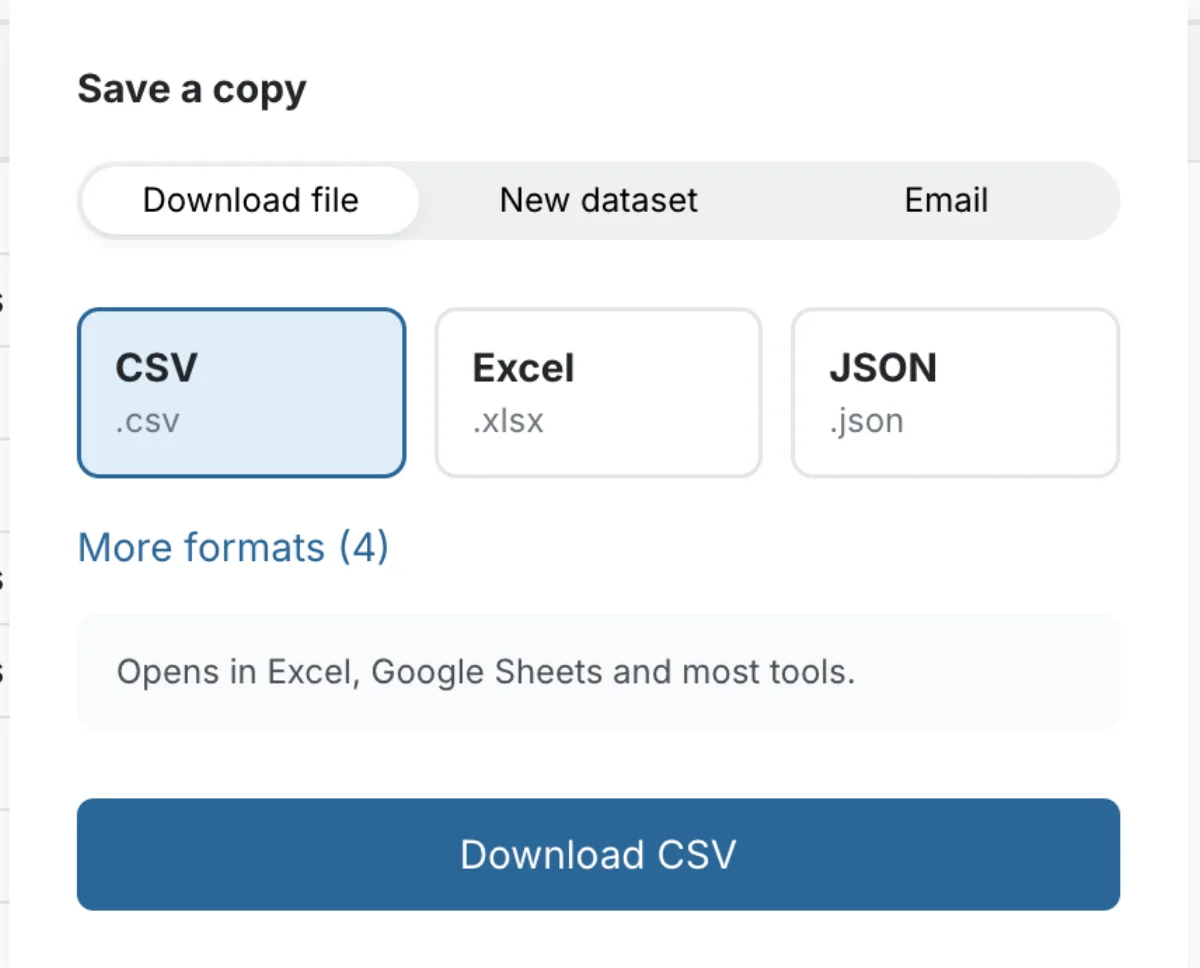
The Save a copy menu has these choices:
| Option | What it does |
|---|---|
| Download file | Downloads a file in the format you pick |
| New dataset | Saves these rows as a new dataset in this project |
| Sends the file once, now, to people in this workspace | |
| CSV | Comma-separated text |
| Excel | An Excel workbook, up to 50,000 rows |
| JSON | For developers, apps and APIs |
| More formats | NDJSON, XML, YAML and Parquet |
See Download data.
Step 8: Build a dashboard from the clean view
- Click Dashboards in the left sidebar, then Create.
- On What do you want to build?, choose your view under With my data.
- Pick a format: Dashboard, Slides, Doc, Q&A or Explore.
- Build one of the ideas Mammoth suggests from your columns, or describe the dashboard you want, for example "sales dashboard showing revenue by region".
- Refine it with the AI chat or by hand.
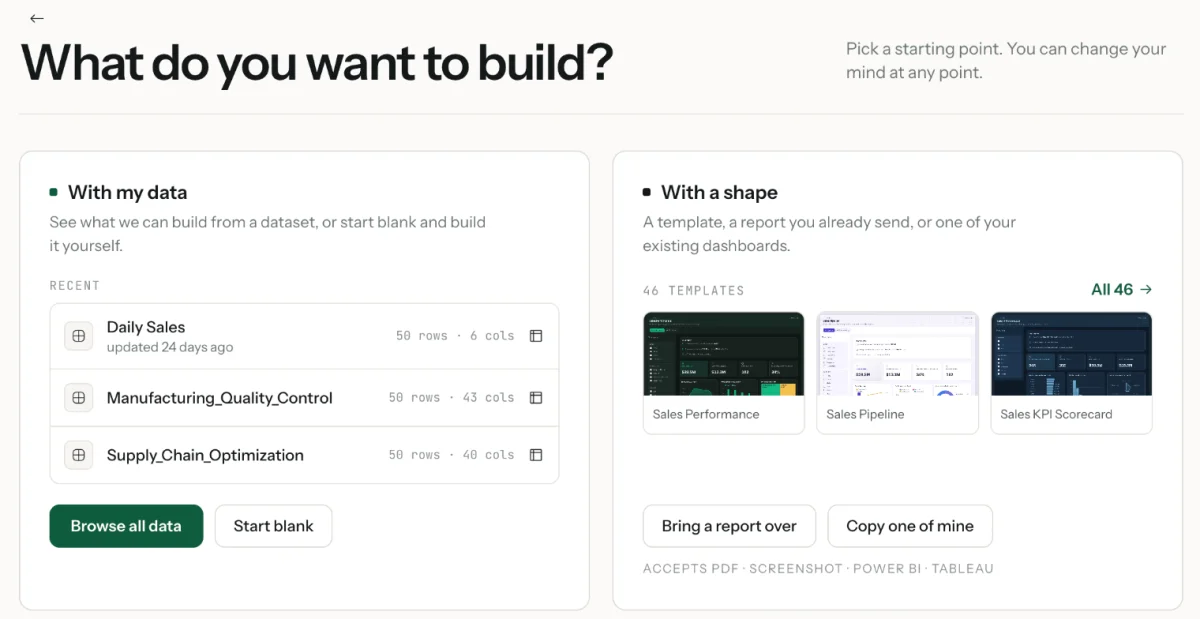
You can also start from the view itself: click Publish in the view toolbar to open the same create page. See Create a dashboard.
Step 9: Publish and share the dashboard link
- Save your changes in the dashboard editor. You can't publish with unsaved changes.
- Click Publish in the header. The Share panel opens.
- Click Publish, or Publish & copy link to publish and copy the link in one step.
- In the Access menu, choose who can open the link.
- Send the link.
| Access option | Who can open the link |
|---|---|
| Sign-in required | People who sign in to Mammoth: everyone in the project, plus people you invite by email |
| Anyone with the link and password | Anyone who has the link and the password (8 to 128 characters) |
| Anyone with the link | Anyone who has the link, with no sign-in |
By default, everyone in the dashboard's project has access. Your plan sets how many dashboards you can publish. See Publish and share a dashboard.
What you did in this quick start
- Upload: drag a file into the New dataset dialog.
- Explore: add Explore Cards and check View Data Quality.
- Transform: add tasks from the column menu or the + button, with no code.
- Reuse: the pipeline applies to new data.
- Export: download a copy, or send it to other systems.
- Share: publish a dashboard on the clean data.
Keep the data current after the quick start
- Add next month's file to the same dataset with Add or Replace data, and the pipeline cleans it too. See Add or replace data.
- Export after every run with Export, for example to Google Sheets or a database. See Send data to a database or BI tool.
- Email the view on a schedule with a Messaging automation. See Send messages.
- Try it with your own data: upload a real file from your work, explore it, build tasks for your actual business problem, and share the result with your team. Learn on a small file first, then apply the same steps to larger datasets.
Get help while you learn
- Support: click the Support chat icon at the bottom of the left navigation to ask a question or report an issue.
- Documentation: open the account menu (tooltip "My account") in the left navigation and choose Documentation.
- Troubleshooting: see Troubleshooting.
Related
- Build your first pipeline: a step-by-step tutorial on built-in sample data, with task options and fixes.
- Core ideas: how datasets, views, pipelines and tasks fit together.
- Pick your path: next steps for analysts, managers and technical users.
- Explore cards: every way to filter from a card.
- How the pipeline works: how tasks run, task previews and Draft mode.
- Edit, reorder and copy tasks: preview the data at a task and restore an earlier pipeline version.
Something wrong? support@mammoth.io