Create metrics and KPIs in the Mammoth Metrics panel
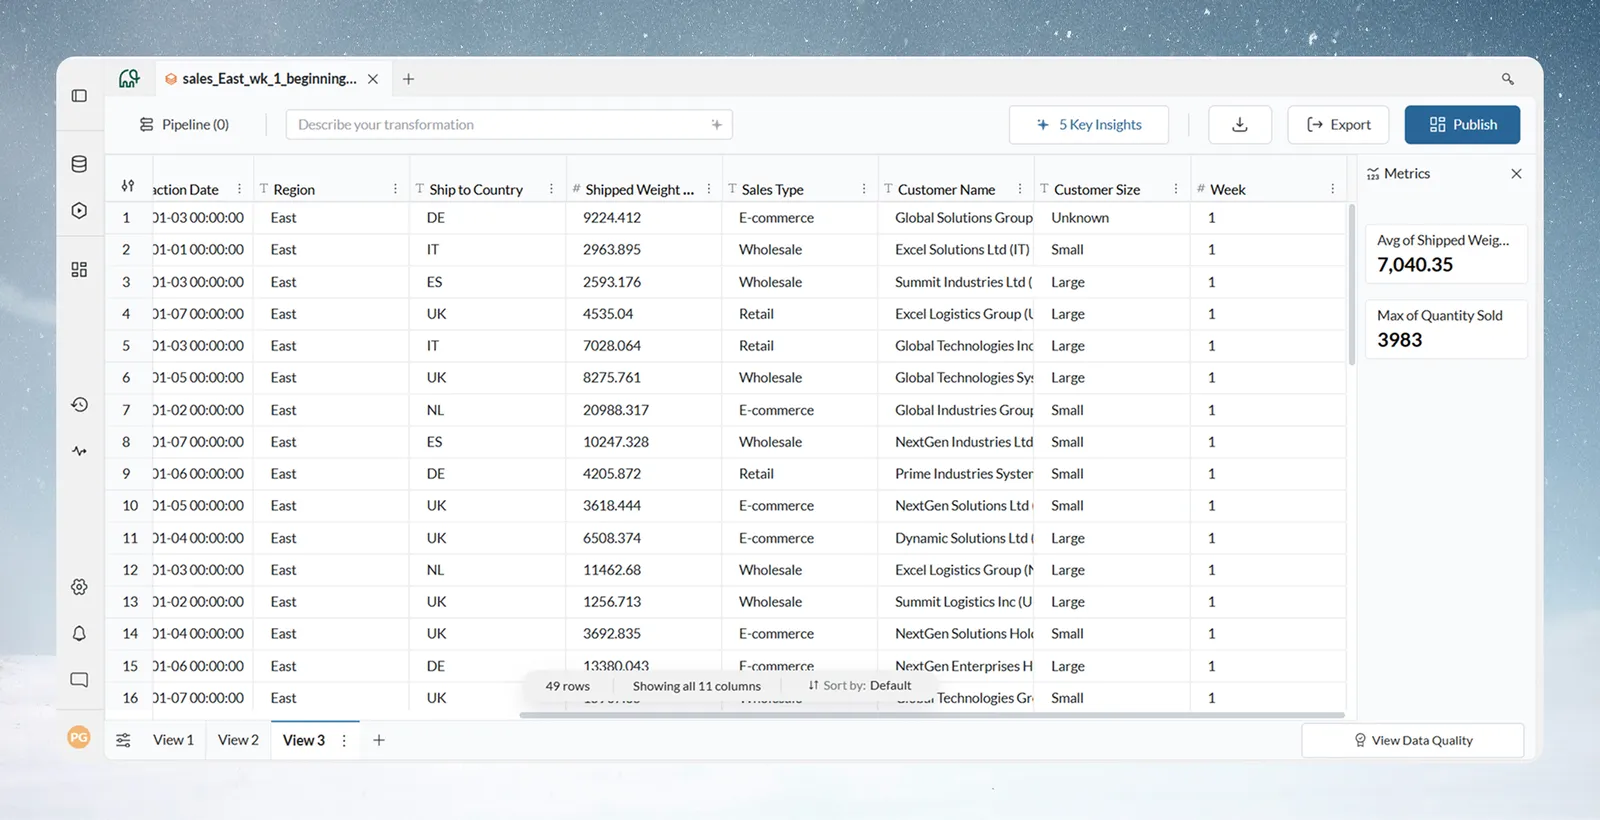
The Metrics panel calculates single numbers from your columns, such as total revenue, average deal size or defect rate. Open it from the Metrics icon in the data editor's action bar, or create one from a number column's header with Create Metric. Metrics update as you filter with Explore Cards, unless you lock them; they are unavailable in preview mode.
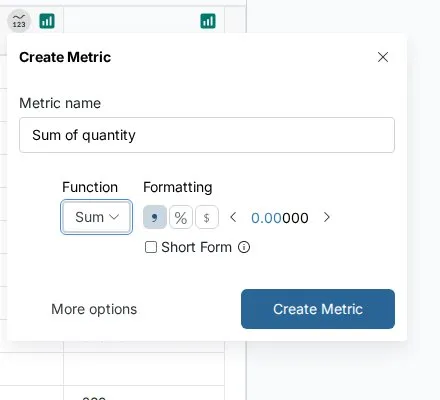
Create a metric from a column header
Use this for a quick Sum, Average, Standard Deviation, Min or Max of one column.
- Hover a number column's header in the data grid.
- Click the Create Metric icon that appears (number columns only).
- In the Create Metric popup, check the Metric name (filled in, for example "Sum of quantity_on_hand", and editable).
- Pick a Function: Sum, Average, Standard Deviation, Min or Max.
- Set Formatting: currency, percentage, decimals and short form.
- Click Create Metric. A "Metric added" message confirms it.
To add a title, subtitle, description, expression or conditions, click More options instead. The full metric editor opens with these settings filled in.
Open the Metrics panel
Two controls open the same panel:
- the Metrics icon in the action bar at the top of the data editor, next to the Highlights icon (it shows an active state while the panel is open);
- the rotated "Metrics" tab on the right edge of the View, which shows how many metrics the View has.
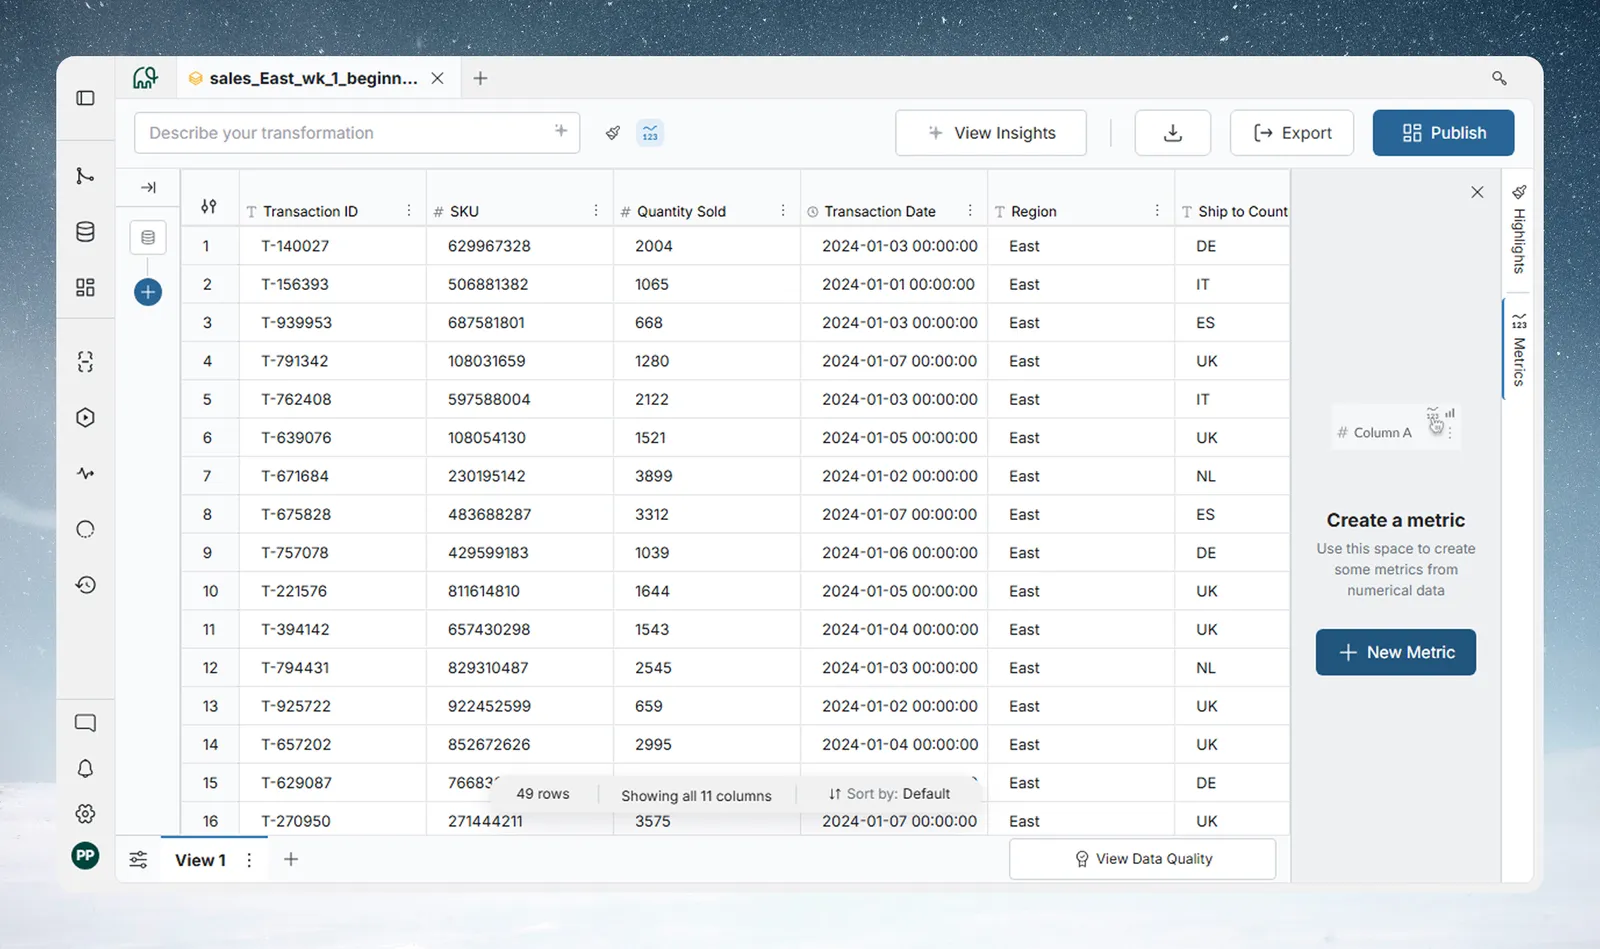
With no metrics, the panel shows Create a metric, "Use this space to create some metrics from numerical data" and a + New Metric button. Once it has cards, add more with the blue + button at the bottom of the panel.
In preview mode, the panel says metrics are unavailable and, when the View has metrics, offers Exit Preview.
Create a metric with AI, SQL or a formula
Click + New Metric. The modal opens in SQL mode, with an AI expression generator at the top. A switch changes between SQL and Formula. The book icon beside the title opens the documentation.
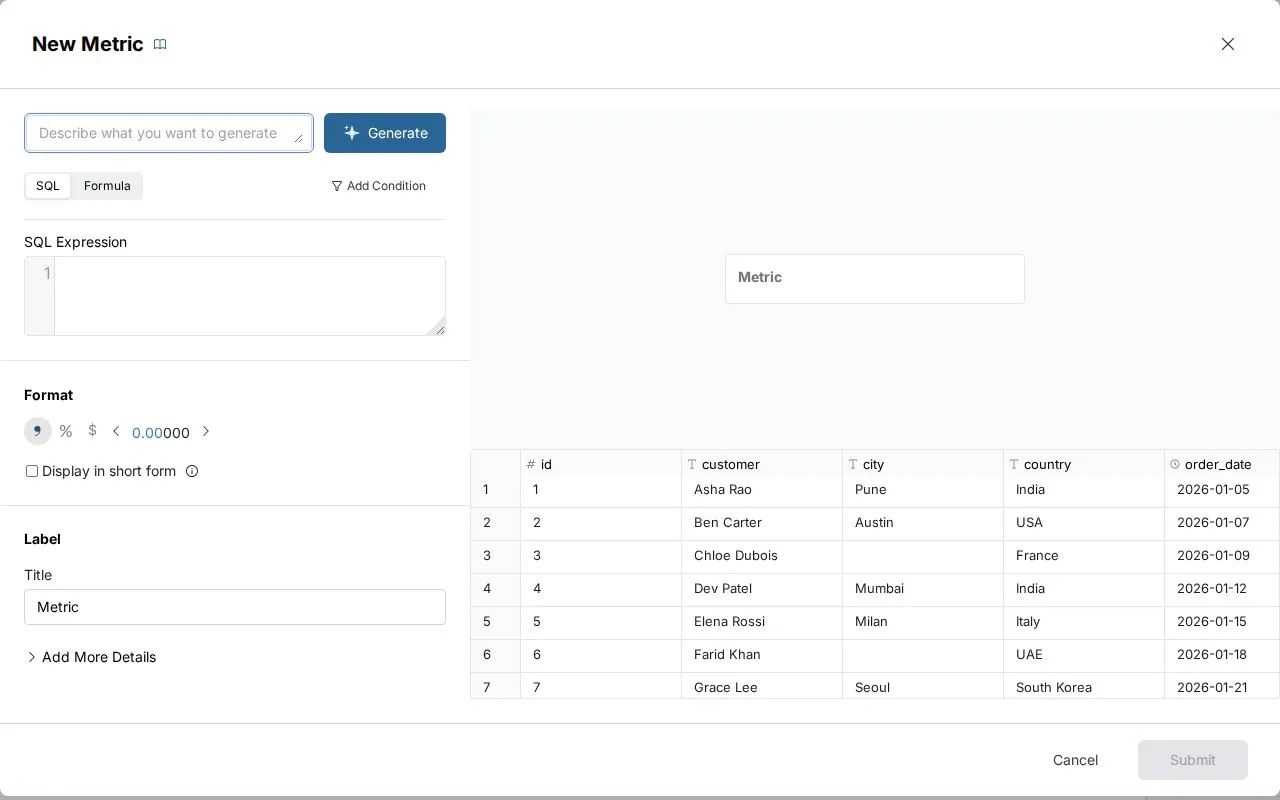
Describe the metric and let AI write the SQL
- Type what you want in the box labelled "Describe what you want to generate", for example "Create a metric for the total quantity sold".
- Click Generate, or press Enter. The AI writes the SQL expression.
- Review it in the SQL Expression editor and adjust it if needed.
- Optionally add a condition to limit which rows count. If your description includes a filter, Mammoth can move it into the condition.
Build the expression yourself in Formula mode
Click Formula (next to SQL) and build the expression from functions and column references. You can add conditions here too. The editor shows "Looks good" when the syntax is valid.
| Mode | What you can use |
|---|---|
| Column header popup | Sum, Average, Standard Deviation, Min, Max |
| Formula | COUNT(), SUM("Column"), AVG("Column"), MIN("Column"), MAX("Column"), STDDEV("Column"), INT(expression), ABS(expression), combined with +, -, *, / and parentheses |
| SQL | Describe the metric in plain words and review the SQL, or edit the SQL directly |
Column names in formulas go in double quotes: SUM("deal_value"), not SUM(deal_value).
Formula examples:
| Metric | Formula | Condition or format |
|---|---|---|
| Net revenue | SUM("gross_amount") - SUM("discount") - SUM("tax") | |
| Performance against target | (SUM("actual_quantity") / SUM("target_quantity")) * 100 | Format as % to show 87.5% |
| Completed sales | SUM("amount") | Condition: status is Completed |
| Open high-priority items | COUNT() | Conditions: priority is High and status is Open |
For a calculation that needs different conditions in one expression, such as a defect rate or a win rate, use SQL mode and describe it in plain words.
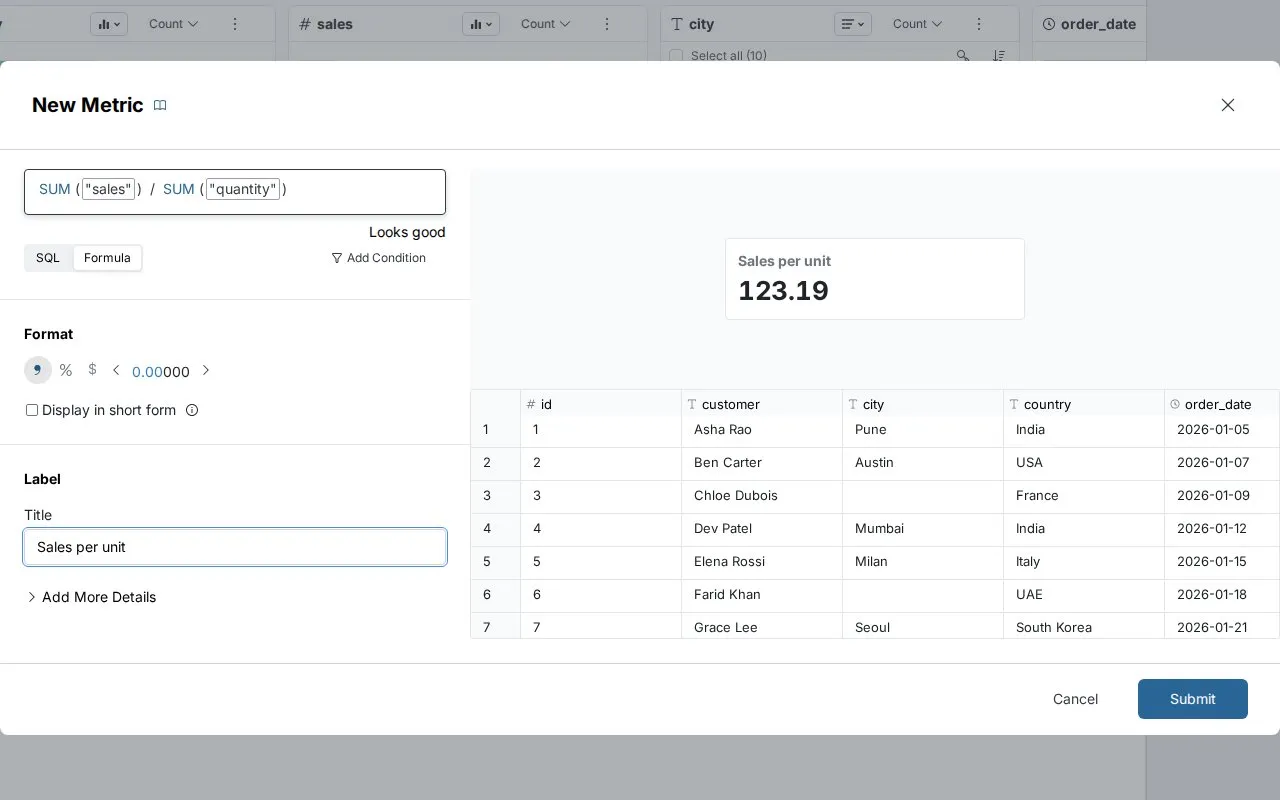
Preview, label and submit
The right side of the modal previews the metric card with its current result, above a grid of the underlying rows.
| Label field | What it is |
|---|---|
| Title | The main label on the card (required). It starts as "Metric", or as "Sum of quantity_on_hand"-style text when you start from a column header |
| Add More Details | Reveals Subtitle (a short line under the value, such as "Q4 2024" or "West Region only") and Description (longer, smaller grey text under the value; hover the card to read it in full) |
Click Submit. It stays disabled, with a tooltip saying why, until the metric has a title and a valid expression, and while the SQL is still generating. If another metric already has the title, Mammoth adds a number (for example "Total sales 1").
Format a metric as currency, a percentage or short form
The same format options appear in the column header popup and the full modal.
| Option | What it does |
|---|---|
| Numeric (default) | Plain number |
| Thousands separator (on by default) | Shows 1,234 instead of 1234 |
| % | Percentage |
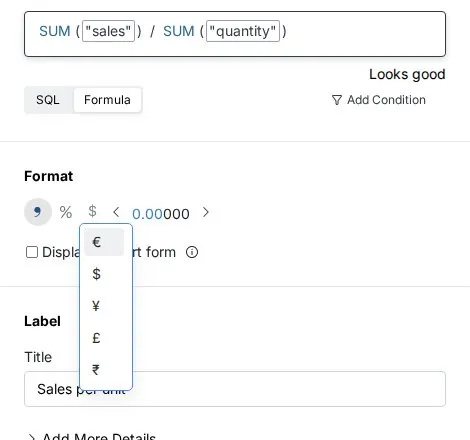
| Currency | USD ($), EUR (€), GBP (£), JPY (¥) or INR (₹) |
Decimal arrows (< 0.00000 >) | 0 to 5 decimal places (2 by default). Disabled while short form is on |
| Display in short form | 1,234,567 → 1.23M; 45,600 → 45.6K |
Use currency for revenue, percentage for rates and ratios, and short form for large counts.
Use a project parameter in a metric condition
A metric's condition can use a project or workspace parameter, so one value (a threshold, a date, a name) is set in one place. See Parameters and snippets.
- In the New Metric modal, click Add Condition.
- Pick the column and the operator.
- For the value, choose Parameter (Bind to a project parameter) instead of Value (A fixed value).
- Click Select a parameter and pick one. Only parameters whose type fits the column are offered; if none fit, the list shows "No parameters available".
- Click Apply Condition, then Submit.
Example: SUM("sales") with the condition "discount greater than the parameter max_discount" adds up sales above the current discount threshold.
The expression itself has no Insert Parameter button, in SQL or Formula mode. To use a parameter inside a calculation, use a Math step in the pipeline. See Calculate with formulas.
The metric uses the parameter's value when you save it. After you change the parameter, the metric picks up the new value the next time the View's pipeline runs. If the parameter is deleted, the metric keeps the last value as a fixed value.
Copy, edit, duplicate, lock or delete a metric card
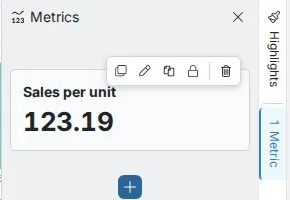
A card shows its title (with a lock icon when locked), the value, the Subtitle and the Description. A metric built from a plain-English description shows it in a row you can click to see the generated query. A metric with a condition shows it as a filter summary. If a metric can't be calculated, the card shows Error; hover it to see why.
Hover a card to see five action icons. They are disabled while the pipeline has an error.
| Icon | What it does |
|---|---|
| Copy to clipboard | Copies the title and current value at once, for example Total sales: 5.2M |
| Edit (pencil) | Opens the full editor: expression, Title, Subtitle, Description and formatting |
| Duplicate | Opens "Duplicate metric" with the original expression. The title gets a number, for example "Weight per unit sold 1". Edit or submit as is |
| Lock | Freezes the metric against explore filters. It keeps the filters active when you locked it. Click again to unlock |
| Delete (trash) | Removes the metric after you confirm |
Drag a card by its header to reorder the cards.
Watch metrics change as you filter
Metrics recalculate when you filter with Explore Cards. For example, before filtering: Total Revenue $5.2M, Average Deal $12,340, Order Count 421, Win Rate 67%. After double-clicking "West" on the Region card: $1.8M, $14,560, 124 and 72%.
Compare a segment with the total using lock
Lock a metric while no filters are on to keep its all-data value.
- Lock "Total Revenue" at $5.2M.
- Filter Region to West.
- Create another Revenue metric and leave it unlocked. It shows $1.8M.
- Compare: West is about 35% of total revenue.
The same works for any segment: a locked Total Sales of $3.2M beside an unlocked $1.1M filtered to East shows East is 34% of the business.
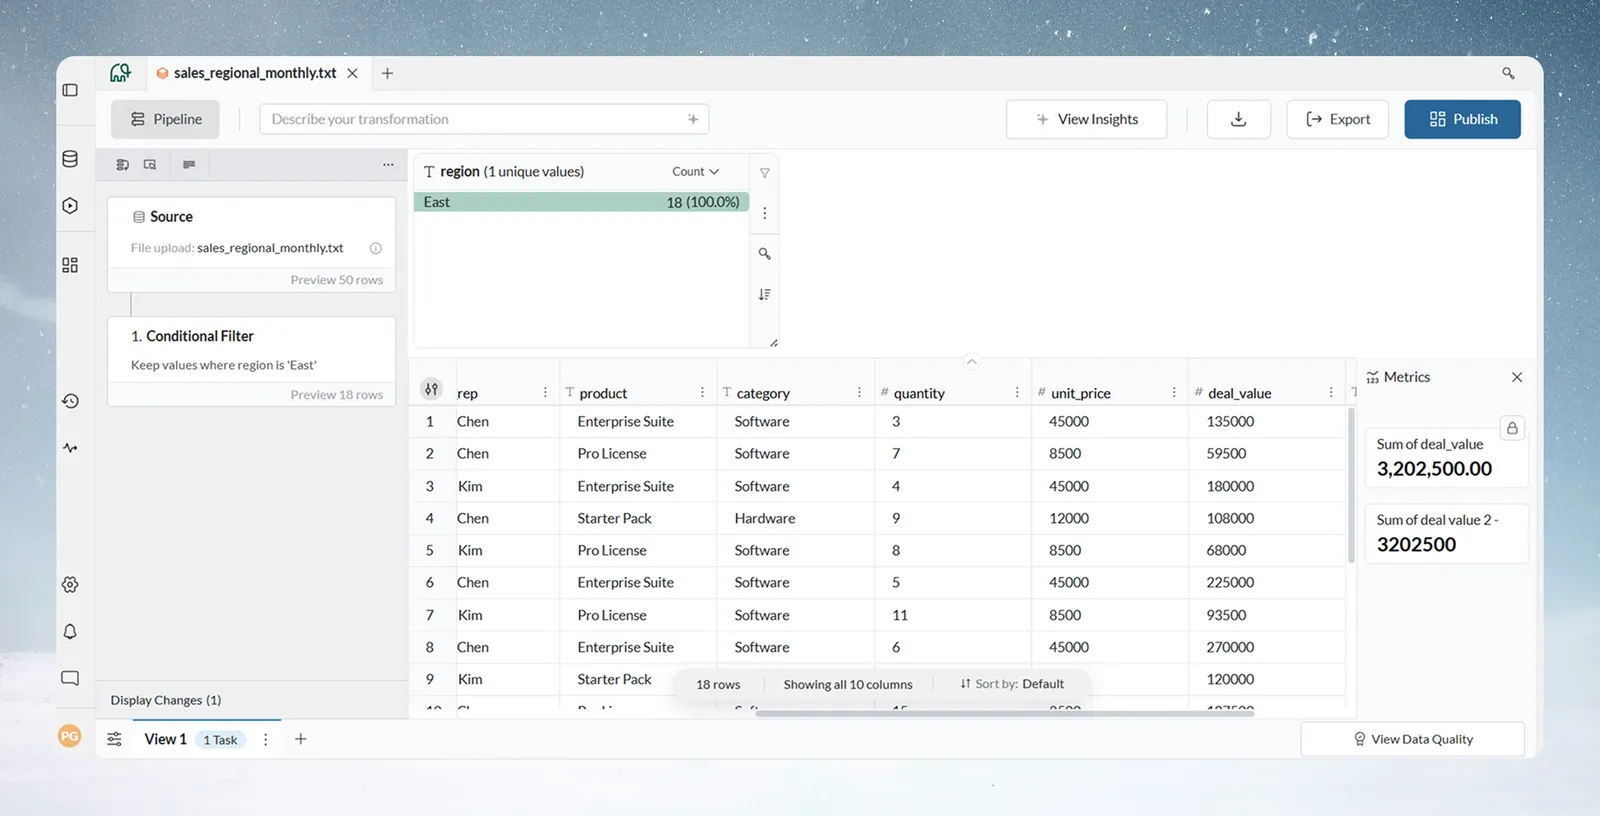
To follow a trend, filter month by month (Jan, Feb, Mar) and watch the values change.
Example metric sets
- Sales:
SUM("deal_value"),AVG("deal_value"),COUNT()withstatusisWon, and a win rate in SQL mode. - Manufacturing quality:
COUNT(),COUNT()withdefect_severityis notNone, a defect rate in SQL mode, andAVG("yield_percentage"). - Compliance:
COUNT(),COUNT()withamount> 10000,SUM("amount")withamount> 10000, and a compliance rate in SQL mode.
A good start for any dataset is 3–5 metrics: a total count, a key sum, a main average and one or two business ratios.
Metrics compared with Explore Cards and View Insights
| Metrics panel | Explore Cards | View Insights | |
|---|---|---|---|
| Purpose | Single-value KPIs | Data distributions | AI-written observations |
| Made by | You, with calculations | You, for any column | The AI |
| Display | Large numbers with labels | Charts and ranked lists | Sentences |
| Kept | Saved with the View | Saved with the View | Saved until the View's data changes |
Use Explore Cards to find patterns, then create metrics to track the numbers behind them.
Troubleshooting metrics
| Symptom | Cause | Fix |
|---|---|---|
| Metric shows 0 or Error | Wrong column, Sum or Avg on a non-number column, unquoted column names, or nulls | Hover Error for the reason; check the column and type; write SUM("column_name") |
| Metric doesn't change when you filter | The metric is locked, or no filter is applied | Click the lock icon to unlock; check the filter badge beside Explore; refresh the View |
| Submit is disabled | No title, an invalid expression, or SQL still generating | Read the tooltip on Submit |
| Card icons are disabled | The pipeline has an error | Fix the failing step |
| Metrics panel says it is unavailable | You are in preview mode | Click Exit Preview |
Related
- Explore Cards: the filters metrics follow.
- View Insights: let AI summarize the View.
- Parameters and snippets: set a value once and use it in metric conditions.
- Tables, KPI cards, insights and text: show numbers on a dashboard.
- Schedules and triggers: refresh data on a schedule so metrics stay current.
- Use Mammoth on a phone: read metrics on a phone.
Something wrong? support@mammoth.io