How a Mammoth pipeline works: add and preview tasks
A pipeline is an ordered list of tasks inside a View that clean, reshape, calculate and combine your data. You build it in the Pipeline panel on the left of every View, adding tasks from the Transform menu (Describe your transformation or the blue + button). Once built, it re-runs every time the dataset refreshes: on a schedule, on a file upload event, or on a manual refresh.
What a pipeline is and how tasks run
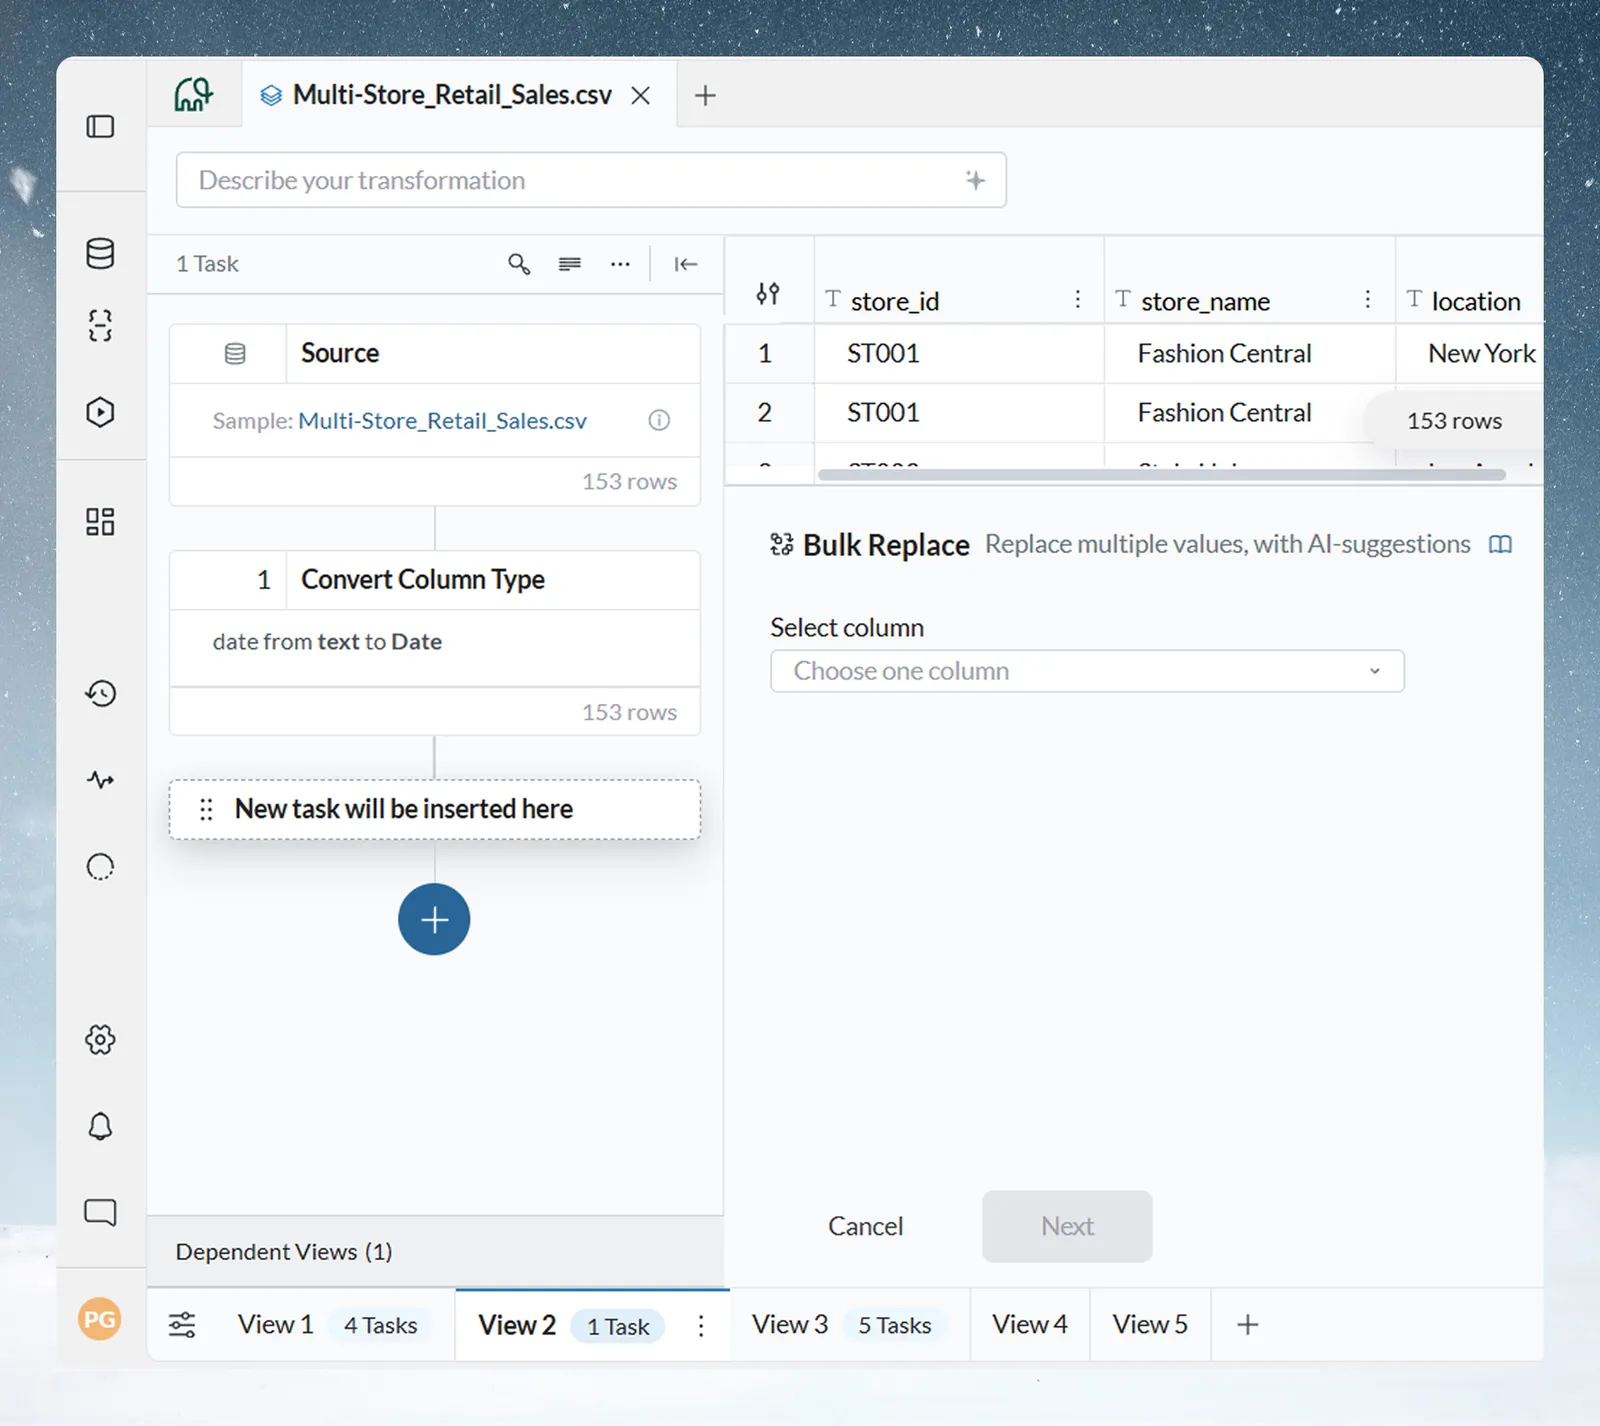
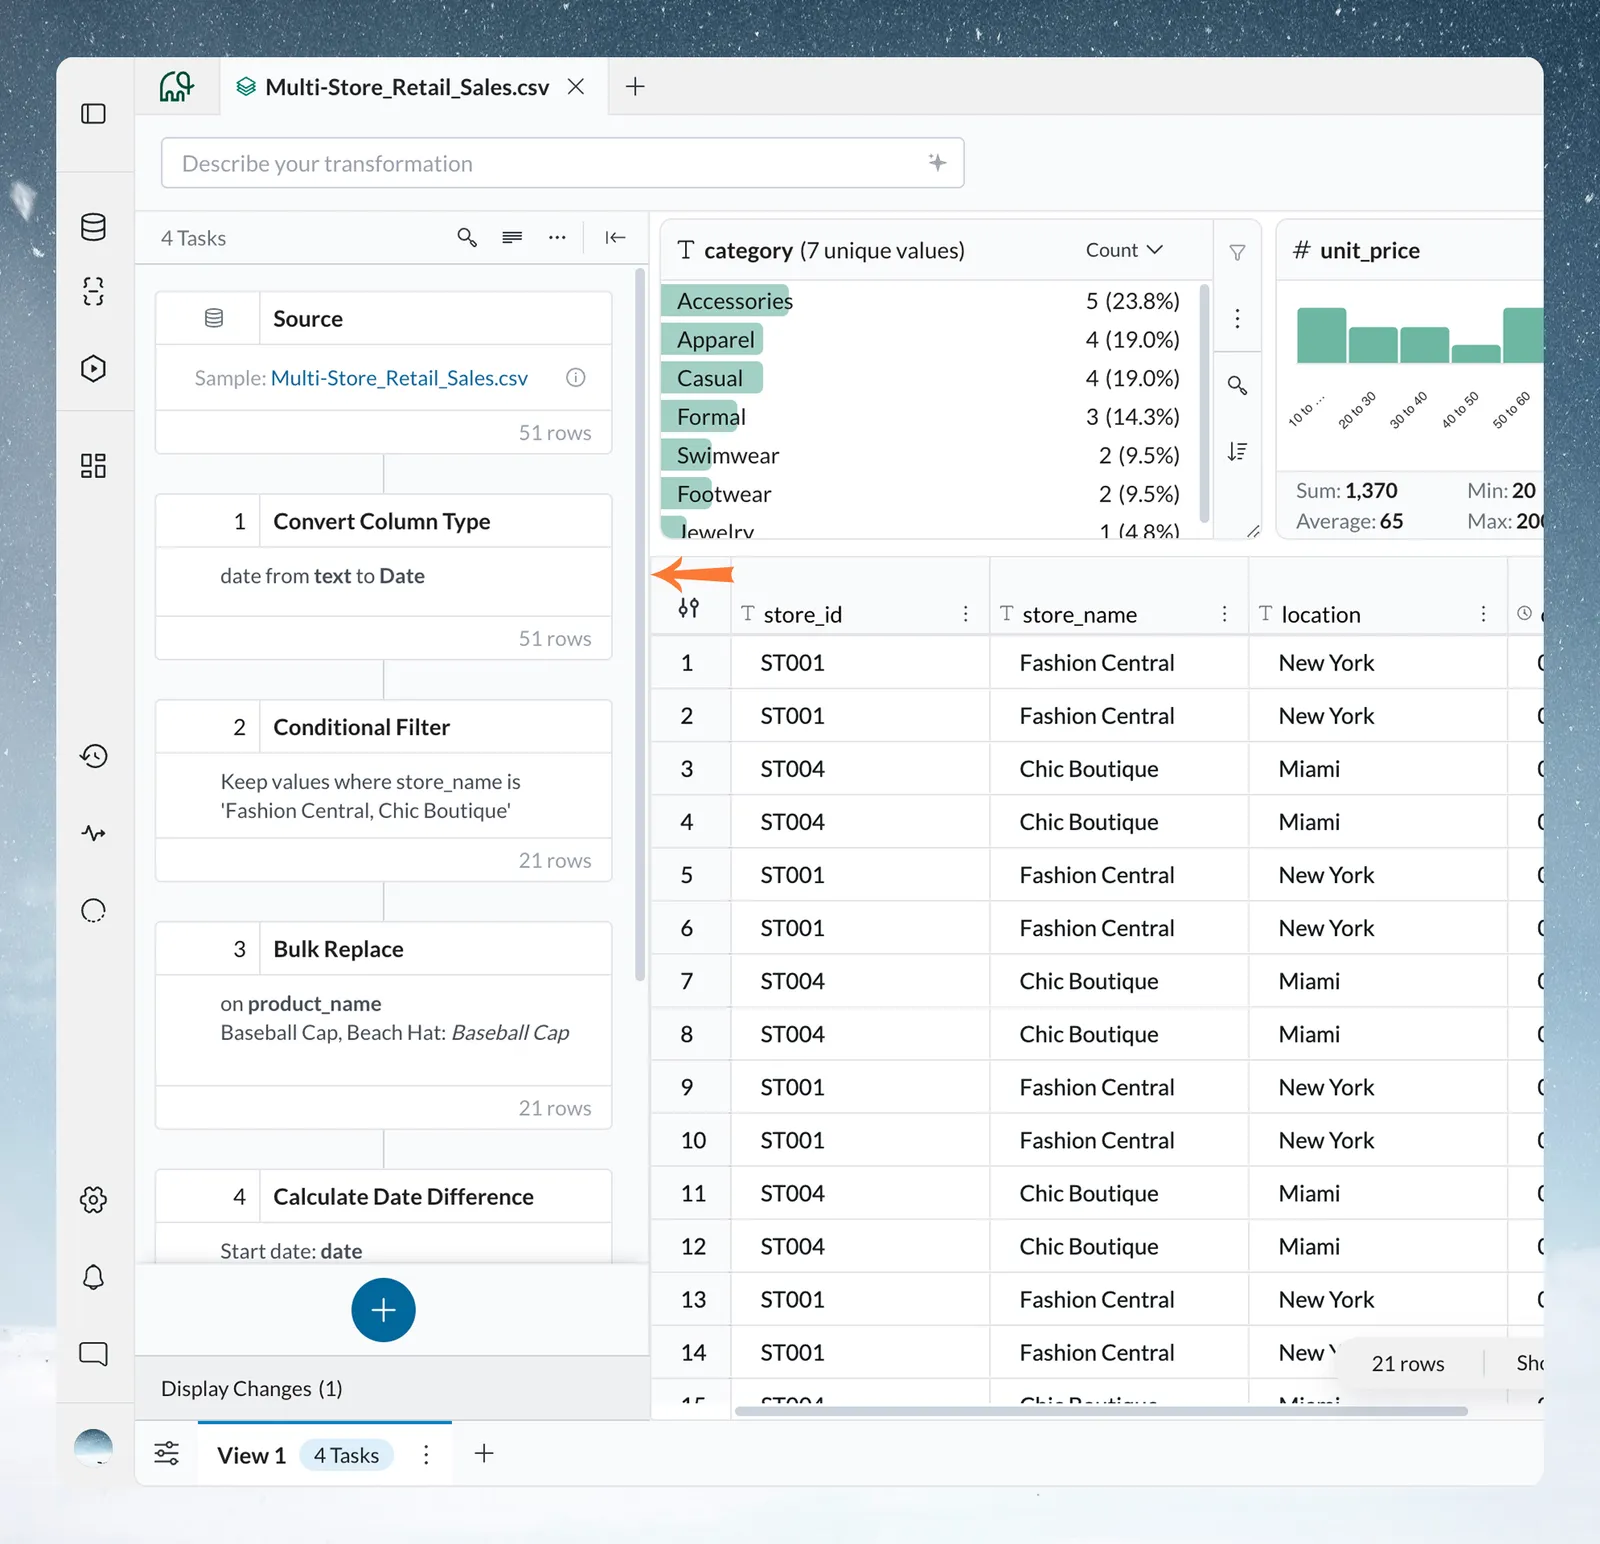
Each task is a separate, reversible operation applied to the rows of your View. Tasks run in order from top to bottom, and the output of task N is the input to task N+1. The first item in the Pipeline panel is always Source, the raw data coming in. The Source card appears as soon as you add your first task to a fresh View.
RAW DATA
   ↓
[Task 1: Remove Duplicate Rows]
   ↓
[Task 2: Conditional Filter: keep rows where Status = "Active"]
   ↓
[Task 3: Edit Cells: standardize Region column values]
   ↓
[Task 4: Join: merge with budget data from another dataset]
   ↓
CLEAN OUTPUT
Tasks are stored as instructions, not copies of the data. You can reorder, edit or delete any task without losing your source data. See Edit, reorder and copy pipeline tasks.
Pipeline tasks:
- run automatically every time new data flows through the View;
- apply to all the data, not only the rows you can see;
- run in the order they appear in the Pipeline panel, top to bottom;
- are part of automation, so they run when you schedule a pipeline;
- keep a complete history in the Activity Log.
All 30+ transformation functions, plus Data Check and Checkpoint, are pipeline tasks.
Pipeline tasks versus Display Changes
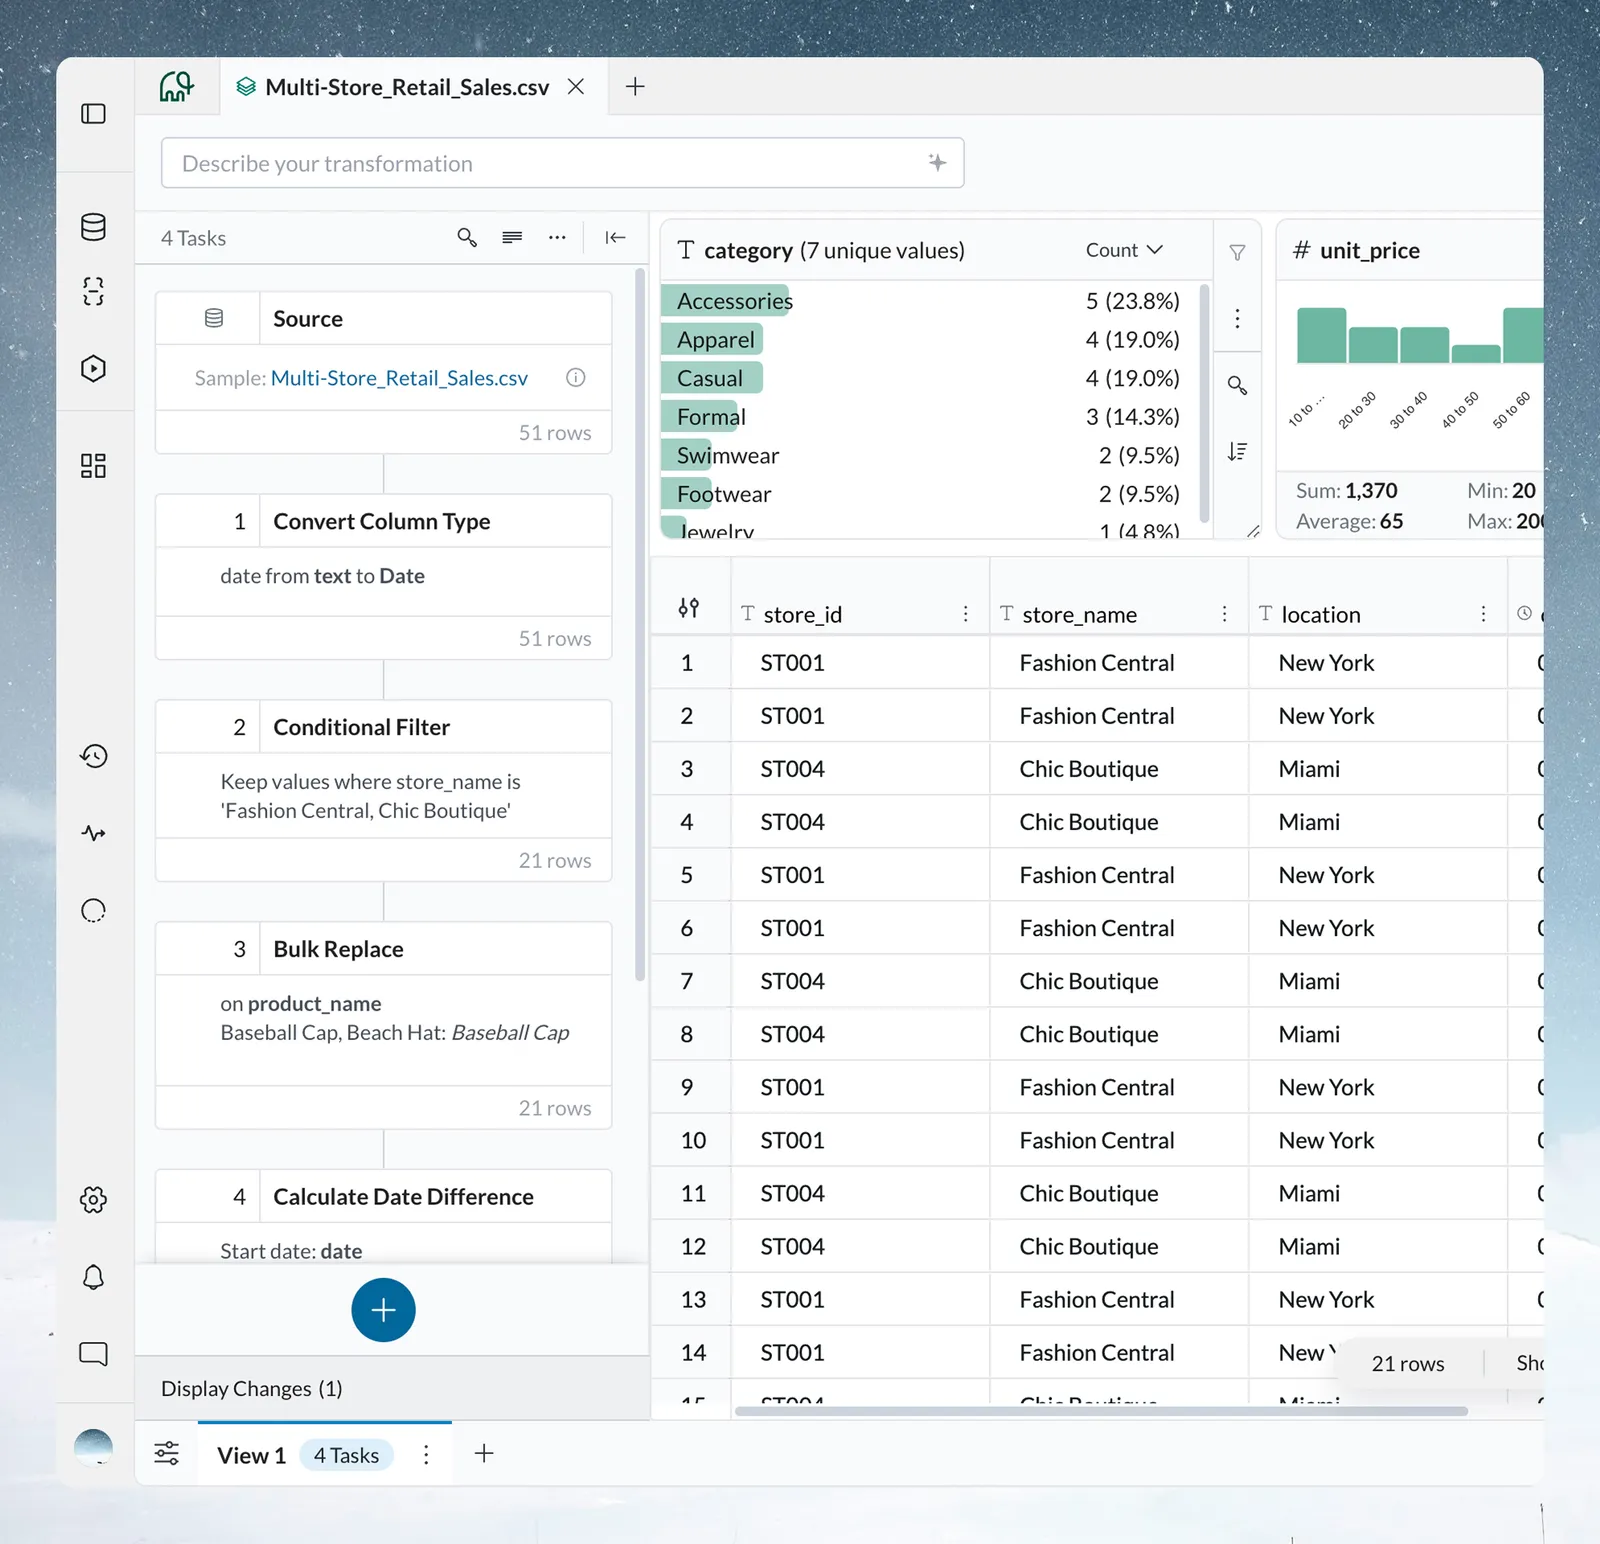
There are two separate ways to change a View:
| Display Changes | Pipeline tasks | |
|---|---|---|
| What they change | How data looks: column names, order, visibility, sorting, number and date formats | The data itself: filtering rows, calculating values, joining tables, cleaning text |
| Where you make them | A column's 3-dot menu, or by dragging columns | The Transform menu |
| When they run | Once, when you make them | Every time new data flows through the View |
There is no "Rename Column" pipeline task. To rename a column, double-click its header or choose Rename Column in its 3-dot menu. That creates a Display Change, and the new name appears in pipeline task dropdowns and exports. See Rename, format and sort columns.
Open the Transform menu
- Open any View.
- Click the Describe your transformation box in the action bar at the top of the View, or the blue + button next to it (tooltip "Add a task").
- The Transform menu opens on AI Powered, which lists five functions. A left panel lists the seven categories.
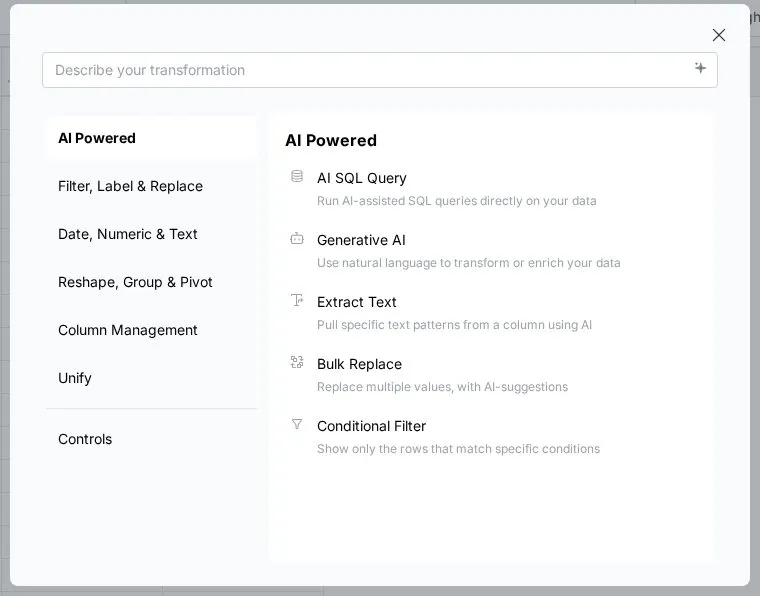
Type in the Describe your transformation box to filter the functions to those matching your keywords. The Ask in plain words result always appears and carries your typed text into its prompt.
Once the pipeline has tasks, you can also click a + button in the Pipeline panel: below the last task card, or between two cards to insert a task at that position. It opens the same Transform menu. Cards in an error state have no insert button.
| Category | Functions |
|---|---|
| AI Powered | Ask in plain words, Generative AI, plus shortcuts to Extract Text, Bulk Replace and Conditional Filter |
| Filter, Label & Replace | Conditional Filter, Remove Duplicate Rows, Show Top/Bottom Rows, Edit Cells, Label & Insert Values, Fill Missing Values, Bulk Replace, Find & Replace |
| Date, Numeric & Text | Add / Subtract Date Values, Extract Date Part, Financial Year, Calculate Date Difference, Math Function, Window function, Obtain Large or Small Values, Extract Text, Text Formatting, Extract JSON |
| Reshape, Group & Pivot | Group & Pivot, Unpivot |
| Column Management | Add Column, Copy Columns, Combine Columns & Text, Convert Column Type, Remove Column, Split Into Multiple Columns |
| Unify | Send to Dataset, Join (inner, left, right, outer), Lookup, Repeat Rows |
| Controls | Data Check, Checkpoint Alert |
For what each function does and which page covers it, see Every function in the Transform menu.
Describe a transformation in plain English
Some functions build the task from a plain-English description:
- Generative AI writes new column values with a large language model (classification, enrichment, translation, summaries). See Use AI on your columns.
- Ask in plain words turns a plain-language request into a SQL query and runs it on your data. See Write SQL with AI.
- Conditional Filter and Extract Text have an AI generation bar: describe the rule and Mammoth builds it.
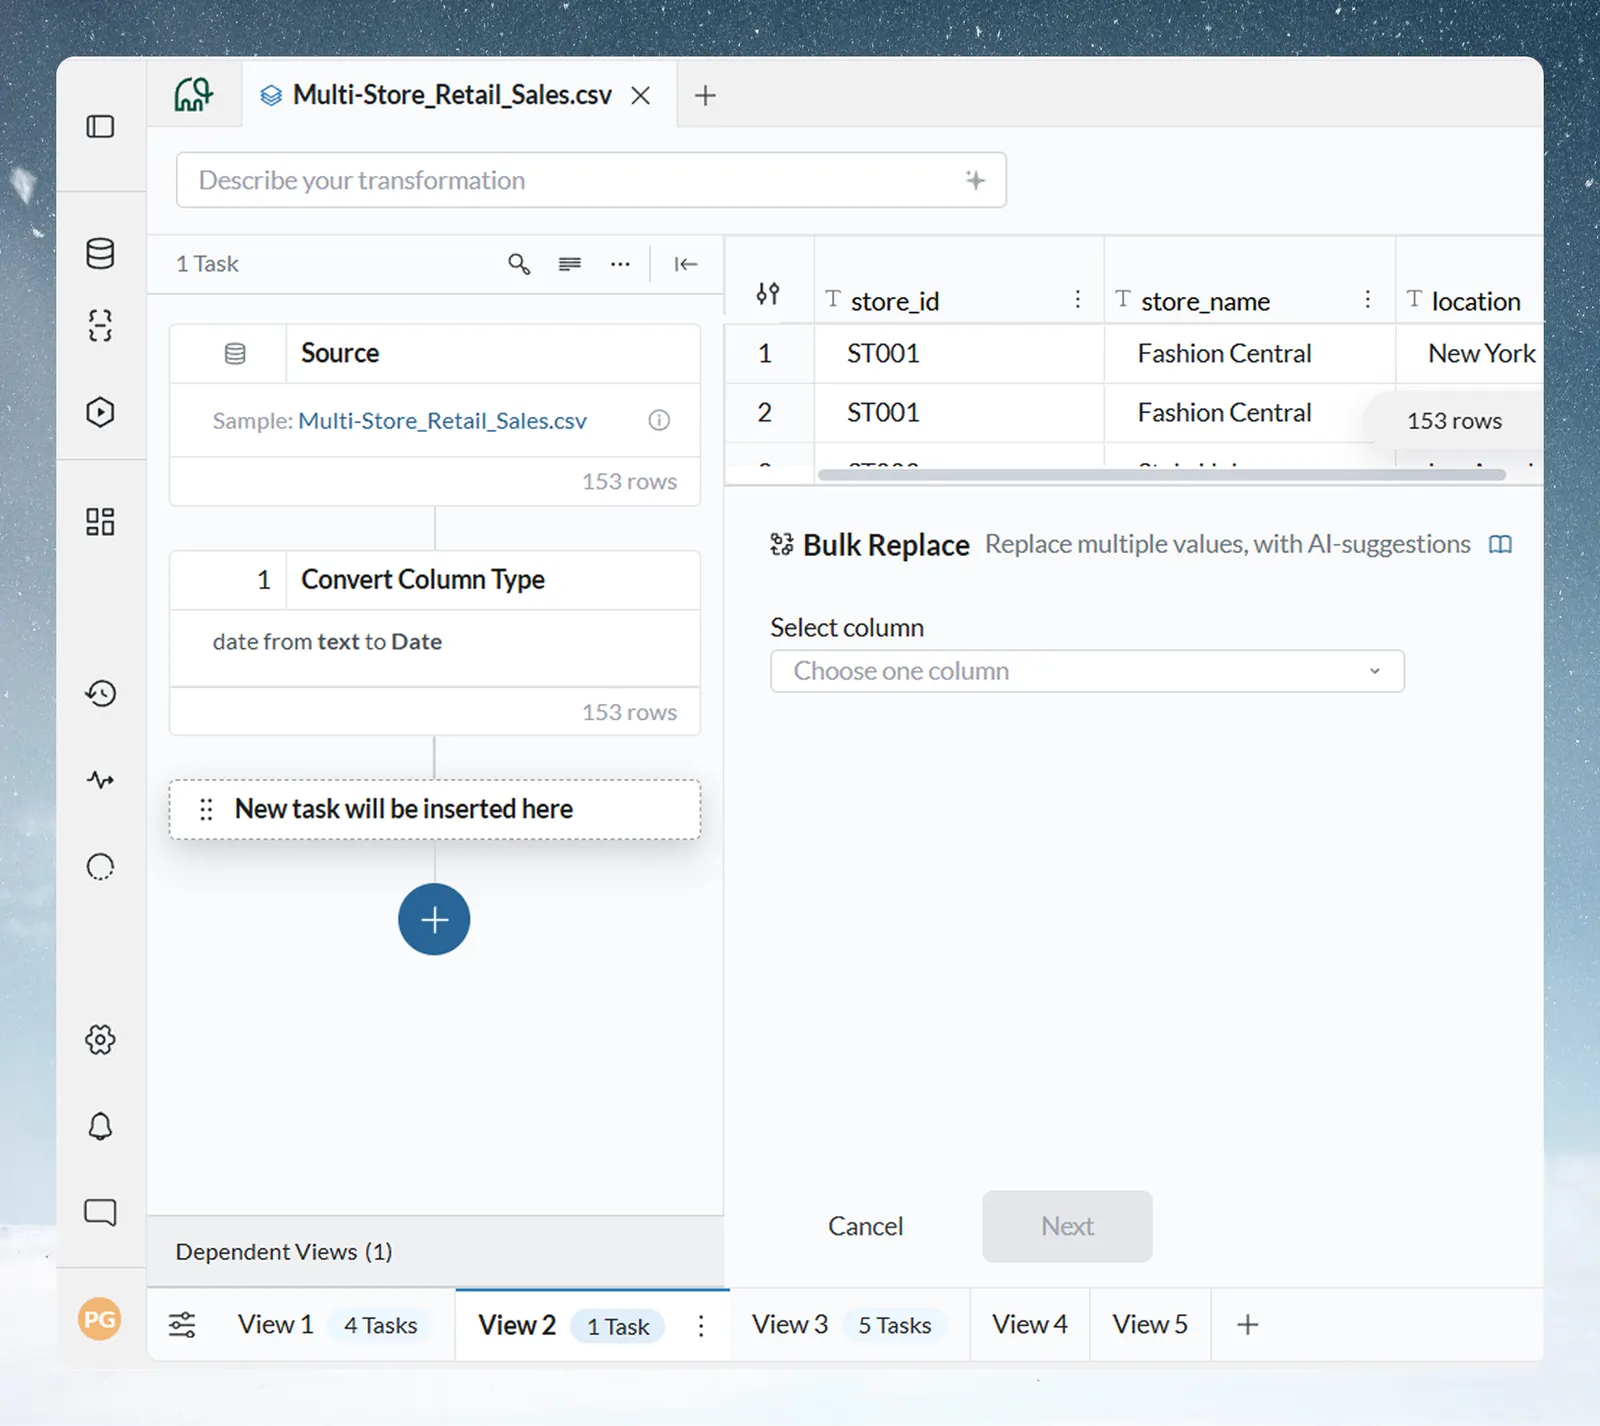
- Bulk Replace uses AI to suggest groups of similar values.
Examples:
- "Remove all rows where the customer name contains a test email address" (Conditional Filter)
- "Extract the numeric dollar value from the Notes column" (Extract Text)
- "Classify this product description as Electronics, Apparel, Home, or Food" (Generative AI)
AI-generated logic produces the same reusable, auditable tasks as manual ones. You can inspect, edit or override it before applying.
Add a task to the pipeline
Every function in the Transform menu follows the same four steps.
- Open the Transform menu (see above).
- Click a category to browse its functions, or type in the search bar. Click the function you want.
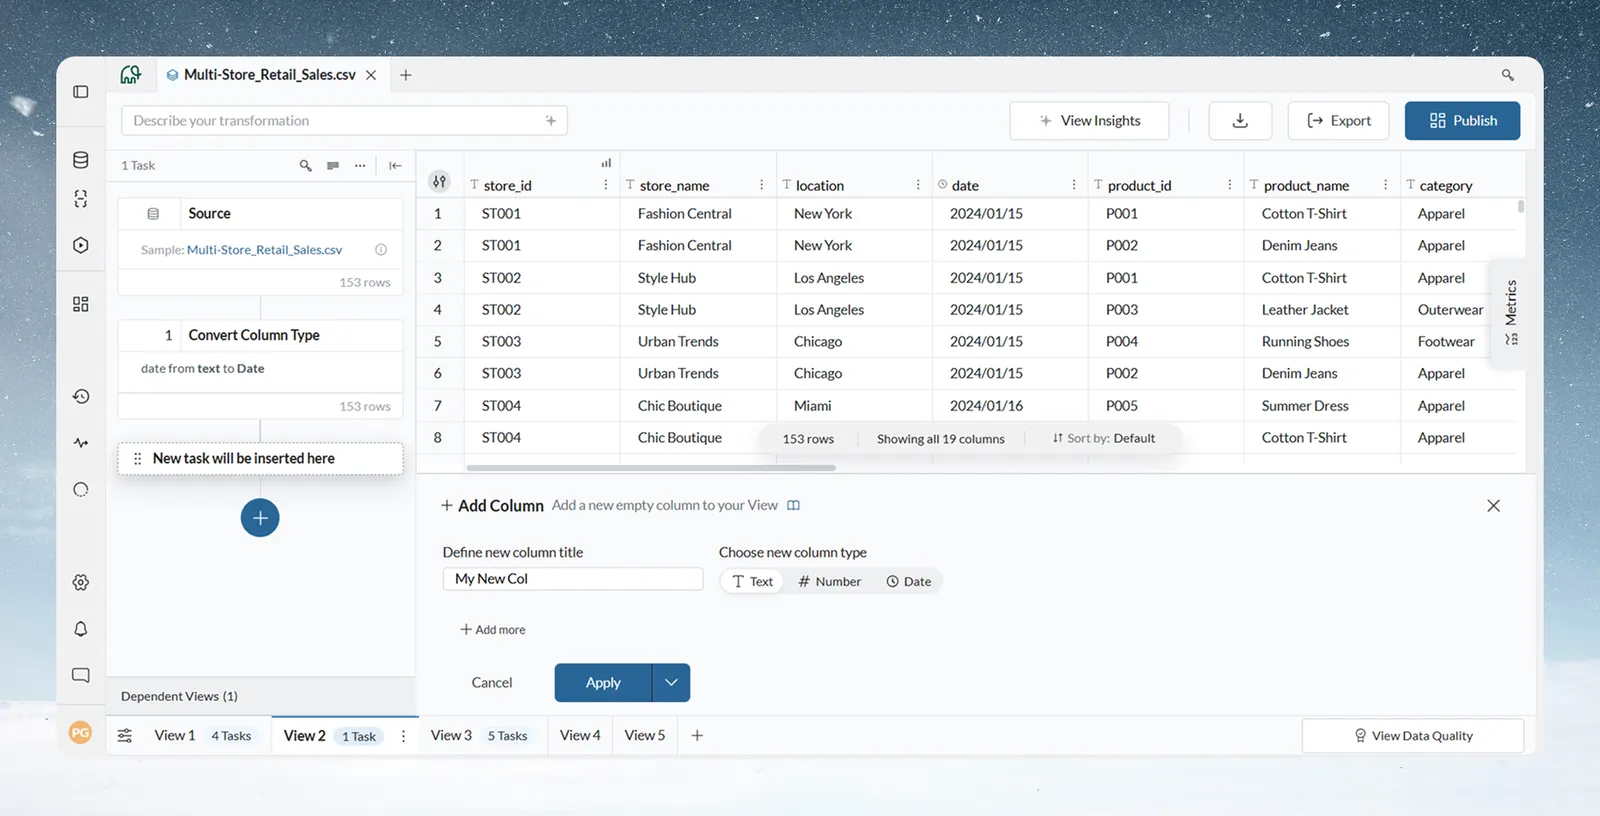
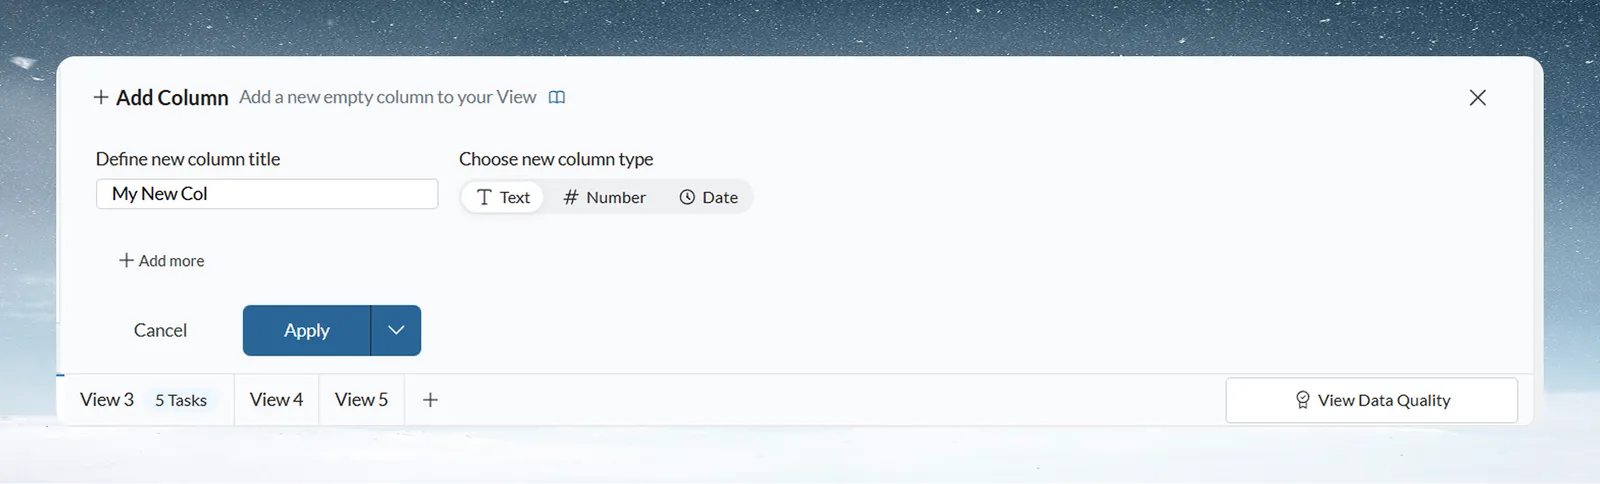
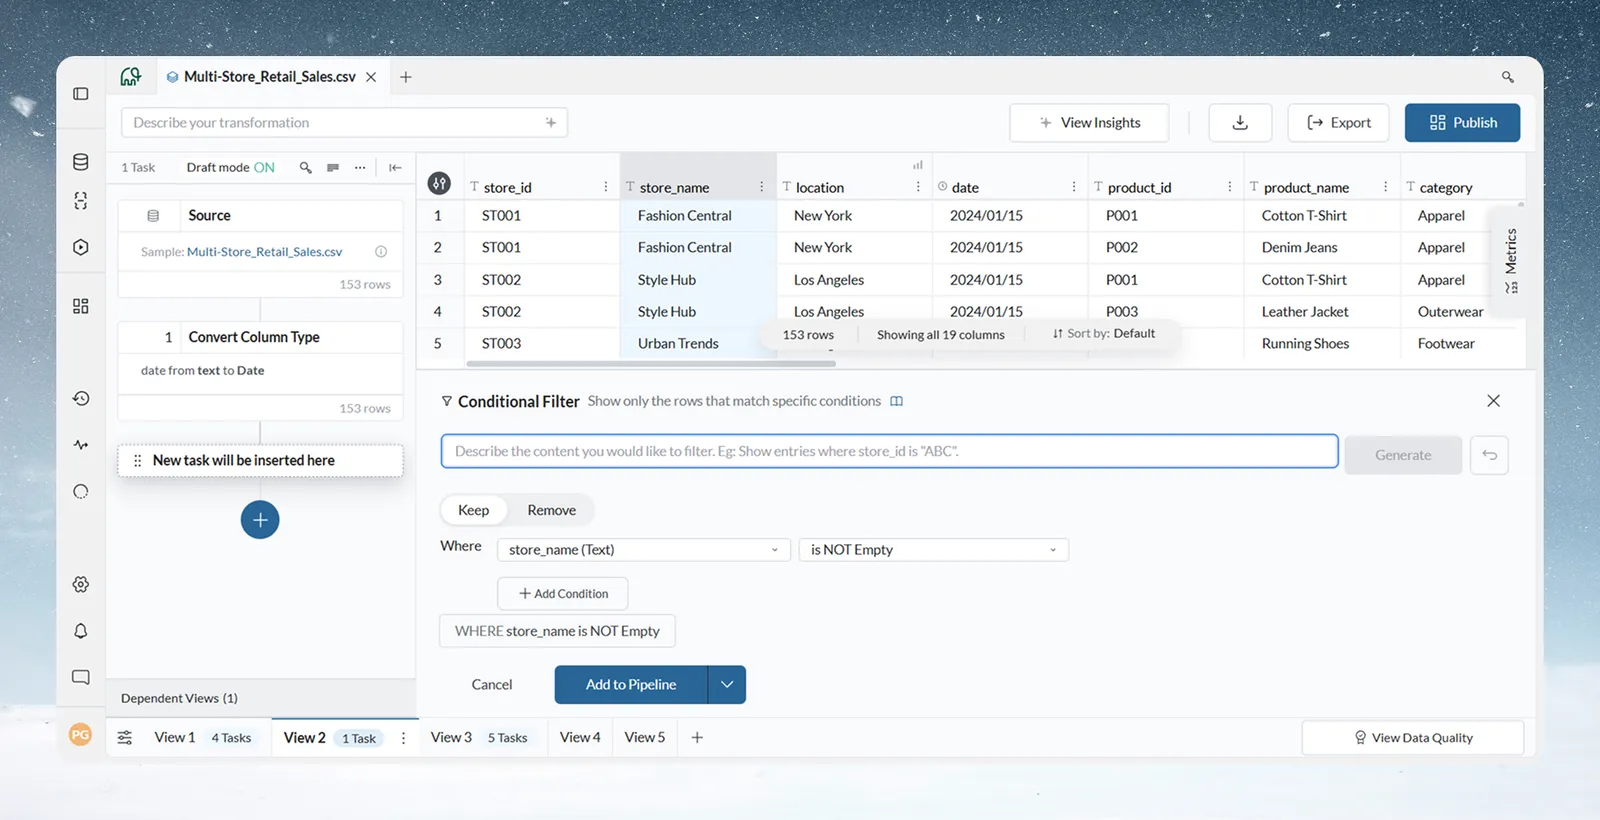
- Fill in the configuration panel that opens at the bottom of the View: column selectors, operators, values, and where to write the result.
- Click Apply. With Draft mode off, the task runs at once and the grid updates. With Draft mode on, choose Add to Pipeline: the task is queued and runs when you click Apply now.
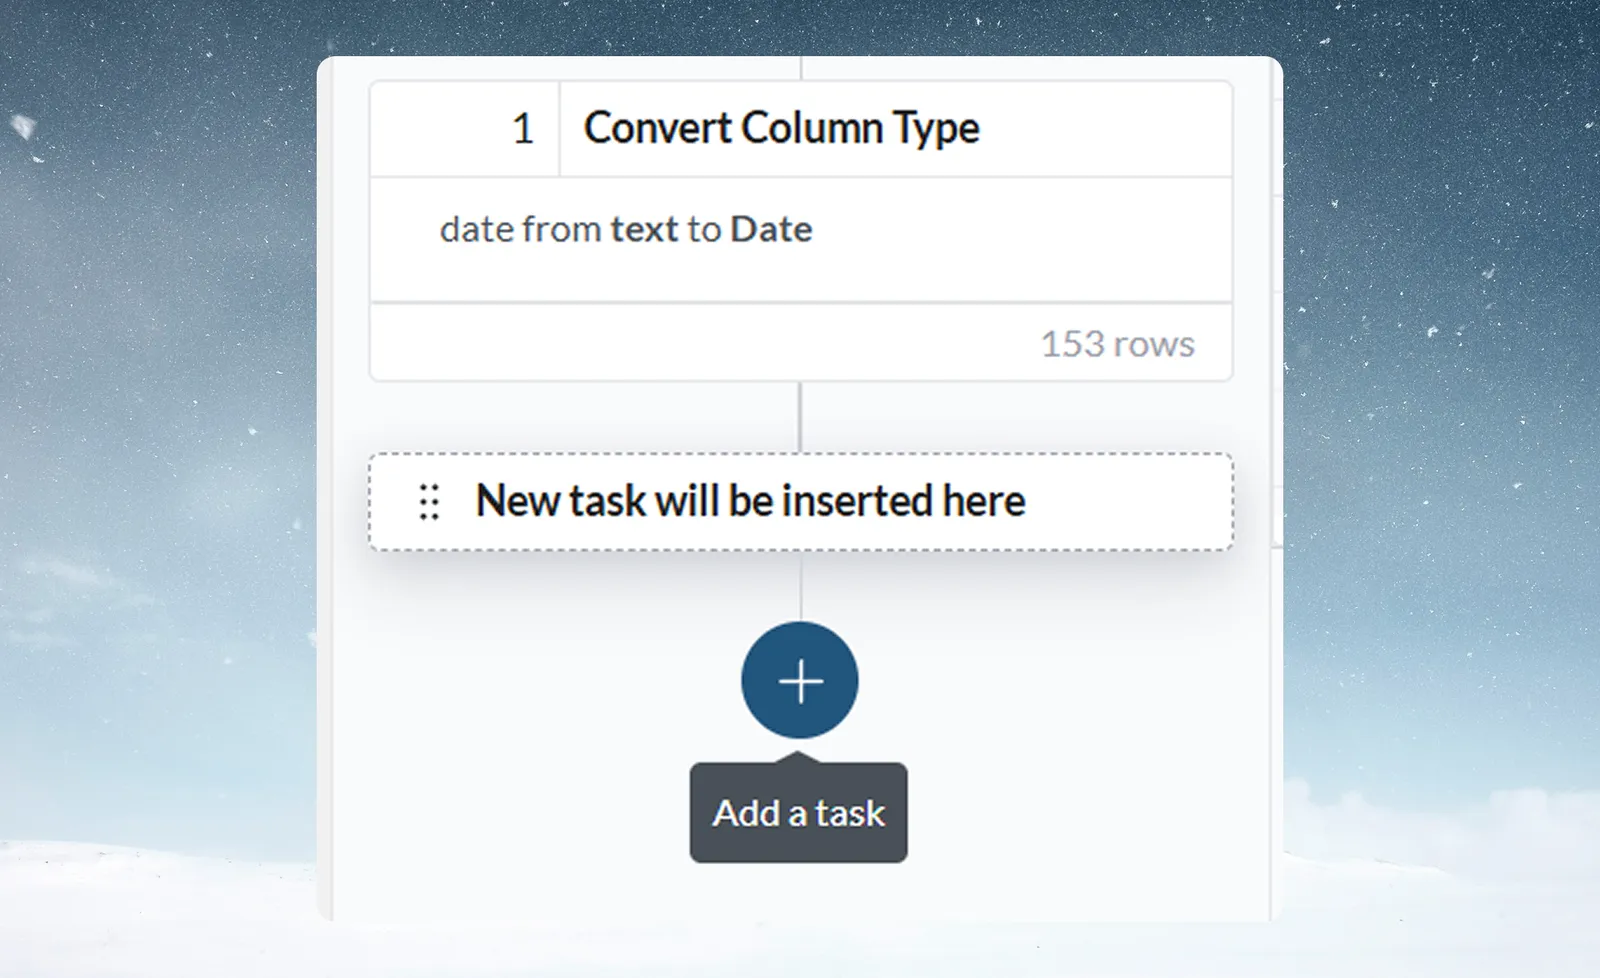
The new task card shows the function name, its key settings and the row count after it runs.
While a configuration panel is open, the pipeline shows a "New task will be inserted here" placeholder card. It marks where the new task will appear when you click Apply.
Preview a task before you apply it
Most functions show a live preview of their result in a window above the panel, before you click Apply. The preview never changes your data.
The preview opens once the settings are complete. Until then it reads "Complete the settings to see a preview." It updates as you change the settings ("Updating…").
To work out the result quickly, the preview reads a sample of the View. A line under it says how much it read. It reads "Uses the first" followed by the sample size and the View's row count, or "Uses all" followed by the row count when it read every row. With a sample, counts in the preview describe the sample, not the whole View, and the summary says so.
Turn the preview on or off
The panel header has a Preview control with an eye icon:
| Part | What it does |
|---|---|
| Preview (eye icon) | Turns the preview off or on. Each task opens with the preview on; turning it off holds for that task only. |
| Summary beside it | Says what the step changes, for example "120 rows removed", "2 columns added", "No changes" or "500 → 12 rows". It turns into a warning when every row would be removed or the settings have issues. Click it to minimize the preview window or open it again. |
You can move, resize, minimize, expand and close the window. Keyboard users can move or resize it with the arrow keys; Home puts it back to its default place and size. Double-click the title bar to expand it.
What each preview tab shows
Result is always there. The other tabs appear when they apply to the function.
| Tab | What it shows |
|---|---|
| Result | The first rows of the result, with new columns marked. |
| Changes | For a step that changes values: how many rows change, with before and after values. Shows as, for example, Changes: revenue when several columns change. |
| Values | For a step that adds a column: the values it creates and how many rows get each one. |
| Removed rows | The rows a filter or limit removes. |
| Duplicates | The duplicate rows Remove Duplicate Rows finds. The last row of each group stays. |
| Groups | For a step that works on groups of rows separately: how many groups there are, and the rows of the first ones. |
| Matches | For Join and Lookup: rows that match, rows with no match, and keys with no match. It also says when a row matches more than one row of the other View (Join adds a row for each match) or when a key of the other View has more than one value (Lookup takes the first). |
| Size | For Repeat Rows: shown only when the result is large, too large to apply, or empty. |
| Views | For Join and Lookup: this View and the other View side by side. |
Functions that preview on request or not at all
- Fill Missing Values with AI fill takes time, so its preview waits for you: "This function takes time to run. Click Run preview to see its result." Click Run preview.
- Send to Dataset, Bulk Replace, the Export step, Data Check and Checkpoint Alert have no live preview.
- Generative AI has its own Preview button instead.
Apply several tasks at once with Draft mode
Draft mode controls when tasks run. Turn it on from More Pipeline options (...) at the top of the Pipeline panel.
| Mode | Behaviour | Best for |
|---|---|---|
| Immediate (Draft mode off, the default) | The task applies and the grid updates at once. The label reads "Tasks will be applied instantly". | Single tasks, small datasets, quick exploration |
| Draft mode | Tasks are queued and applied as a batch when you click Apply now | Testing logic with many tasks, large datasets |
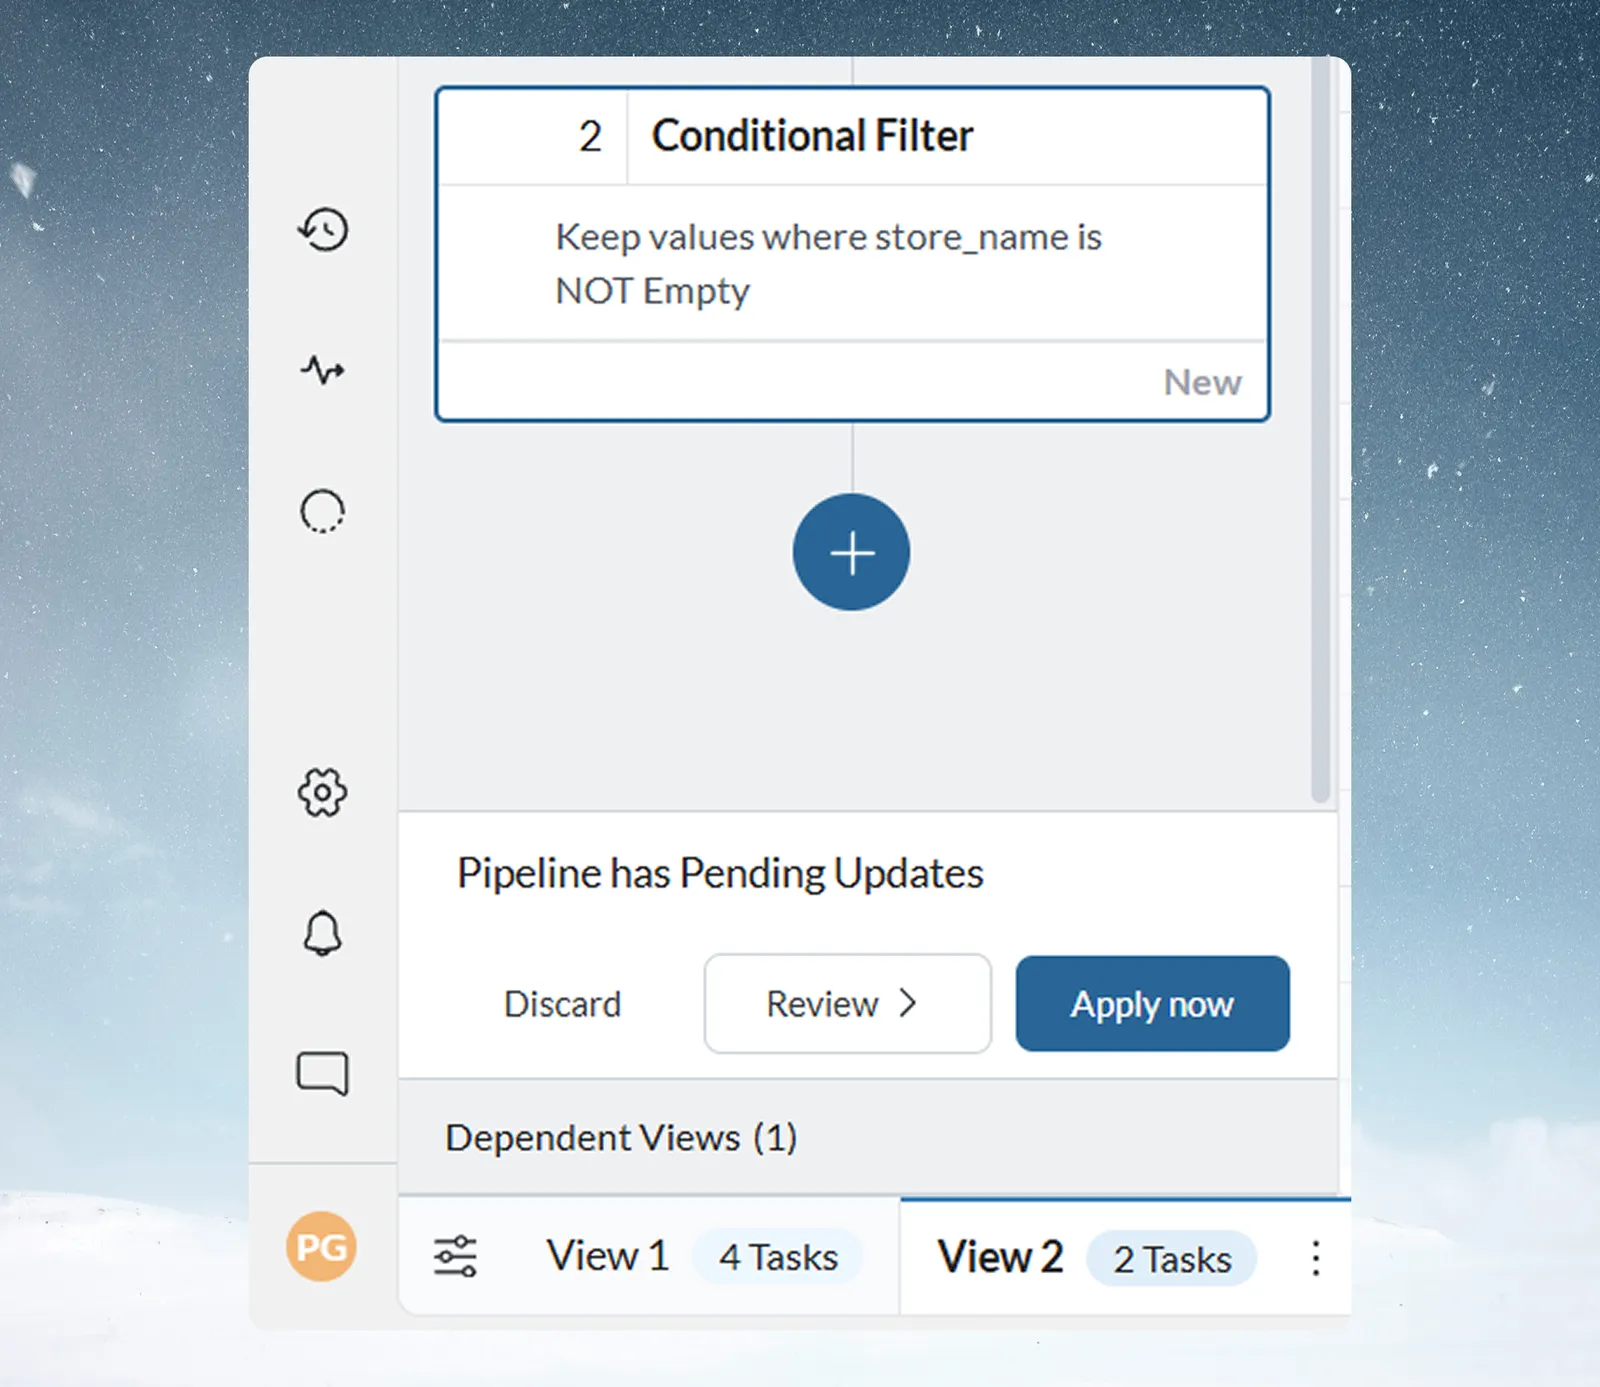
With Draft mode on, the pipeline header shows Draft mode ON. Tasks you add or change are queued and don't run. The function panel's split button defaults to Add to Pipeline. The grid keeps showing the state from the last time the pipeline actually ran.
Review, apply or discard pending changes
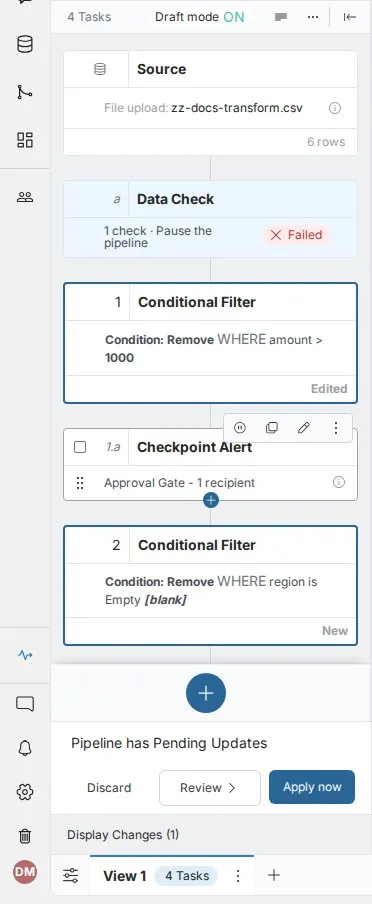
When changes are queued, a bar at the bottom of the panel reads "Pipeline has Pending Updates" with three options:
| Option | What it does |
|---|---|
| Discard | Removes all pending changes and reverts the pipeline to its last run state. A dialog lists the changes first, with each task's details and status. |
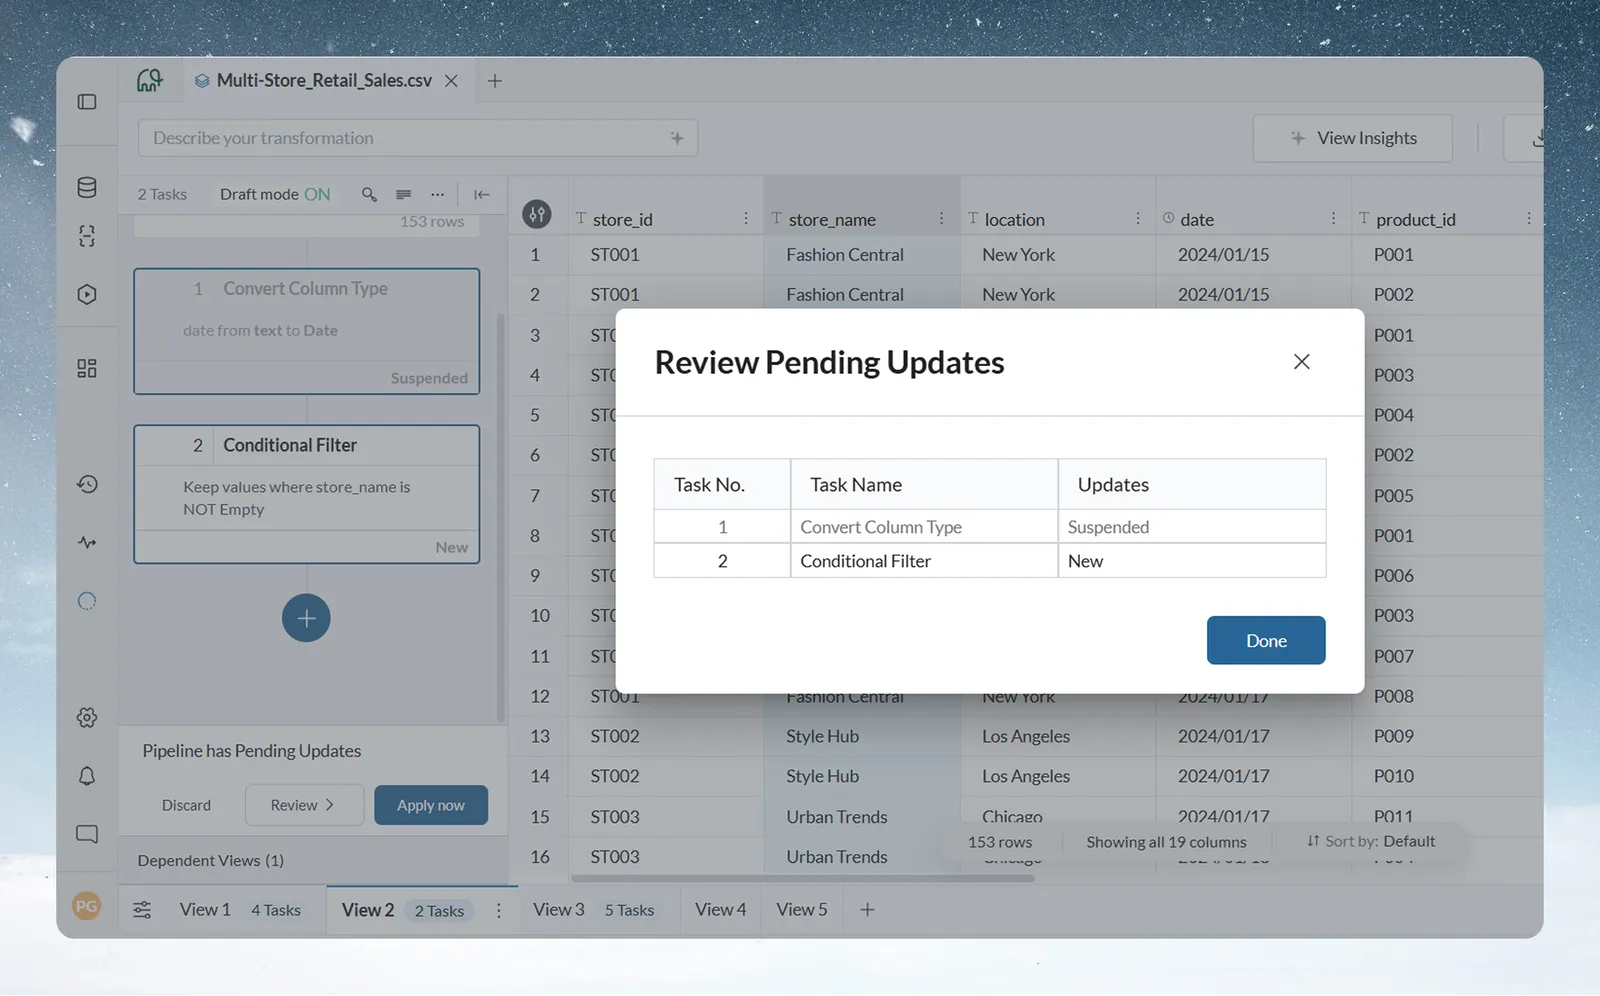
| Review | Opens a list of every pending change by task number, task name and type of update: New, Edited, Removed, Reordered or Suspended. |
| Apply now | Runs all pending tasks together in one run. |
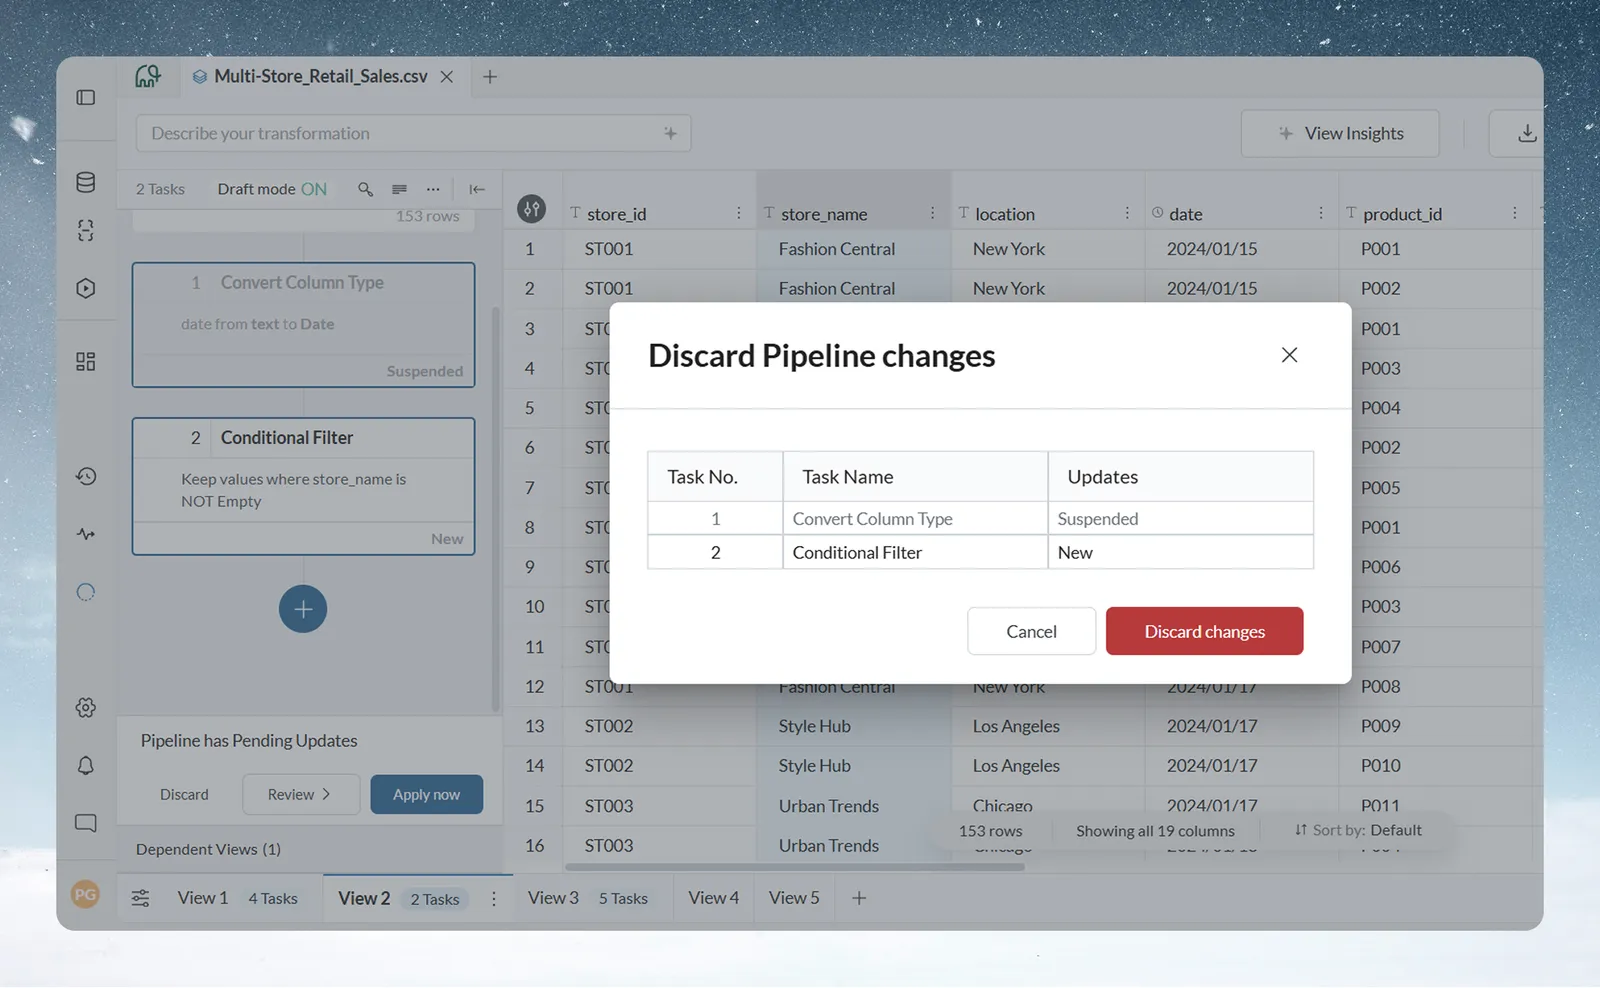
The Draft mode toggle is disabled while the pipeline is in an error state. Apply now stays disabled until the failing tasks are fixed.
If another user already has unpublished changes on the pipeline, an "Adding to another user's draft" warning explains that your task joins their draft. It doesn't go live until the draft is published. Choose Add anyway to continue.
Use a parameter as a value in a task
Some value boxes accept a project parameter instead of a typed value. When the parameter's value changes, the step uses the new value on its next run. You manage parameters in Parameters and snippets.
| Function | Value you can bind | Parameter type |
|---|---|---|
| Find & Replace | The text to find and the replacement | Text |
| Label & Insert Values | The value to insert | Same type as the target column |
| Show Top/Bottom Rows | The number of rows | Number |
| Obtain Large or Small Values | The custom value | Number |
Conditions (Add Condition and Conditional Filter), Data Check thresholds and the SQL mode of Math Function (Insert Parameter) can use parameters too.
To bind a value:
- Click the small chip at the left of the value box. It reads Val for a typed value.
- Choose Parameter ("Bind to a project parameter"). The chip changes to #.
- Click Select a parameter and pick one. Only parameters of a matching type are listed.
- The box now shows the parameter's name. Click its X to remove the binding.
You can't apply the step while the box is set to Parameter with nothing picked ("Select a parameter to continue"). To go back to a typed value, click the chip and choose Value ("A fixed value").
When someone changes a parameter's value, every pipeline that uses it is flagged as stale. Mammoth doesn't rerun them on its own: rerun from the parameter library or the stale banner. The rerun starts from the first task that uses the parameter.
Put tasks in the best order for speed
Apply filter tasks early to cut the row count before costly steps like joins and pivots. For best performance, order a pipeline like this:
- Validate early: Data Check tasks near the top.
- Filter early: Conditional Filter to reduce row volume.
- Clean columns: Remove or Convert Column Type.
- Standardize: Bulk Replace, Text Formatting.
- Enrich: Join, Lookup, Add Column.
- Calculate: Math Function, Window Function.
- Format: Label & Insert Values, Combine Columns.
- Govern: Checkpoint before export.
For large datasets, use Draft mode to batch-test changes before applying. Use an automation to keep source datasets current rather than re-uploading by hand. See Speed up pipelines and connectors and What you can automate.
Troubleshooting the task preview
| Message | What to do |
|---|---|
| "The preview did not finish in time. Try again, or use narrower settings." | Click Try again, or narrow the settings (fewer columns, a tighter condition). |
| "The preview could not load." | Click Try again. You can still apply the task. |
| "A preview is not available for this function." | Apply the task and check the result in the grid. |
| "No rows in the result." | The step removes every row. Check the settings before applying. |
For a task that fails after you apply it, see Fix a failing step.
Related
- Edit, reorder and copy pipeline tasks: suspend, copy, search and restore earlier versions.
- Quick start: from a file to a shared dashboard: build a first pipeline end to end.
- Rename, format and sort columns: change how data looks without adding tasks.
- Column types, IDs, currency and percentages: the warnings some tasks show about column meaning.
- Pause sends while you edit: hold dashboards and exports while you change the pipeline.
- Join two datasets on a shared column: combine data from two or more datasets.
Something wrong? support@mammoth.io