What is Mammoth Analytics? Features and who it's for
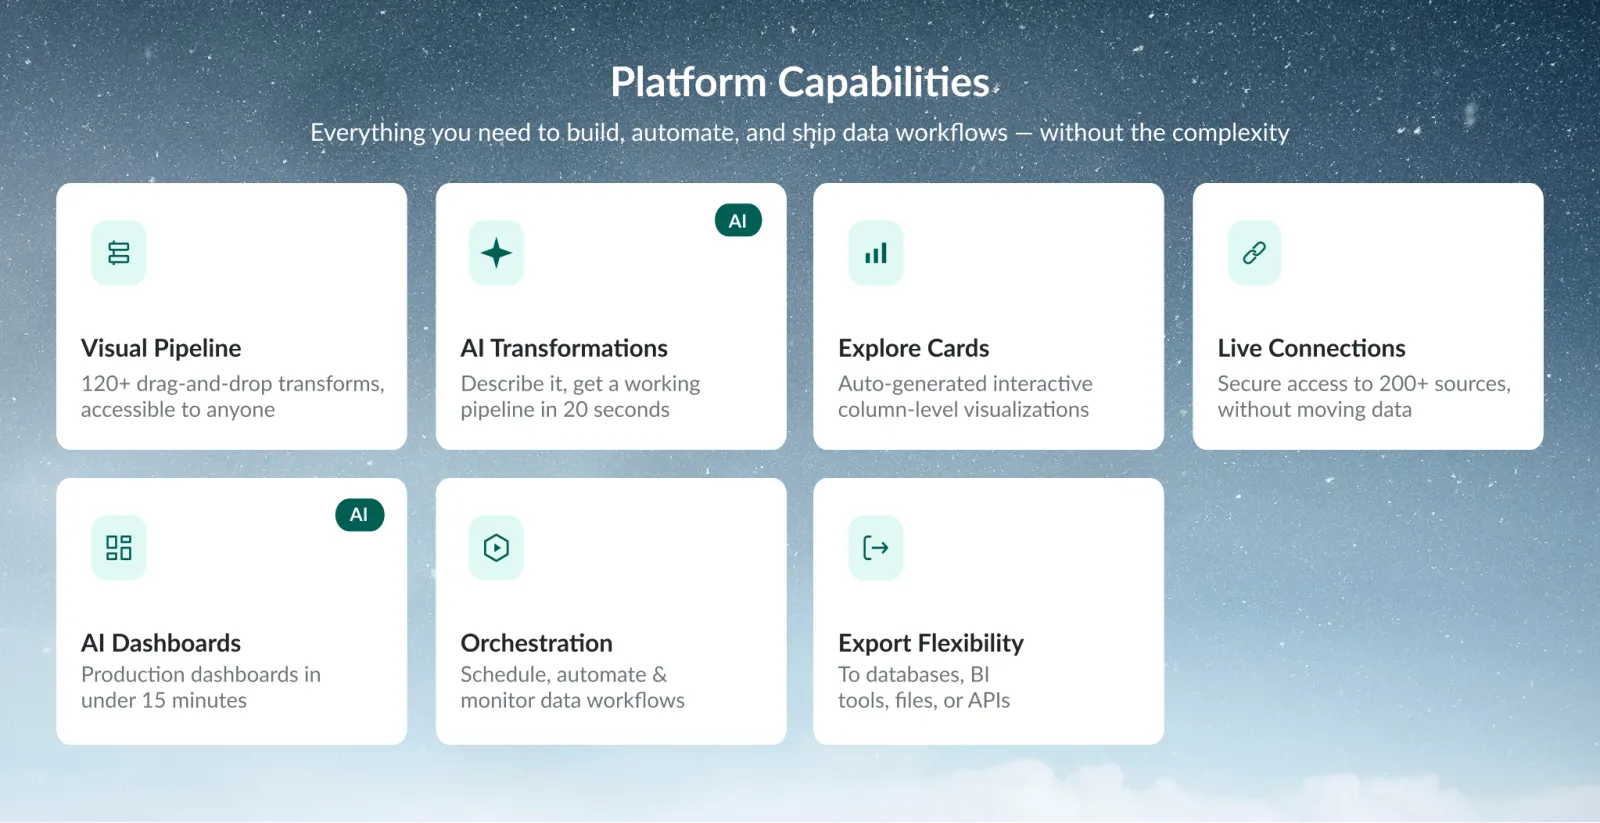
Mammoth Analytics is a no-code data platform for business teams. You bring data in from files and connectors, clean and combine it in a visual pipeline, keep it current with automations, and share it as exports, dashboards, docs and slides. It runs in the cloud, so there is nothing to install, and analysts, operations managers and domain experts can do the work themselves without writing code.
The data preparation problem Mammoth solves
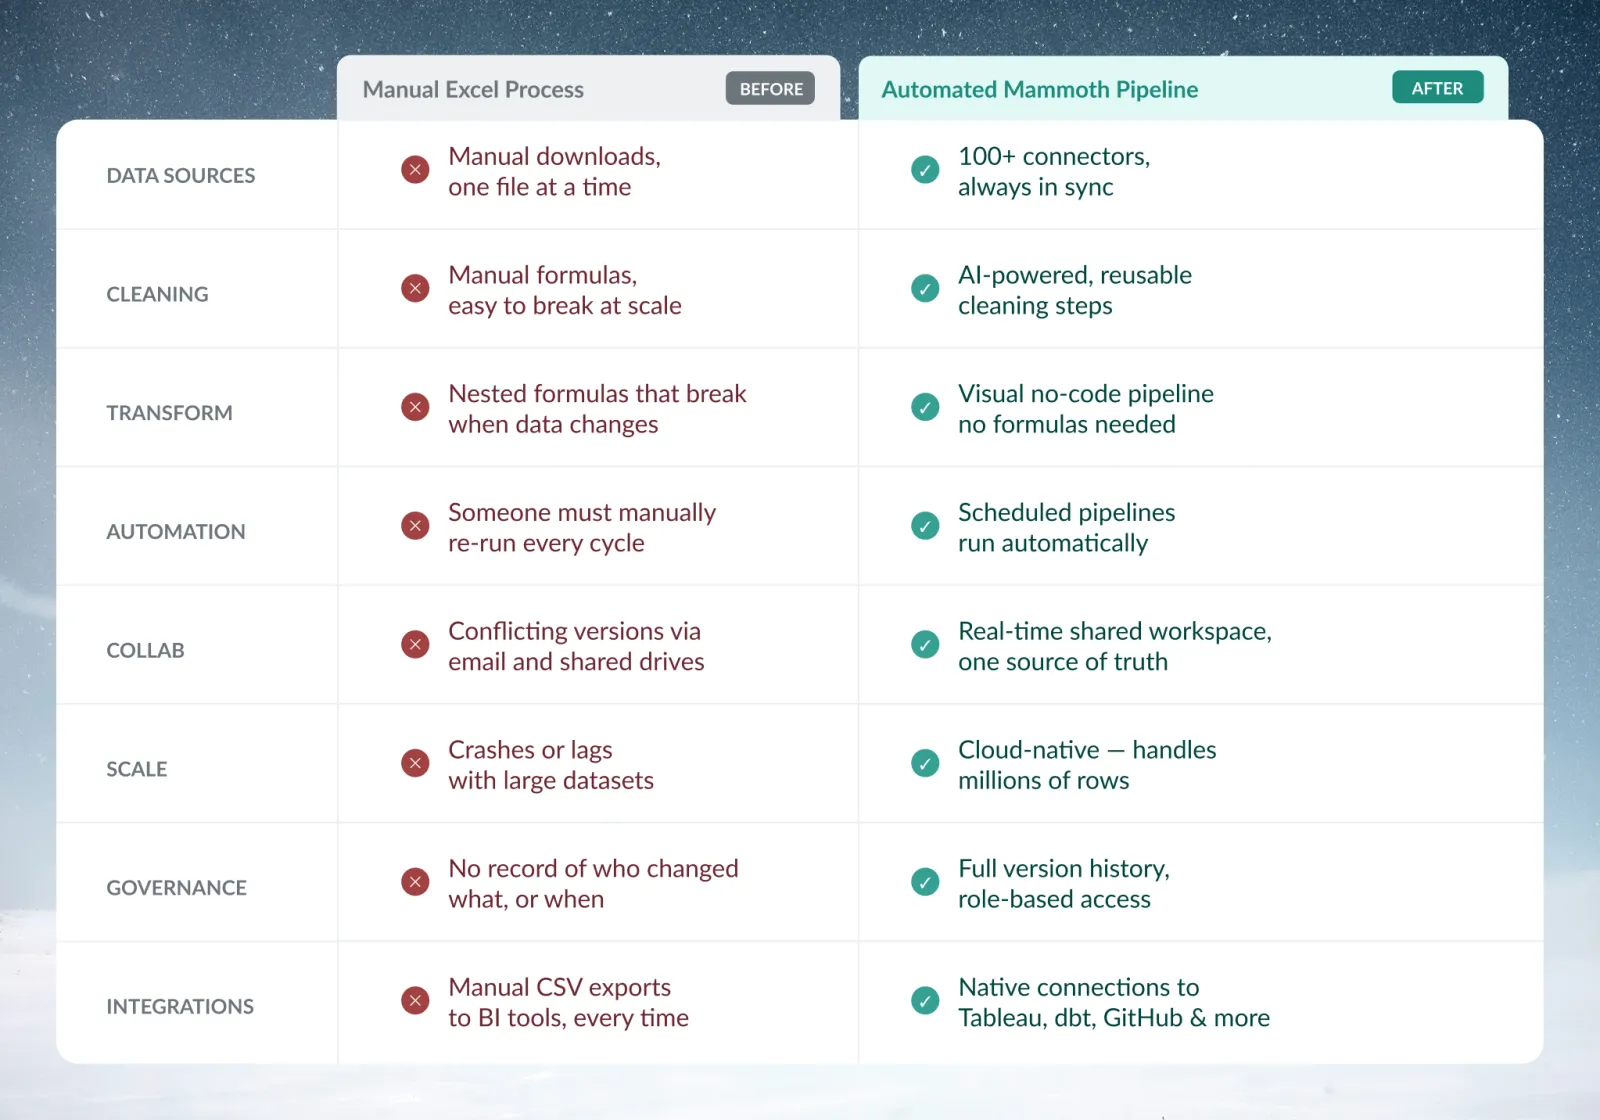
Business teams often spend more time preparing data than analysing it:
- Spreadsheets have row limits and don't repeat last month's steps for you.
- Traditional data preparation tools need technical training.
- BI tools need clean data to start from.
- IT teams become a bottleneck for simple data requests.
The result is manual work, back-and-forth with IT, and reports rebuilt by hand every period. Mammoth turns those steps into a pipeline that runs again on new data.
How Mammoth works: connect, transform, export
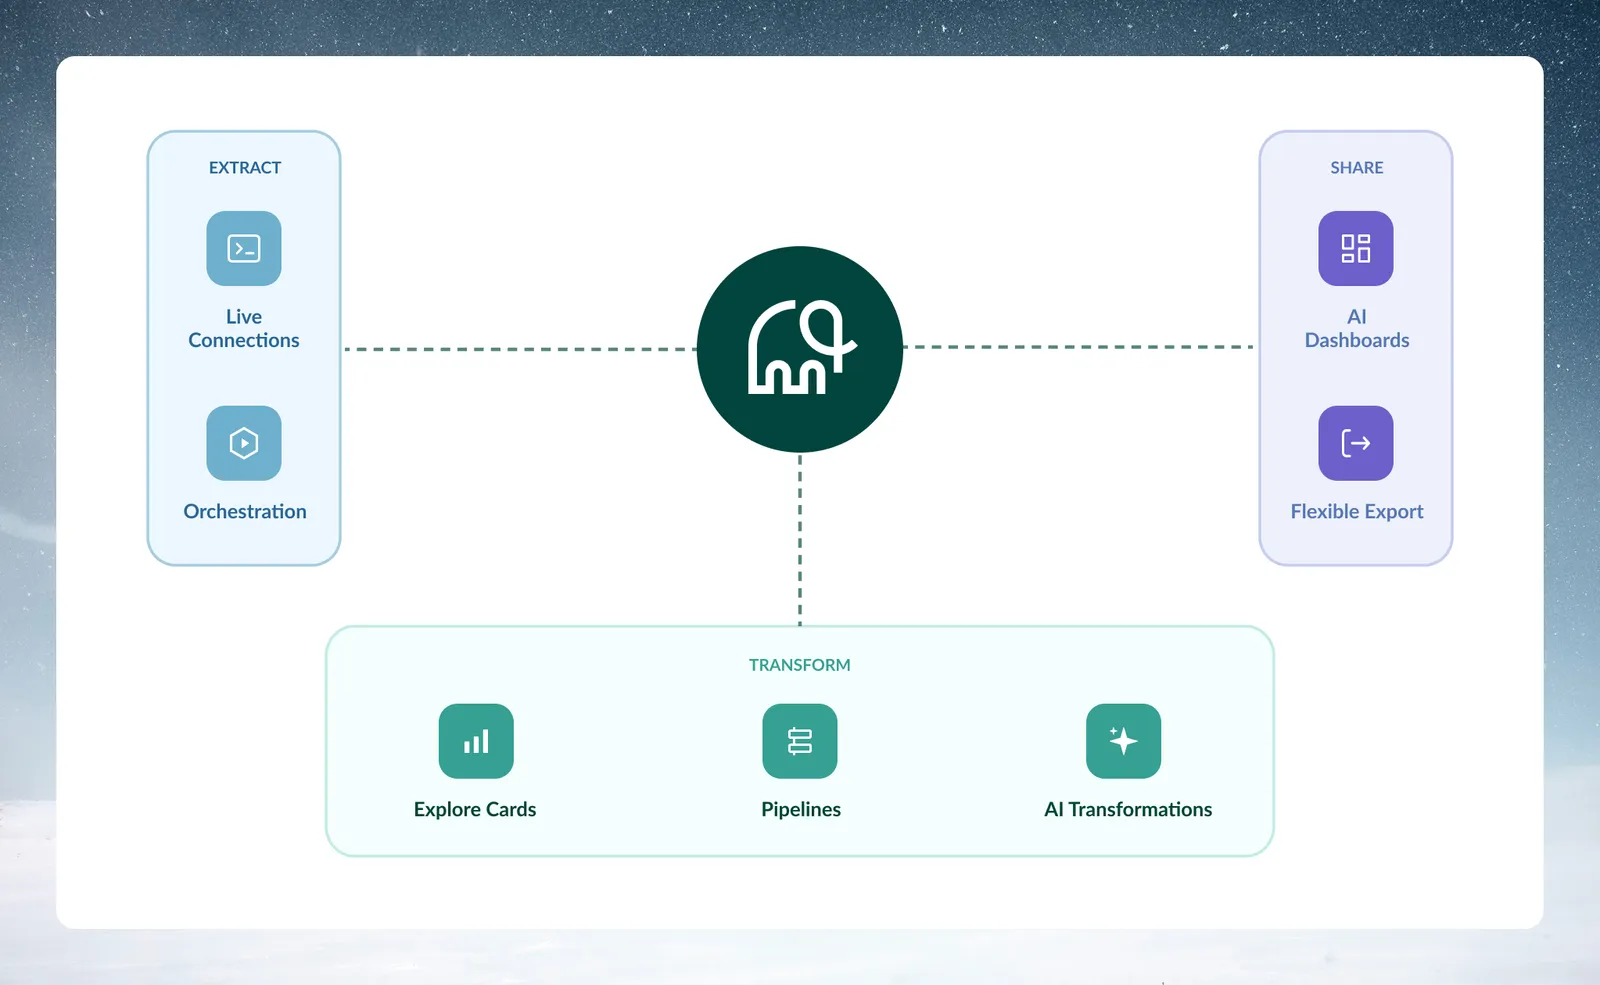
Most work in Mammoth follows three steps:
| Step | What you do |
|---|---|
| Connect | Upload a file, paste data, or connect a database, app or cloud drive. Each source becomes a dataset in the Data Library. |
| Transform | Open the dataset and build a pipeline of tasks that clean, reshape and combine it. The pipeline runs again when the data changes. |
| Export | Download a copy, export to a database or app after every run, or build a dashboard, doc or slide deck on the data. |

The full journey has six stages, each with its own tools:
| Stage | What you use | Learn more |
|---|---|---|
| Connect | File upload, paste, From URL, webhooks, and connectors for databases, apps and cloud storage | Choose how to bring data in |
| Explore | Explore Cards above the data grid show what is in a column and filter the grid when you click a value | Explore cards |
| Assess | View Data Quality scores the view and recommends tasks. View Insights turns column statistics into plain-language observations | Data quality report, View insights |
| Transform | Pipeline tasks in seven categories, including AI tasks such as Generative AI and Ask in plain words | How the pipeline works |
| Automate | Dataset Refresh, File Collection, Data Consolidation, Scheduled Export and Messaging automations | What you can automate |
| Share | Downloads, exports to databases and apps, live links, and dashboards, docs and slides built by AI | Download data, Dashboards |
To try the steps in order, follow the Quick start.
Find your data in the Data Library
Click Data in the left sidebar to open the Data Library of the current project. Its tabs are Datasets, Connections, Automations and Parameters. The Datasets tab lists the project's folders, datasets and views, with status chips and actions for several items at once.
Click New dataset to add data. You can upload a file or a folder, paste from the clipboard, connect a source, import from a URL, load a sample file, generate data with AI, or receive rows through a webhook. See Find your way around the Data Library.
Clean data in a visual, no-code pipeline
Open a dataset to work on it in a view, the data editor for a dataset. Every task you add, such as a filter, a join or a pivot, goes into the view's pipeline in the Pipeline panel on the left. Tasks run top to bottom, and you can drag them into a new order, so the pipeline is a readable record of your logic.
Click the + button (tooltip "Add a task") to open the Transform menu. Its seven categories are AI Powered, Filter, Label & Replace, Date, Numeric & Text, Reshape, Group & Pivot, Column Management, Unify and Controls.
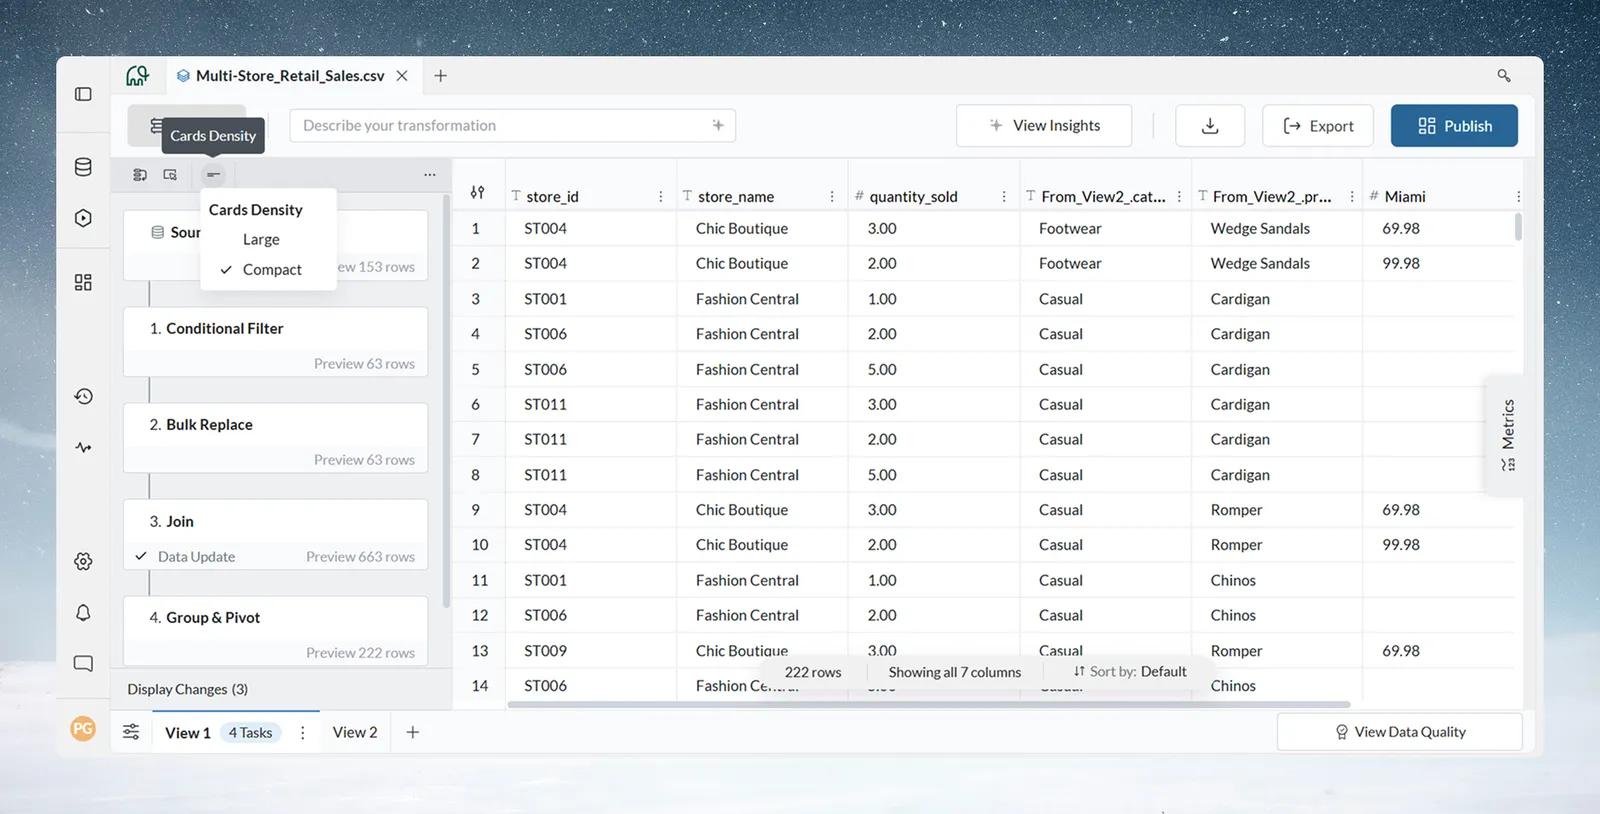
You can preview the data at any task, and edit or reorder tasks later. Turn on Draft mode to queue several changes and run them together with Apply now. The pipeline runs again when the dataset gets new data, so a report you build once keeps working. See How the pipeline works.
Describe a transformation and let AI build it
Several tasks take a plain-language description and build the transformation for you:
| Task | What it does |
|---|---|
| Generative AI | Writes new column values from a prompt: classify, enrich, translate or summarise rows. |
| Ask in plain words | Turns a plain-language request into a SQL query and runs it on the view. |
| Conditional Filter and Extract Text | Build their rule from a sentence you type. |
| Bulk Replace | Suggests groups of similar values, such as "iPhone 15 Pro", "iphone 15 pro" and "iPhone15Pro", to replace with one name. |
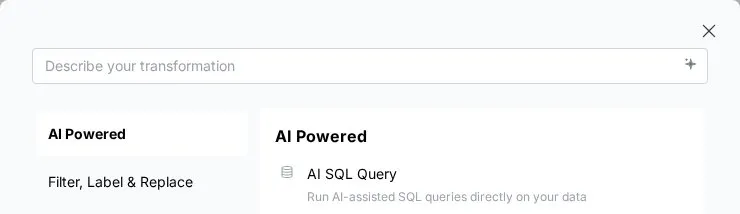
The Describe your transformation box in the action bar opens the Transform menu and searches its functions. It always offers Ask in plain words too, with your text carried into its prompt. AI tasks produce the same pipeline tasks as any other, so you can inspect and edit them. For example, you can classify free-text comments, or pull an amount out of a notes column, without a formula. See Use AI on your columns and Write SQL with AI.
See what is in each column with Explore Cards
The Explore panel sits above the data grid. Use Add card to pick a column. The card shows its distinct values (text), its distribution (numbers) or its timeline (dates). Mammoth remembers your cards for the view.
Click values to select them, then choose Filter or Exclude. Double-click a value to filter to it right away. Explore filters are temporary, and you can turn them into a pipeline task or a new view. Use cards to spot missing values, odd spellings and outliers right after an upload, before you build any tasks. See Explore cards.
For a check of the whole view, click View Data Quality in the footer for a scored report with recommended tasks, or View Insights in the action bar for plain-language observations. See Data quality report and View insights.
Connect databases, apps and cloud storage
Connect directly to databases, business apps, cloud storage and APIs, so you don't download and re-upload files.
Click New dataset and choose Connectors, or open Data > Connections and click New Connection. A database opens its connection form. Other sources open the connector workspace, where a chat asks for credentials or a sign-in. A saved connection belongs to the project. See Connect a database or app and Manage saved connections.
Datasets from databases, apps and APIs can be refreshed with a Dataset Refresh automation. Files from drives and file servers (Dropbox, Google Drive, SharePoint, SFTP and others) are saved once; bring in new files with a File Collection automation. You can join data from several sources in one pipeline.
Build dashboards, docs and slides with AI
Click Dashboards in the left sidebar, then Create. Pick your data, choose a format, and describe what you need. The AI reads your columns and builds a styled, interactive item that you refine with the AI chat or by hand. Each item is a Dashboard, Doc, Slides deck, Q&A page or Explore page. See Create a dashboard and Docs and slides.
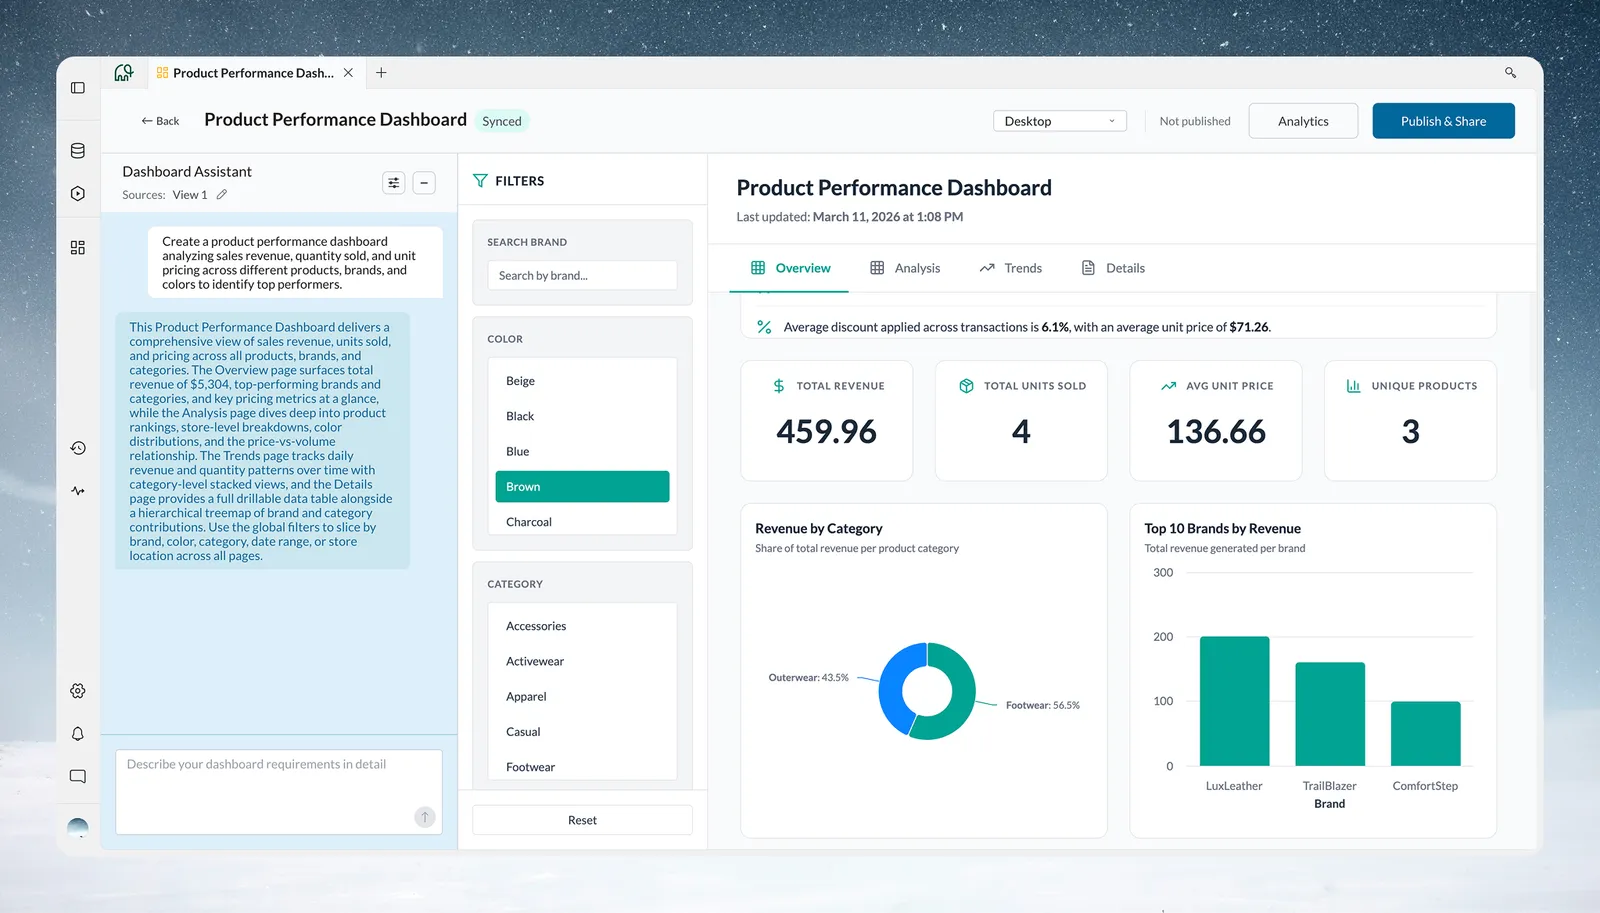
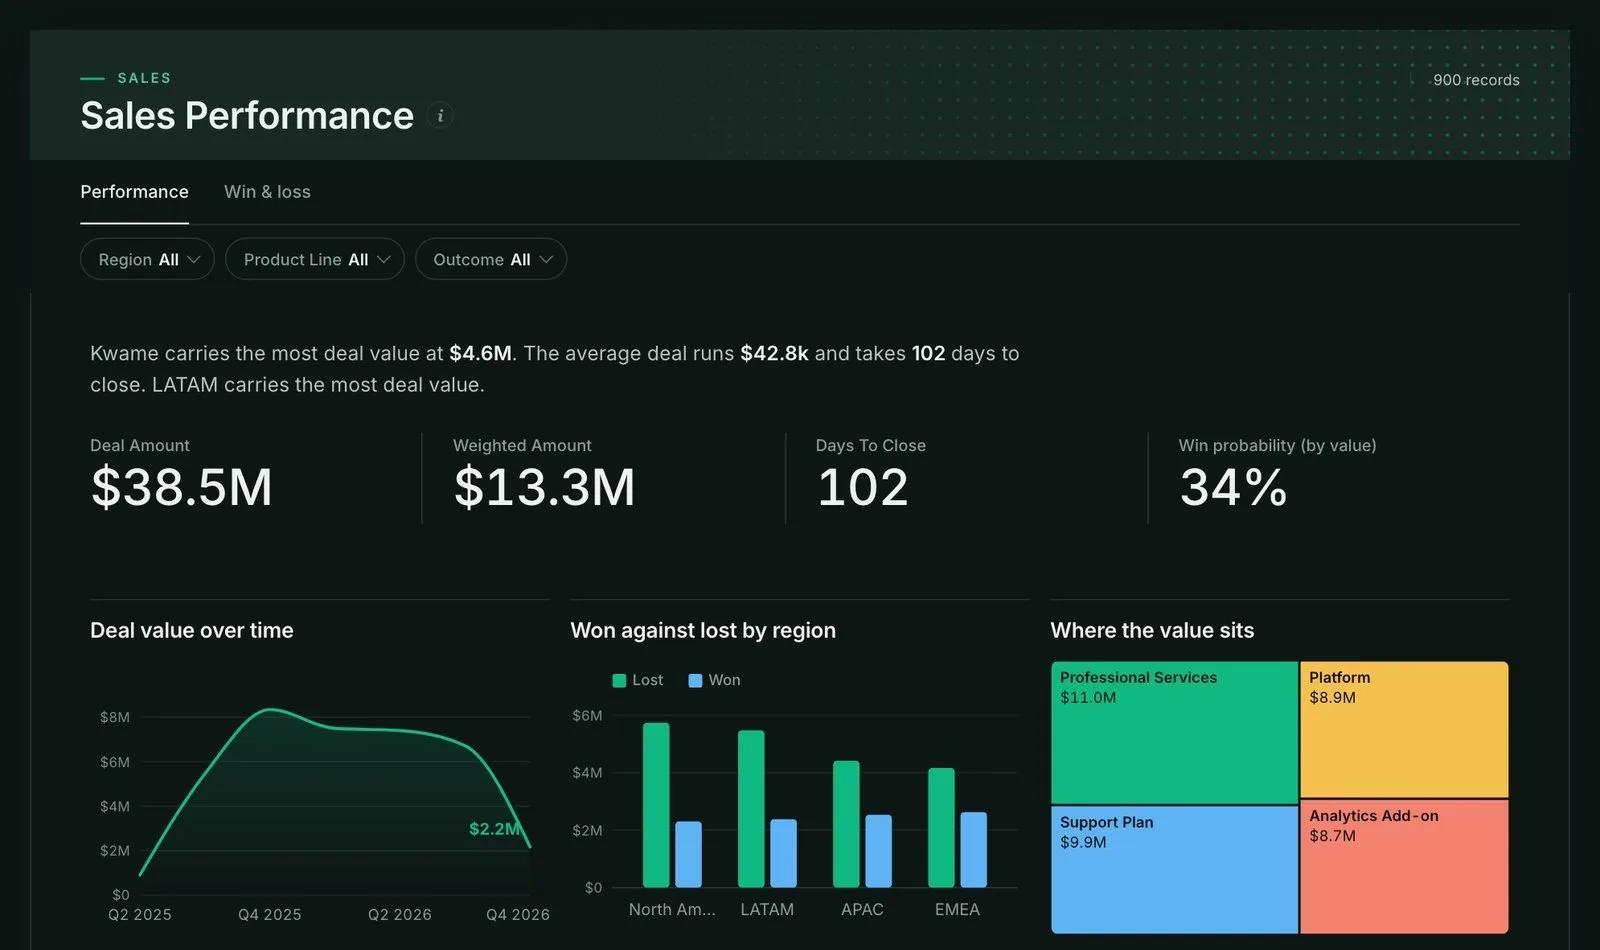
Share a dashboard with Sign-in required (people with a Mammoth account), Anyone with the link and password, or Anyone with the link. You can also send email updates and see who read it. Typical uses are executive reporting, stakeholder updates and client dashboards. See Publish and share a dashboard.
Your plan sets how many dashboards you can publish and how many AI generations you get each month. See Limits and quotas.
Automate refreshes, exports and emailed reports
Automations run recurring data work without manual steps. Open them from the Automations tab in the Data Library. There are five types:
| Type | What it does |
|---|---|
| Dataset Refresh | Fetches the latest data for datasets from a database, app or API connector, or from a URL. Several datasets can refresh In parallel or In a sequence. |
| File Collection | Collects files from cloud folders into a Mammoth folder. Available on plans that include it. |
| Data Consolidation | Combines or replaces a dataset's data when a new file arrives in a folder. |
| Scheduled Export | Runs a view's export steps on a schedule, whether or not the data changed. |
| Messaging | Emails people a view on a schedule, as a CSV attachment. |
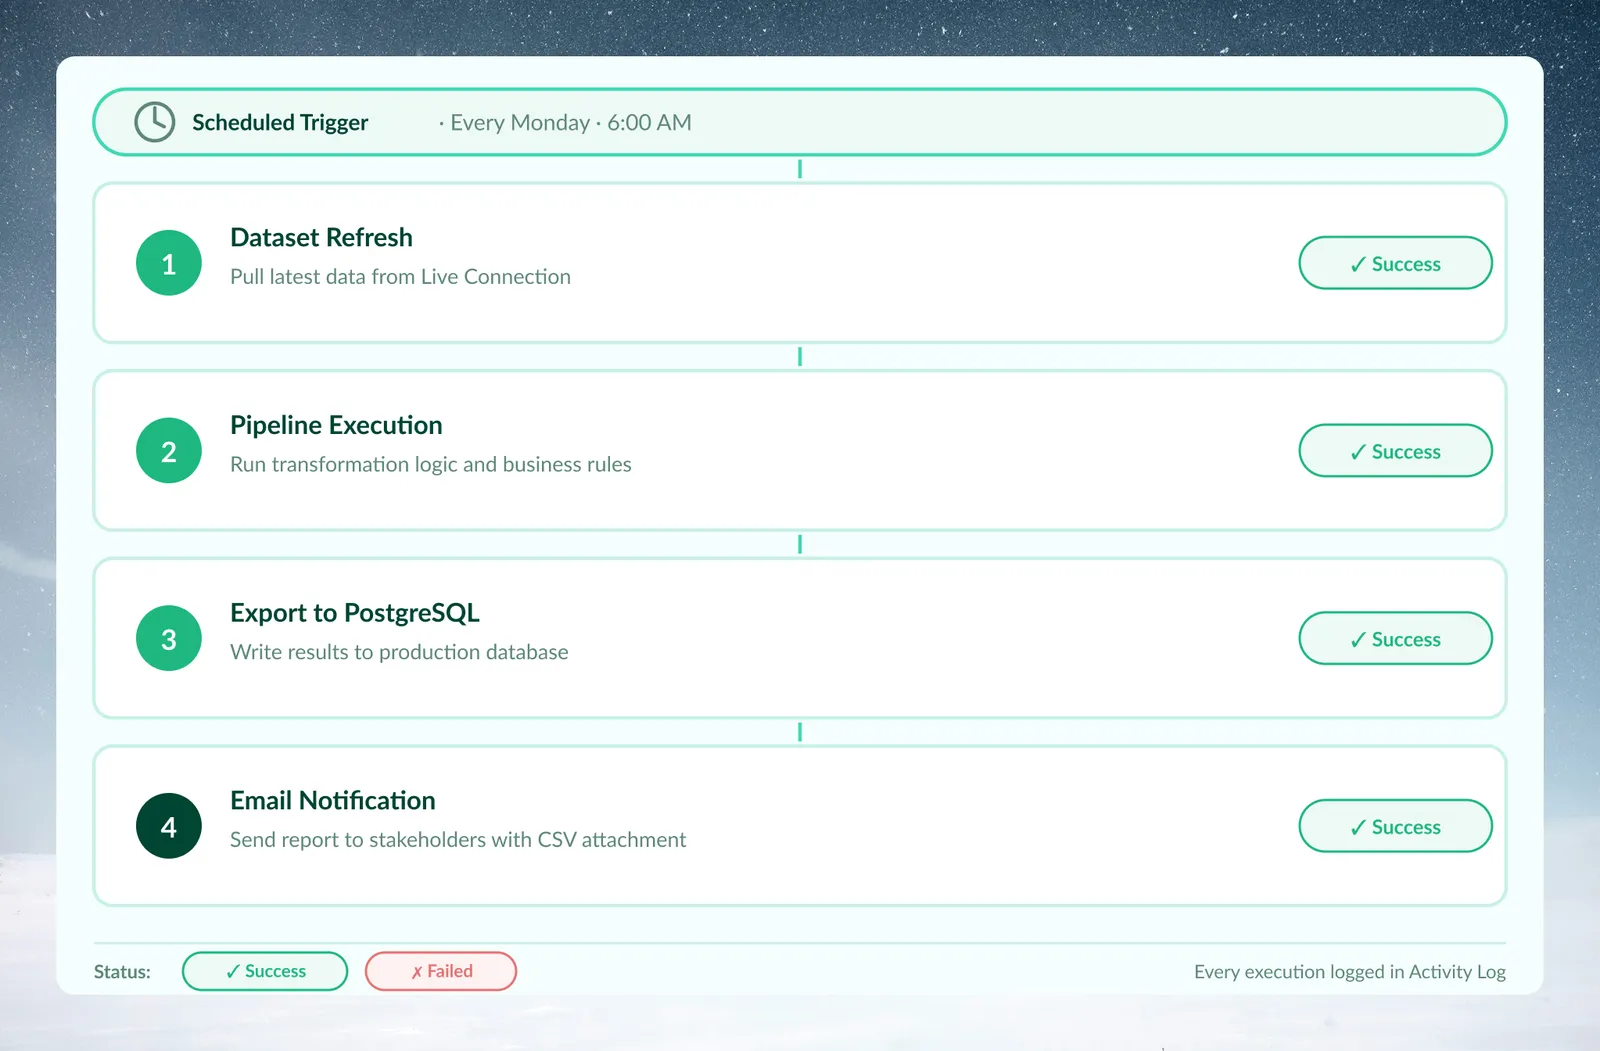
Your plan sets the shortest schedule interval. See running and past runs, and anything that needs attention, in Monitor. See What you can automate and Activity log.
Export and share your data
The view toolbar has three ways to get data out:
| Control | What it does |
|---|---|
| Download icon (Save a copy) | Saves a one-time copy: Download file (CSV, Excel, JSON and more), New dataset, or Email to people in the workspace. |
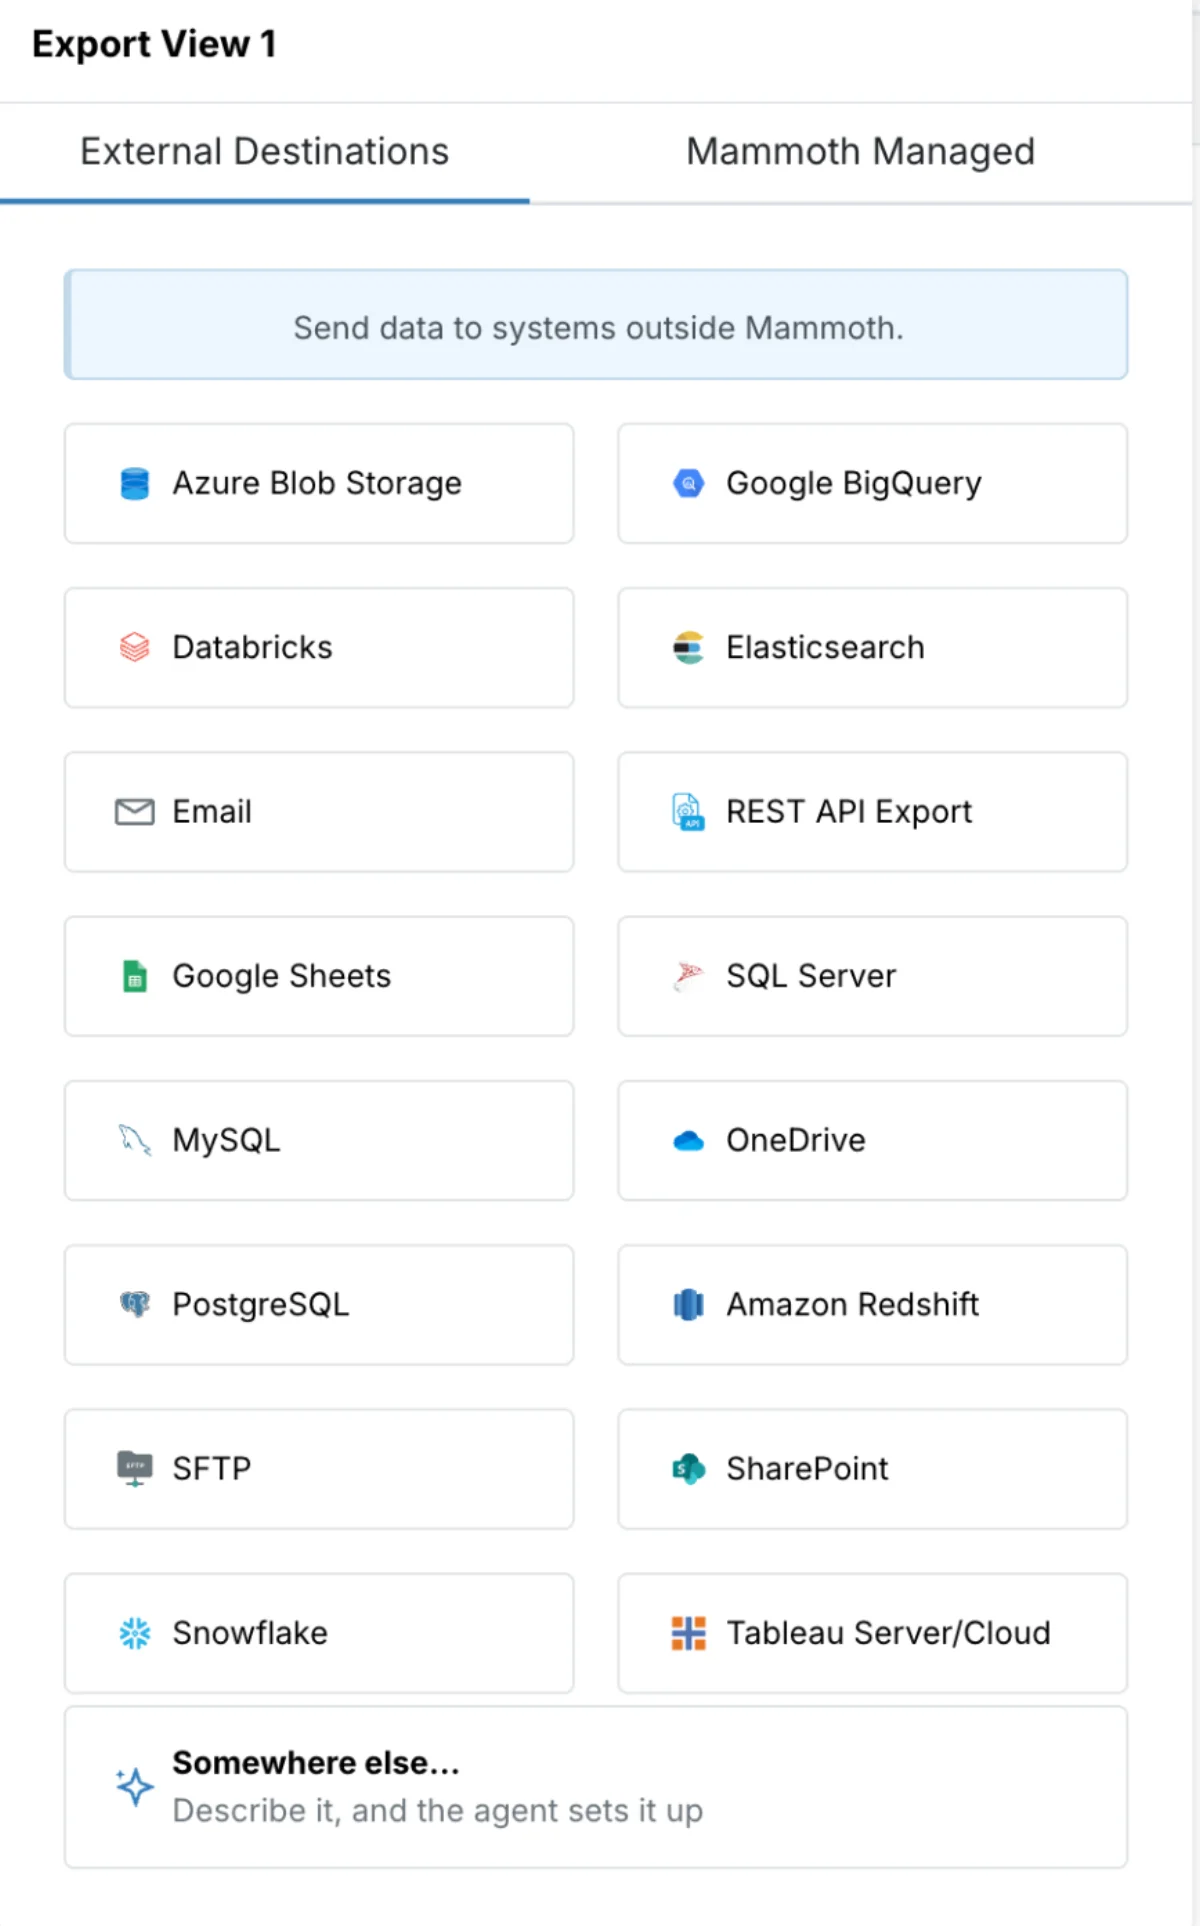
| Export | Adds an export task that delivers data every time the pipeline runs. The menu has two tabs, External Destinations and Mammoth Managed. |
| Publish | Opens the create page to build a dashboard, doc, slides or Q&A from the view. |
External Destinations include Google BigQuery, PostgreSQL, MySQL, SQL Server, Amazon Redshift, Snowflake, Databricks, Elasticsearch, SFTP, SharePoint, Azure Blob Storage, OneDrive, Google Sheets, Email, Tableau Server/Cloud and REST API Export. Somewhere else… asks the AI Agent to build an export to another API, on Enterprise plans.
Mammoth Managed destinations are Send to Dataset (push the results into another dataset, even in another project), Live link (a URL that always serves the current data as CSV) and a Mammoth-managed Google BigQuery or PostgreSQL database.
Send to Dataset, Snowflake, Databricks, Google Sheets and Email are on every plan. Other destinations depend on your plan, and a card your plan doesn't include shows a Trial pill. See Send data to a database or BI tool.
Control access with projects and roles
A project holds a team's datasets, connections, automations and dashboards. Each person in a project has a project role:
| Role | What they can do |
|---|---|
| Project Admin | Everything an editor can, plus edit project settings, manage members, manage connections and delete the project |
| Project Editor | Create and change datasets, views, pipelines and automations |
| Project Viewer | View Data Library items, read-only |
Workspace roles are Workspace Owner and Workspace Member. On the Pro plan you can also build custom workspace and project roles. See Core ideas and Members, roles and custom roles.
Use the AI Agent, MCP server, CLI and API
| Tool | What it does | Plans |
|---|---|---|
| AI Agent | A chat inside the Mammoth web app (Agent in the left navigation). Say what you want: it answers questions about your data, makes charts, cleans and combines data, and builds dashboards, never doing more than your own access allows. It includes Ask mode and the Today page. | The AI Agent is available on Enterprise plans. |
| Mammoth MCP server | Hosted at https://mcp.mammoth.io/mcp. Lets an AI client such as Claude or ChatGPT explore, clean, transform and export your data, signed in as you. | Every plan |
| CLI | The mammoth command for terminals, scripts and CI. Coding agents such as Claude Code use it through a bundled skill. See Mammoth for coding agents. | Every plan |
| REST API | The API behind both, for anything else you build. | See Build with Mammoth |
Who Mammoth is for
| Who | How they use Mammoth |
|---|---|
| Business analysts | Excel users who rebuild the same weekly or monthly report by hand. Mammoth turns those steps into a pipeline that runs again on new data, for example when you combine reports from several sources. |
| Technical enablers | IT and analytics teams who field many small data requests. They connect the sources once, give business users a project to work in, and use the REST API, the CLI or the MCP server where code helps. |
| Operations managers | Leaders who need to see what their teams' data work is doing. Projects and roles control who can see and change data, Monitor shows what needs attention, and the Activity Log records who changed what. |
If you come from Excel, start with file uploads and Explore Cards. If you come from Alteryx or a similar tool, go straight to connectors and the advanced pipeline tasks. Pick your path has a plan for each role.
What Mammoth is not
- Not a data warehouse. Mammoth stores the data you are working on, within your plan's storage. For long-term analytical storage, export your results to a warehouse such as Snowflake or Amazon Redshift.
- Not for data science modelling. Mammoth is for data preparation and business reporting, not for building machine learning models in Python or R.
- Not for real-time streaming. Mammoth processes data in runs, on a schedule or when data arrives, not as a sub-second event stream.
- Not a code-first ETL tool. If your team prefers to write and maintain Python or SQL scripts, a code-based ETL tool may fit better.
Mammoth sits between your data sources and your reports: business users prepare data themselves, then send it where it is needed.
Security, certifications and sign-in
- Mammoth is SOC 2 Type II and ISO 27001 certified.
- Projects and roles decide who can see and change each project's data.
- SSO (SAML or OIDC), enforced MFA and an IP allowlist are set up by Mammoth on request.
See Security: sign-in, data security, compliance and audit logs.
Example: a manufacturing team end to end
This illustrative example describes a manufacturing team.
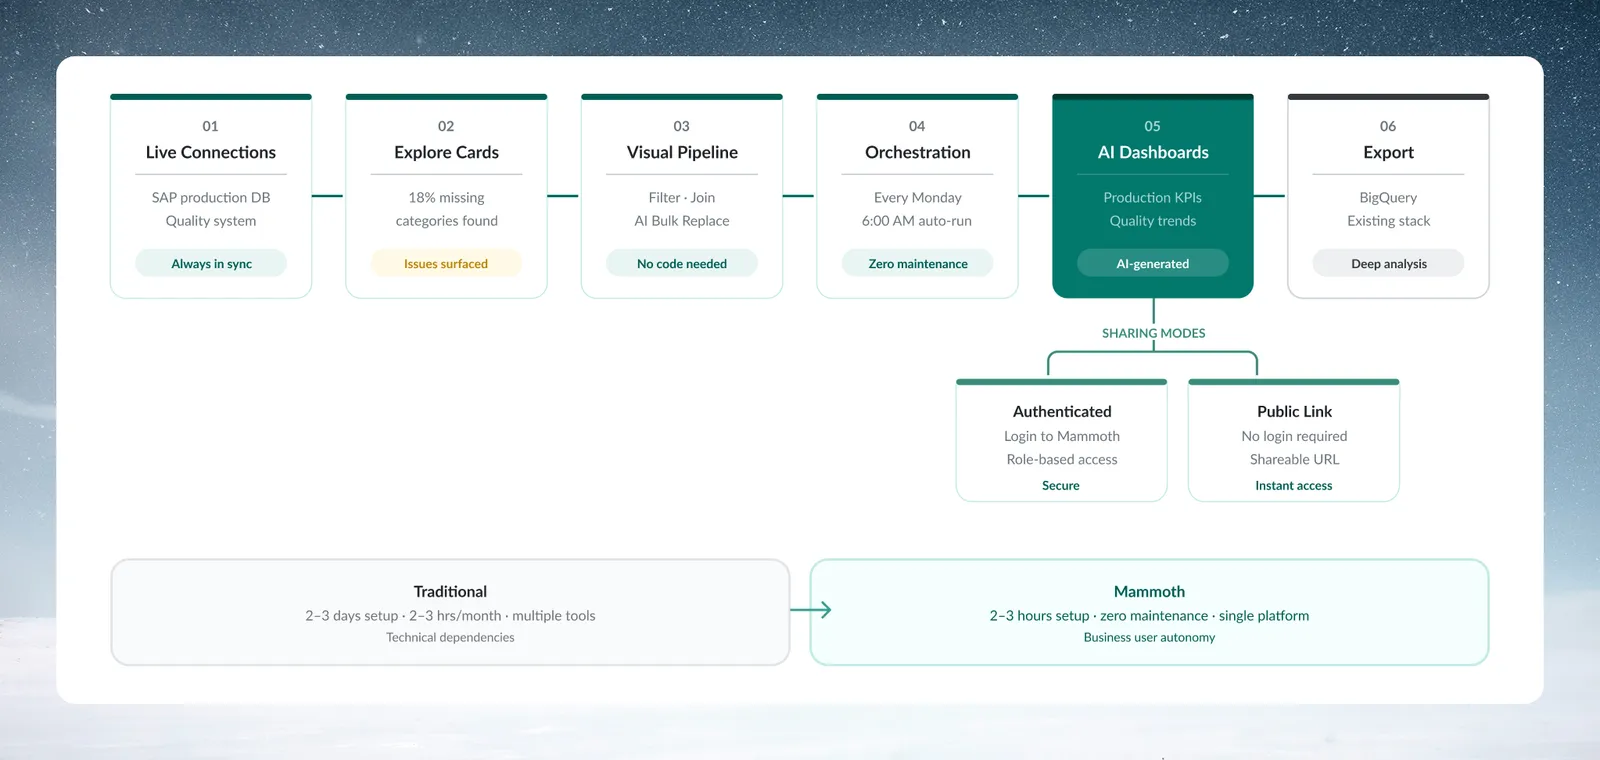
The team connects their SAP HANA production database and their quality system. Explore Cards on the product category column show many empty values. They build a pipeline that filters out test records, standardises vendor names with Bulk Replace, joins production data with quality data, and calculates defect rates by product line.
A Dataset Refresh automation pulls new data every Monday morning, and the pipeline applies the same steps to the new records. A dashboard shows production and quality trends, shared with Sign-in required so plant managers sign in to see it. An export task sends the results to the team's BigQuery warehouse after every run.
Start with one manual process you repeat every month, and automate that first. To try Mammoth with your own data, sign up at mammoth.io/signup.
Related
- Quick start: from a file to a shared dashboard: try the whole workflow on a small file.
- Core ideas: how workspaces, projects, datasets, views and pipelines fit together.
- Pick your path: a plan for analysts, managers and technical users.
- Set up your workspace: first steps for a Workspace Owner.
- Limits and quotas: file sizes, schedule intervals and plan allowances.
Something wrong? support@mammoth.io