How to
Share it with the whole team, no seats to buy
42 seconds, real app, made-up store data. Nothing is published or sent in the video. Download the video (MP4)
The steps
- 1
Open the Share panel
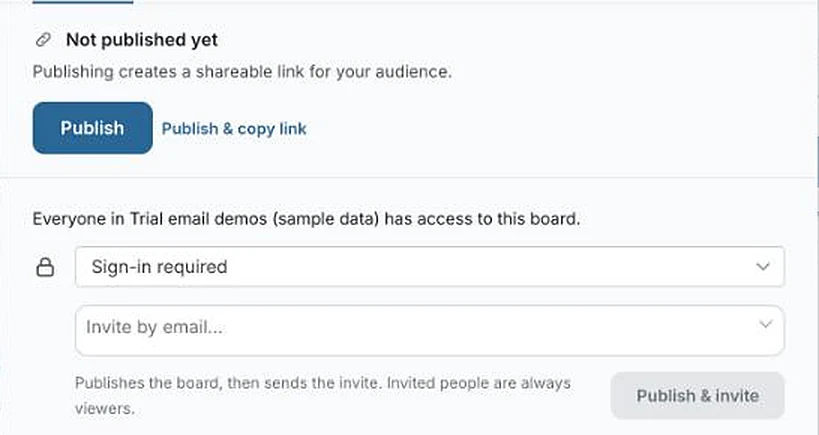
In Dashboards, select the dashboard and choose Share. In the editor, the same panel opens from Publish or Share in the header. A draft reads Not published yet: nobody else can see it until you publish.
- 2
Choose who can open it
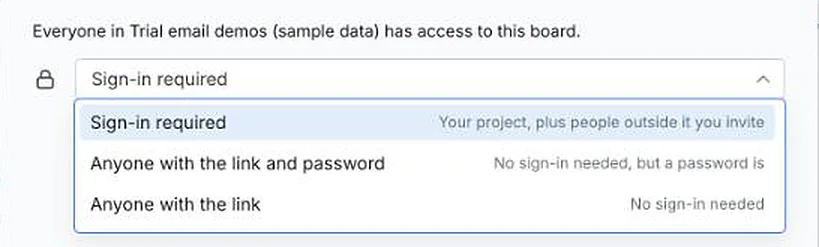
Sign-in required suits your own team: everyone in the project, plus people you invite. Anyone with the link and password needs no sign-in but asks for a password. Anyone with the link opens for whoever has it, which suits clients and board packs.
- 3
Publish and send it
Choose Publish & copy link and paste the link into an email, a chat or a slide. Or type addresses in Invite by email and choose Publish & invite. Invited people are always viewers.
- 4
What viewers get
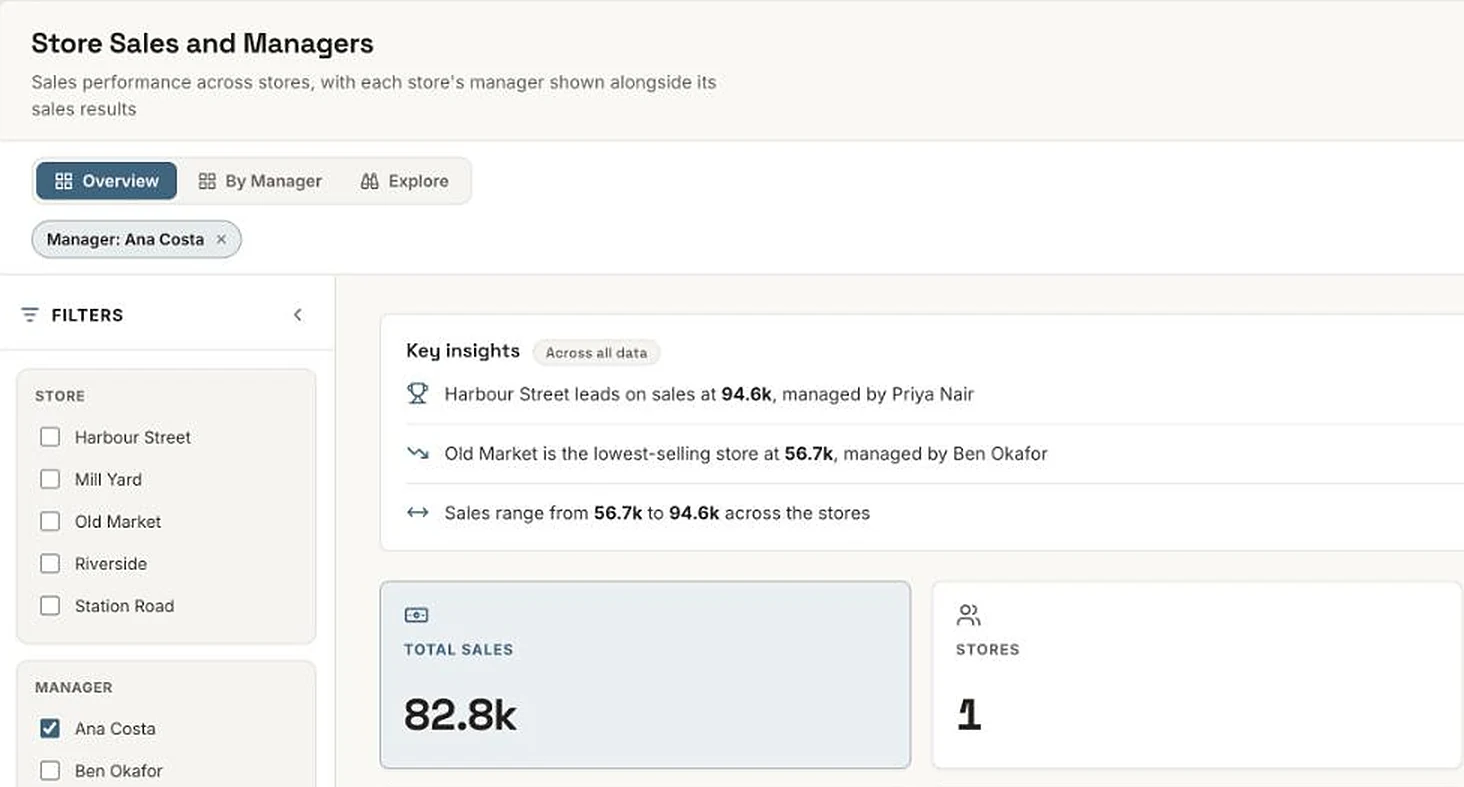
Viewers open the dashboard, use its filters and move between pages. They can't edit it. Only the people who build in Mammoth count towards your plan.
Who to send it to
Anyone who reads the numbers but doesn't build them.
- Site or store heads, each checking their own location
- Clients, with an open or password link
- The board, before the meeting instead of in it
Viewers are free on every plan, so there's no reason to ration the link.
If it doesn’t look right
- Publish is greyed out or blocked
- Save your changes first; you can't publish with unsaved edits. A dashboard on sample data can't be published until you connect your own data, and each plan has a limit on published dashboards.
- Each person should see only their own rows
- Under Advanced in the Share panel, row-level security restricts the rows each viewer sees. Some advanced options depend on your plan.
- You need to take it back
- Open Share and choose Unpublish. The link stops working straight away. Your draft stays, and the same link works again if you republish.
Keep it current
More how-tos
- Tell it what to pull, in plain wordsName the fields you want from an invoice PDF and get them as one row.
- Put two files on one dashboardJoin sales to targets on the store they share and chart them side by side.
- Describe the change, skip the formulaSplit a name column into first and last by saying so, then check the preview.
- Next month's file, same stepsAdd next month's file and every cleaning step runs again; a changed layout stops to ask.
- Next month's statement, zero reworkRead a PDF statement once; next month's goes through the saved recipe into the same columns.
- Every table in your PDF, joined into oneTables that share columns come back as one dataset, even across pages.
- Describe a dashboard, get one built from your dataPick one of the dashboards Mammoth suggests from your columns, or describe your own.
- Drop in your messiest spreadsheetStacked headers, merged cells and subtotals, turned into a clean table you check first.
- Let viewers ask their own questionsThe Q&A page answers viewers' follow-ups from the data, with the source and a CSV.
- Scans and phone photos work tooMammoth reads documents with no text layer, such as scanned PDFs and photos of receipts.
- Add next month, and your dashboard followsUpload the new month to the same dataset and every chart picks it up. Works on Free.


Share your first dashboard.
Open Share, pick who can see it, publish and send the link.
- ✓ 14-day Pro trial
- ✓ No credit card
- ✓ Viewers always free