How to
Put two files on one dashboard
107 seconds, real app, made-up store data. Follow along with the same three: October sales (CSV), store targets (Excel) and November sales (CSV). Download the video (MP4)
The steps
- 1
Upload both files
In Data, choose New dataset and upload both files at once. Each becomes its own dataset. Here, one has a row per store with its sales for the month; the other lists each store's manager, region and monthly target.
- 2
Start a join from the sales data
Open the sales dataset in Explore, choose the + button to add a step, then Unify and Join. Pick the other file, Store targets, and choose Select.
- 3
Match on the column they share
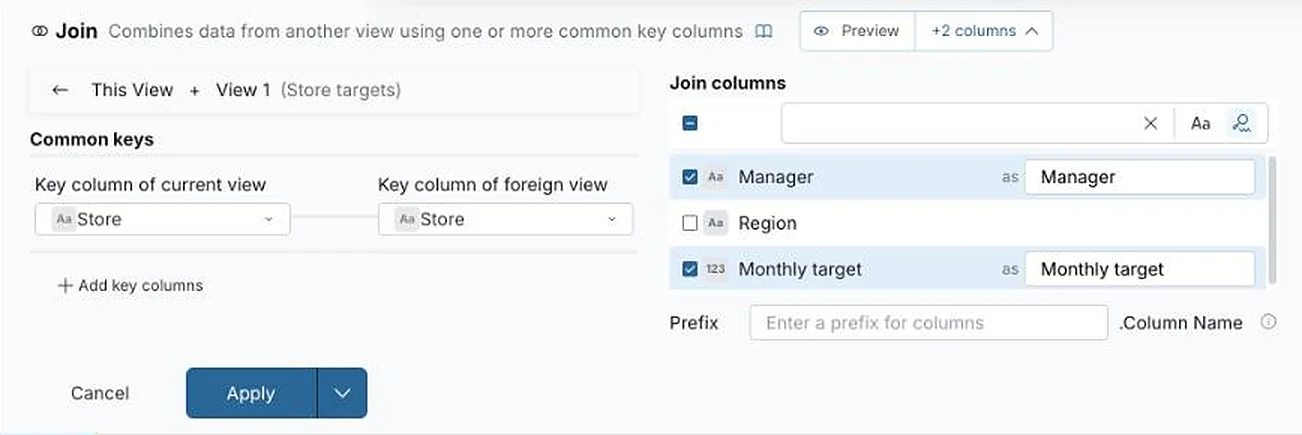
Set the key column to Store on both sides. Then tick the columns to bring across, here Manager and Monthly target. The preview shows the joined rows before anything changes.
- 4
Check the matches, then apply
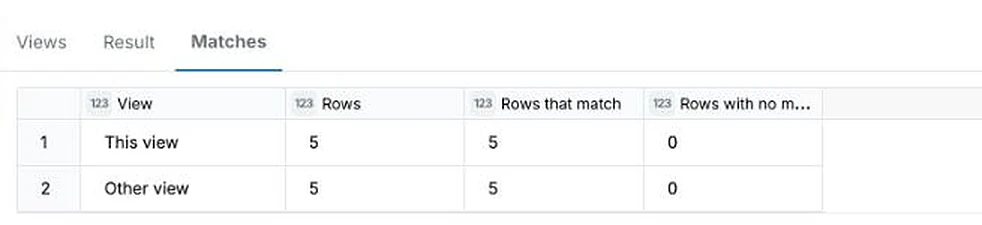
The Matches tab counts rows on each side that found a partner. All five stores matched and none were left over. If some don't, check the spelling of the key values. Then choose Apply.
- 5
See the joined rows
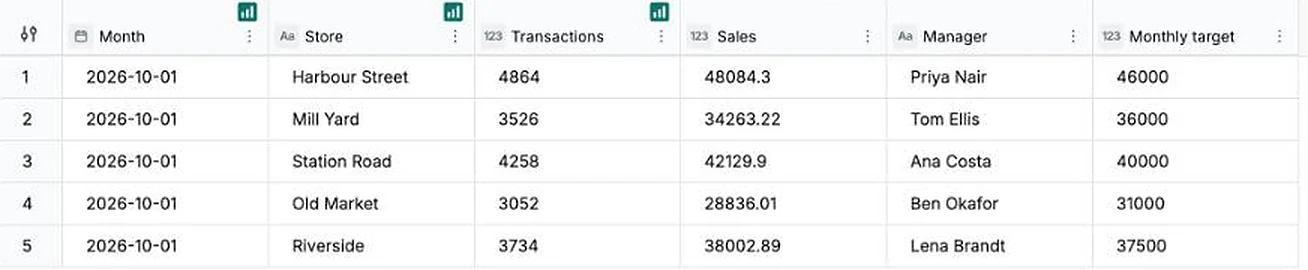
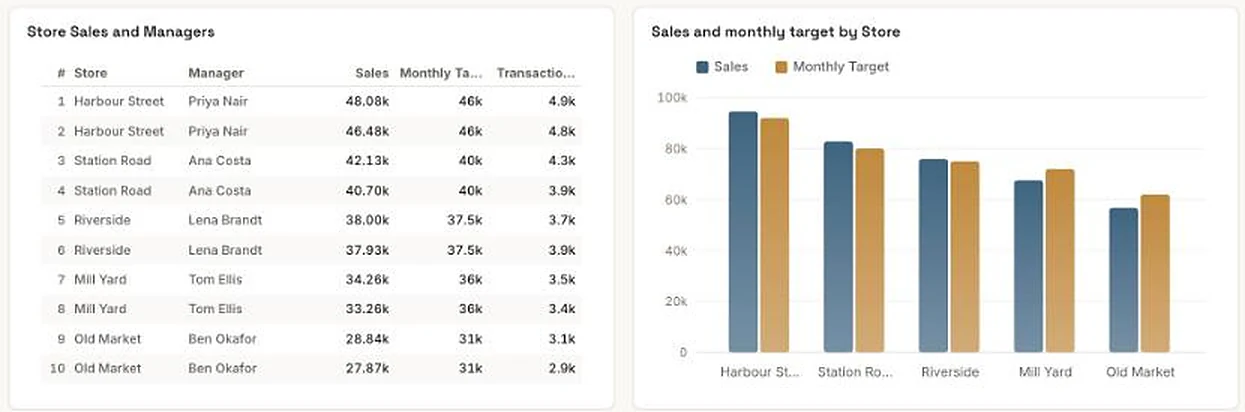
Each sales row now carries its store's manager and target. The join is a step in the pipeline, so it runs again whenever either file changes.
- 6
Build the dashboard
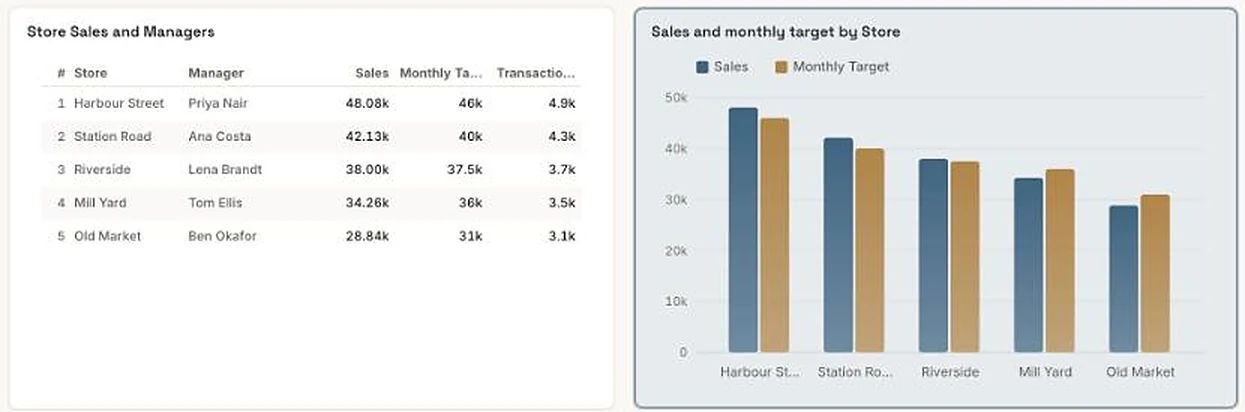
Choose Publish, then Dashboard, and describe what you want. Mammoth builds a draft. To put sales and target side by side, choose Add, pick Bar, choose Add measure and set it to Monthly target.
- 7
Add next month
When November's sales arrive, open the sales dataset and choose Add data. The join runs again, and the dashboard picks up the new rows, each with its manager and target.
Pick a good key
The key is the column both files share. The join matches rows where its values are the same.
- Store name, customer ID, product code or invoice number
- Two key columns when one isn't unique, such as store and month
- The same spelling and type on both sides: “Mill Yard” won't match “Mill Yard Ltd”
If one file has several rows per key and the other has one, join the one-row file into the many-row file, as here.
If it doesn’t look right
- Some rows didn't match
- Look at the Matches tab for the count, then compare the key values in both files. Spaces, capitals and abbreviations are the usual cause. Clean them in Explore before the join.
- A total is far too big
- If the sales file had a row per day, a monthly target would repeat on every day and add up to many times its real size. Join targets to sales at the same grain, here a row per store per month.
- The column you want isn't on the dashboard
- A dashboard reads the columns the view had when it was built. Tick the column in the join, then add a chart for it with Add.
Every month after
More how-tos
- Tell it what to pull, in plain wordsName the fields you want from an invoice PDF and get them as one row.
- Describe the change, skip the formulaSplit a name column into first and last by saying so, then check the preview.
- Next month's file, same stepsAdd next month's file and every cleaning step runs again; a changed layout stops to ask.
- Next month's statement, zero reworkRead a PDF statement once; next month's goes through the saved recipe into the same columns.
- Share it with the whole team, no seats to buyPublish a dashboard and send the link; viewers are free on every plan.
- Every table in your PDF, joined into oneTables that share columns come back as one dataset, even across pages.
- Describe a dashboard, get one built from your dataPick one of the dashboards Mammoth suggests from your columns, or describe your own.
- Drop in your messiest spreadsheetStacked headers, merged cells and subtotals, turned into a clean table you check first.
- Let viewers ask their own questionsThe Q&A page answers viewers' follow-ups from the data, with the source and a CSV.
- Scans and phone photos work tooMammoth reads documents with no text layer, such as scanned PDFs and photos of receipts.
- Add next month, and your dashboard followsUpload the new month to the same dataset and every chart picks it up. Works on Free.


Try it with your own two files.
Upload both, join on the column they share, then build the dashboard.
- ✓ 14-day Pro trial
- ✓ No credit card
- ✓ Viewers always free