How to
Drop in your messiest spreadsheet
49 seconds, real app, made-up sales report. Follow along with the same file: Messy store report (Excel). Download the video (MP4)
The steps
- 1
Upload the file
In Data, choose New dataset and upload your spreadsheet. If it can be read more than one way, Mammoth asks rather than guessing. Choose how to read it.
- 2
See what you're working with
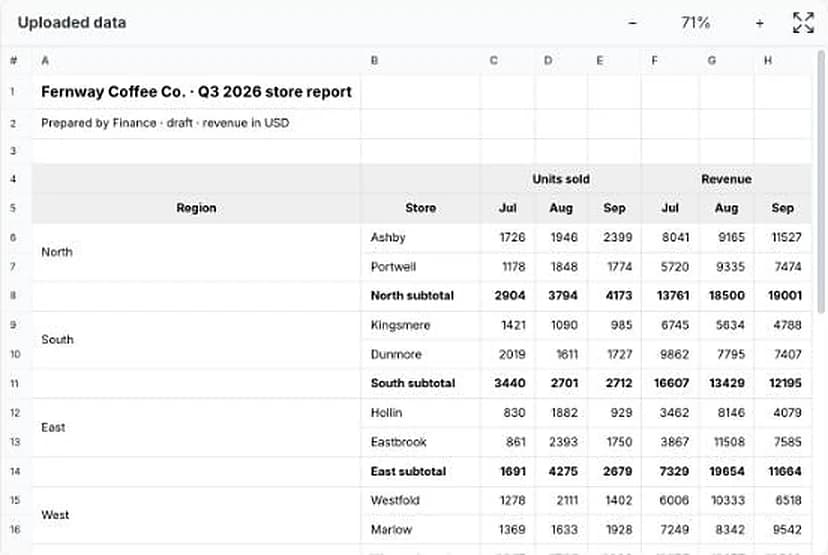
On the left is your file as it is. This one has a title and notes, a header in two rows (Units sold and Revenue, each over Jul, Aug, Sep), regions in merged cells, a subtotal after each region, a total, and a second table of store managers further down.
- 3
Say what one row should be
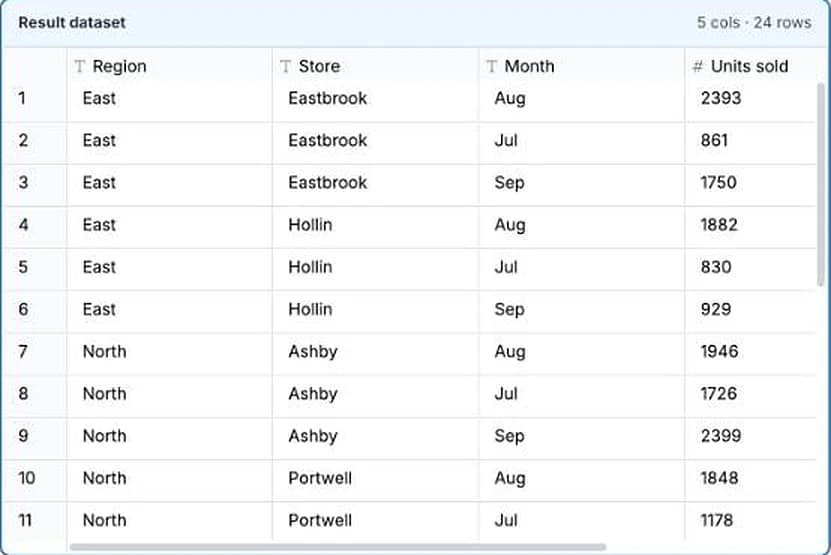
Mammoth suggests a way to read each table it found. Choose one, or type your own. Here: one row per store and month: region, store, month, units sold and revenue.

- 4
Check the result
On the right is what you'll get: 24 rows, 8 stores × 3 months, with the region on every row. Units and revenue are numbers. The subtotals, the total and the note are left out. If it's not right, change your words and run it again.
- 5
Save it
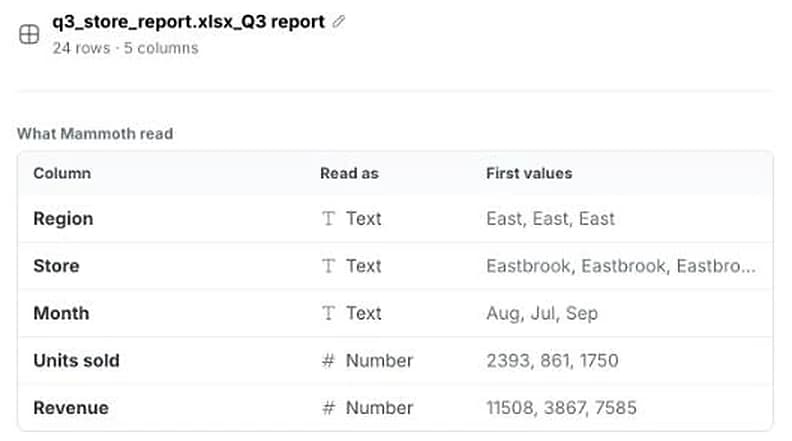
Choose Looks right. Mammoth shows each column and what it was read as. Choose Create dataset. Check one number against the file: here revenue adds up to 180,130, the report's total.
Ways to describe the table you want
Say what one row is, then list the columns.
- One row per store and month: region, store, month, units sold and revenue
- Keep only the store managers table
- One row per product, skip the totals
- Stack the sheet's blocks into one table with a Region column
Want both tables? Read the file once for each. Each becomes its own dataset.
If it doesn’t look right
- A subtotal or total row came through
- Say so in your request, for example “leave out subtotal and total rows”, and run it again. Then compare a total with the file.
- The region is blank on some rows
- That's a merged cell that wasn't carried down. Ask for it by name: “fill the region on every row”.
- A number came in as text
- Check the file for symbols or notes in the cells. After saving, change the column's type to Number in Explore.
Next quarter's report
More how-tos
- Tell it what to pull, in plain wordsName the fields you want from an invoice PDF and get them as one row.
- Put two files on one dashboardJoin sales to targets on the store they share and chart them side by side.
- Describe the change, skip the formulaSplit a name column into first and last by saying so, then check the preview.
- Next month's file, same stepsAdd next month's file and every cleaning step runs again; a changed layout stops to ask.
- Next month's statement, zero reworkRead a PDF statement once; next month's goes through the saved recipe into the same columns.
- Share it with the whole team, no seats to buyPublish a dashboard and send the link; viewers are free on every plan.
- Every table in your PDF, joined into oneTables that share columns come back as one dataset, even across pages.
- Describe a dashboard, get one built from your dataPick one of the dashboards Mammoth suggests from your columns, or describe your own.
- Let viewers ask their own questionsThe Q&A page answers viewers' follow-ups from the data, with the source and a CSV.
- Scans and phone photos work tooMammoth reads documents with no text layer, such as scanned PDFs and photos of receipts.
- Add next month, and your dashboard followsUpload the new month to the same dataset and every chart picks it up. Works on Free.


Try it on your own messiest file.
Upload it, say what one row should be, and check the result before you save.
- ✓ 14-day Pro trial
- ✓ No credit card
- ✓ Viewers always free