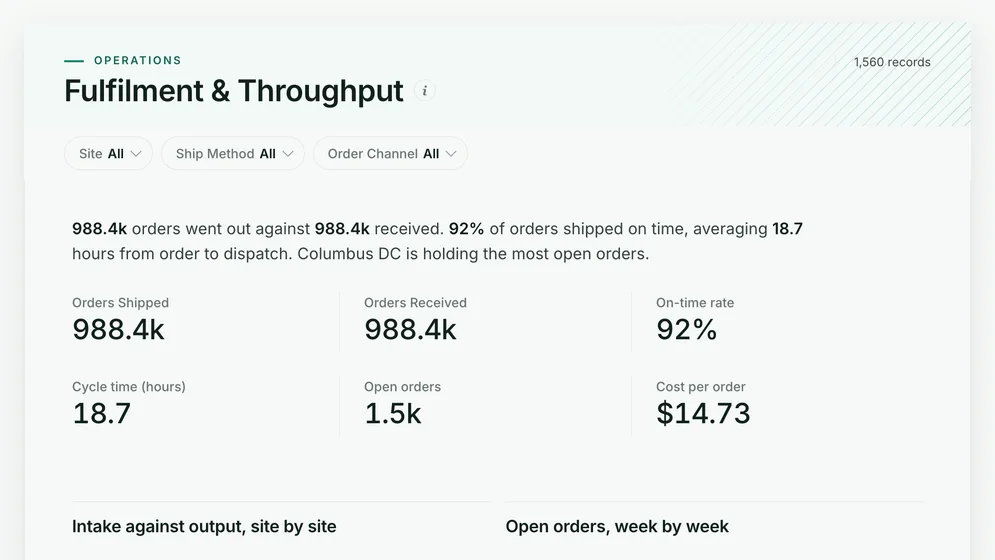
Order fulfilment and throughput dashboard
Are orders going out on time, and where is the backlog building?
- Orders shipped
- Orders received
- On-time rate
- Cycle time (hours)
Supply chain dashboards
Six dashboards that follow the chain from supplier to customer: fulfilment and backlog, warehouse throughput, reorder risk, aged stock, delivery and returns, and supplier spend. Open any of them to see it in full, then use it as a template for your own data.
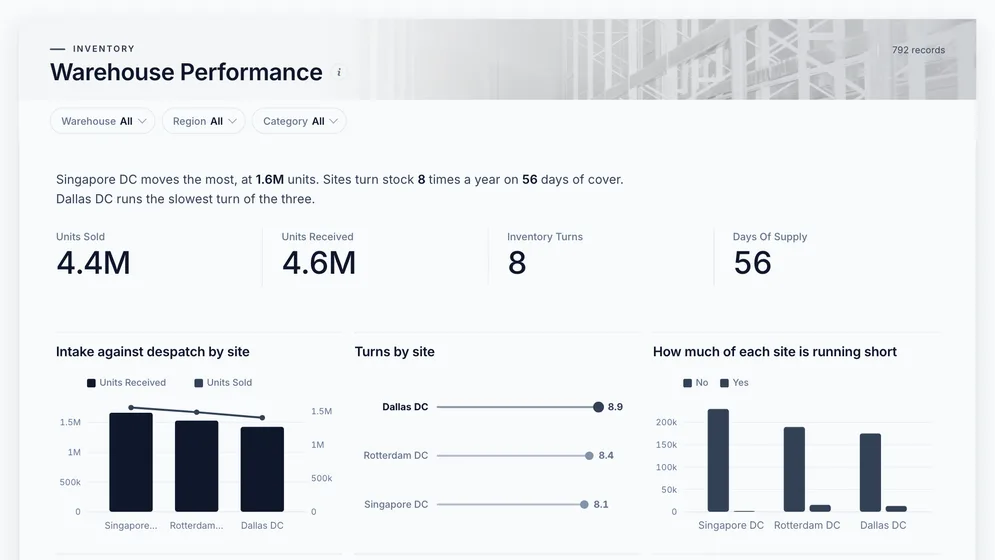
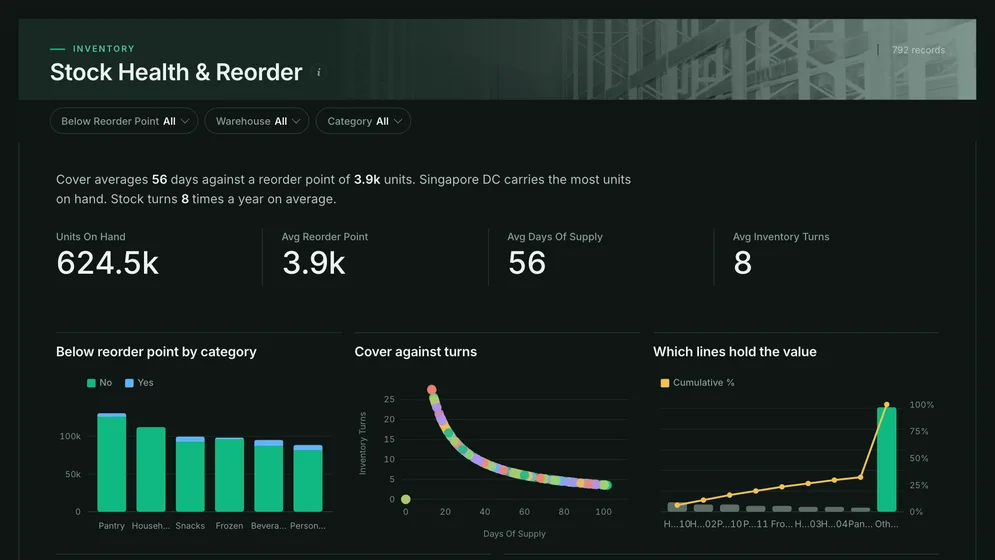
Three of the six examples. All figures are sample data.
The examples
Click a board to see all of it. Click Use template to start your own copy in Mammoth. All figures are sample data.
Are orders going out on time, and where is the backlog building?
Is every warehouse keeping up with the stock coming in?
What will run out before the next delivery?
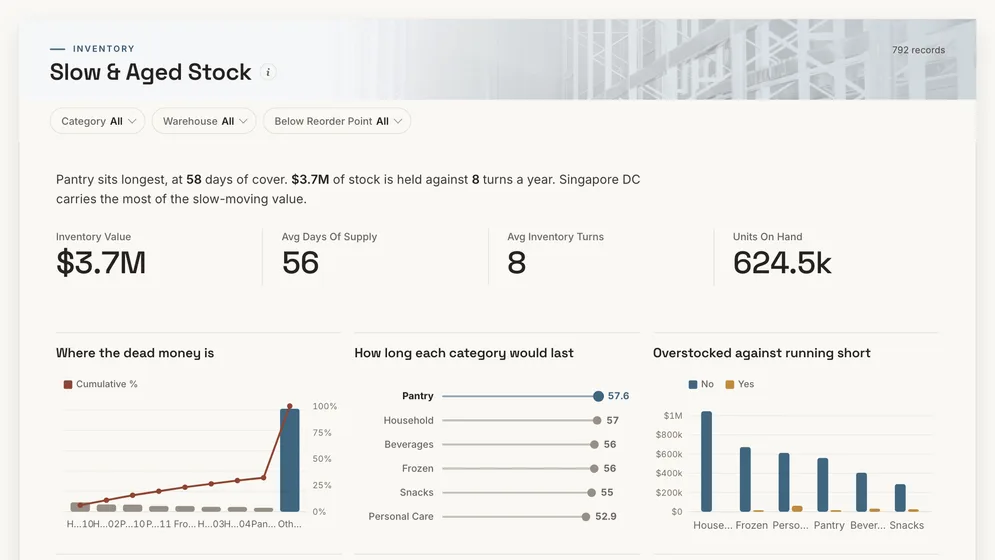
Where is cash sitting in stock that is not moving?
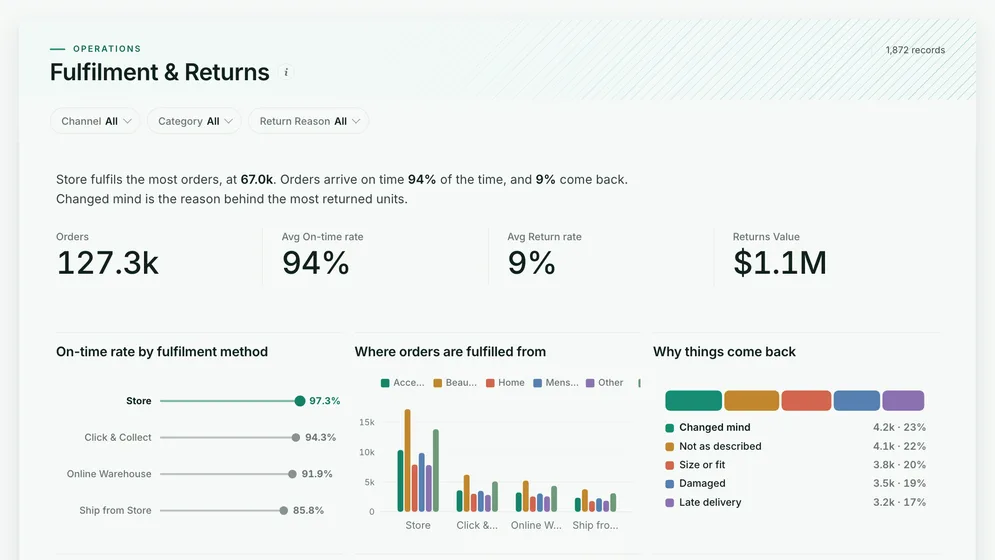
Do orders arrive on time, and what comes back?
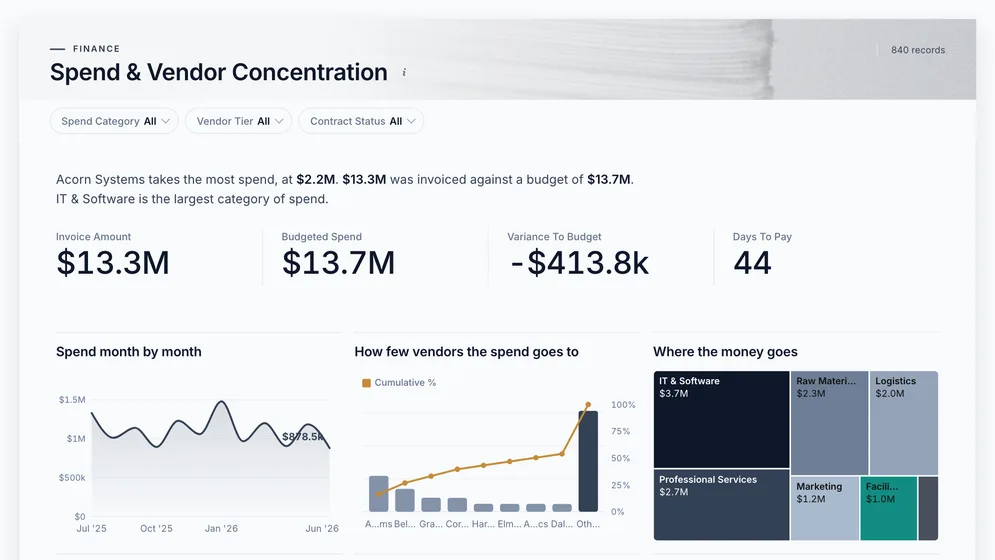
Which suppliers does the chain depend on?
Definition
A supply chain dashboard is one screen that follows goods from supplier to customer: what was ordered, what is in stock, what each warehouse is shipping and whether it arrives on time. It joins data that usually sits in separate systems, such as purchasing, stock records, the warehouse system and carrier exports.
Suppliers, stock, warehouses and delivery.
Backlog and reorder risk show up days ahead.
Agreed once, used on every board.
The metrics
Ten numbers, one or two per link in the chain. Most depend on a definition you agree first, such as when an order is late or what counts as running out.
What share of orders arrive when we said they would?
A promised date and a delivered date per order. Measuring against the dispatch date instead of the promise hides every carrier delay.
What share of orders ship complete, first time?
Ordered and shipped quantities per order line. A backorder that ships complete a week later is still a miss on the day it was due.
How long does an order take from placed to dispatched?
Timestamps for each stage in one time zone. Show the spread, not just the average, because a few slow orders hide inside a good mean.
How many orders are waiting, and is the queue growing?
Orders received and shipped over the same window, per site. Output alone looks healthy while the queue behind it doubles.
How many times a year does the stock sell through?
Cost of goods sold and average stock value for the same period. A month-end stock figure alone misses the swings in between.
How long would current stock last at the current rate?
Stock on hand and recent daily usage per item and site. A rate taken from a promotion week makes every item look short.
Which items need ordering now?
A reorder point per item that reflects the supplier's real lead time. A reorder point set once and never updated is a guess.
How much cash is tied up in stock that is not moving?
Stock value with the date each item last moved. Without the movement date, slow stock and new stock look the same.
What does it cost to get one order out of the door?
Labour, packing and shipping cost for the same period and site as the order count. Leave out labour and the cheapest site is the one with the most overtime.
How much of the chain depends on a few vendors?
Spend per vendor over twelve months with vendors de-duplicated. The same supplier under three names hides how dependent you are.
How to build one
From one of the examples above to a live dashboard on your own data.
Start from any of the six boards above.
Upload a spreadsheet, or connect one of 100+ tested connectors.
Fix and combine your data once. Mammoth repeats those steps for you.
The dashboard updates on a schedule and flags data that fails a check.
Public, password-protected or sign-in only, on every plan.
14-day Pro trial · No credit card
FAQ
Last reviewed against the template catalogue.
Start from one of these templates or your own spreadsheet. Share it with as many people as you like, free.


