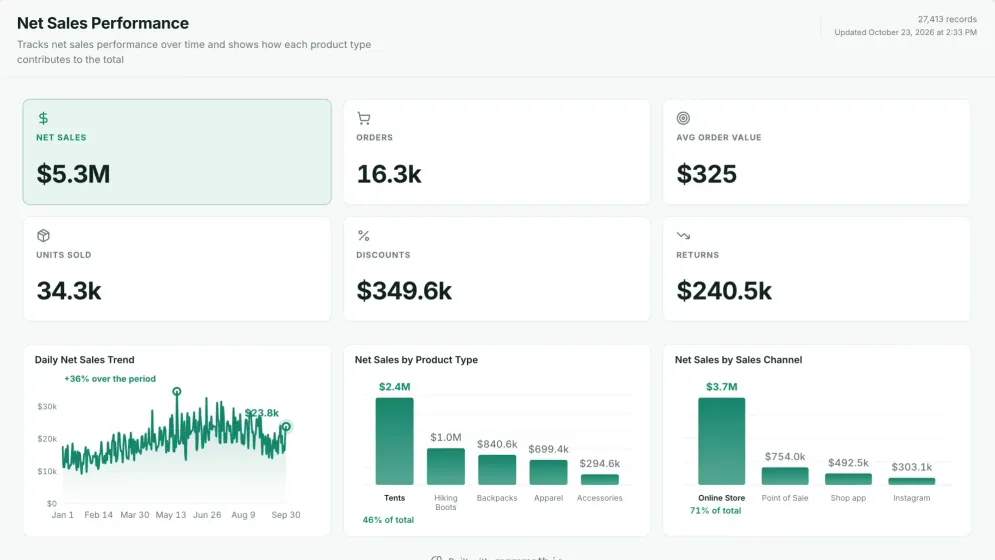
Shopify sales dashboard
Which products and channels bring in the money, once discounts and returns come off?
- Net sales
- Orders
- Avg order value
- Units sold
Ecommerce dashboards
Five dashboards for an online store: sales after discounts and returns, ad return by channel, promotions, sell-through, and delivery and returns. Open any of them to see it in full, then use it as a template for your own data.
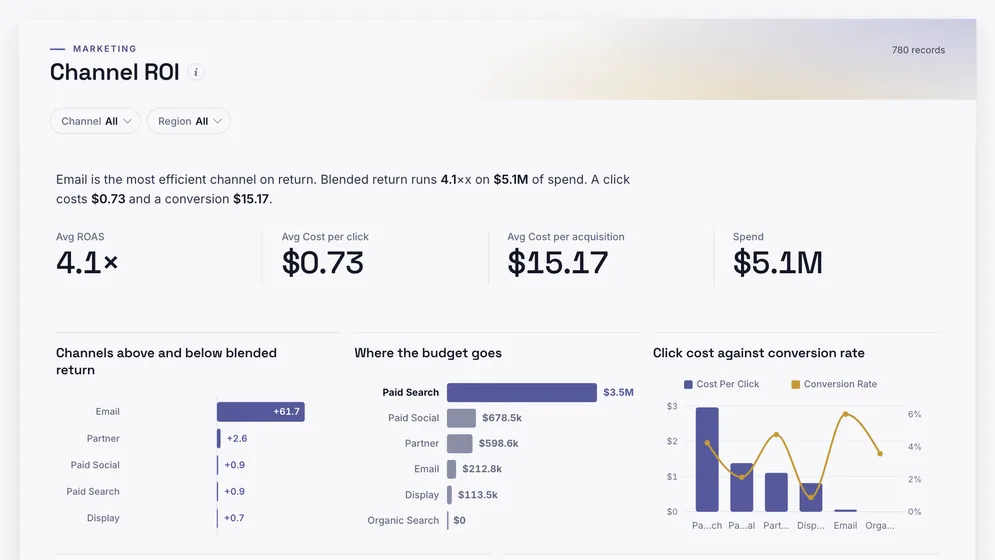
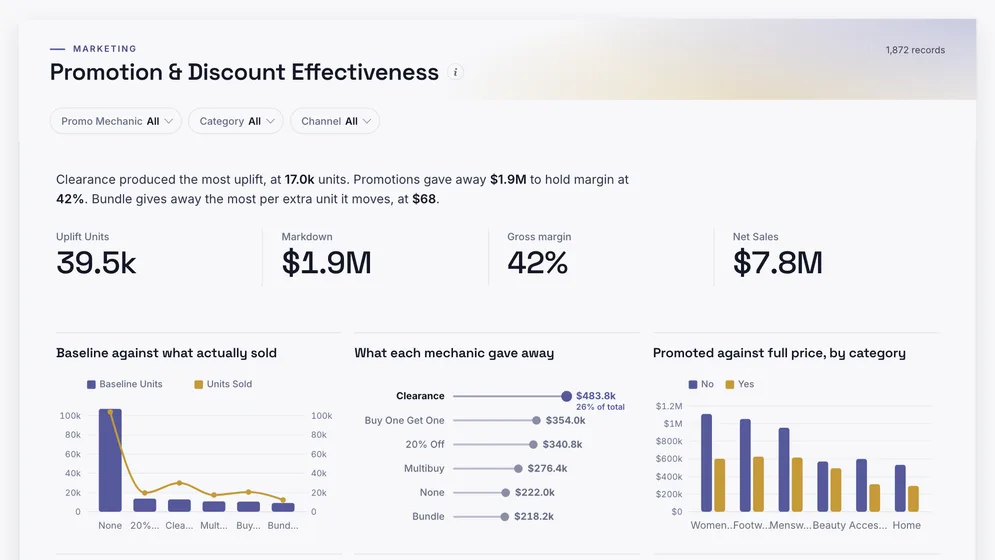
Three of the five examples. All figures are sample data.
The examples
Click a board to see all of it. Click Use template to start your own copy in Mammoth. All figures are sample data.
Which products and channels bring in the money, once discounts and returns come off?
Which ad channels pay back what they cost?
Did the sale bring in extra orders, or discount orders you would have had anyway?
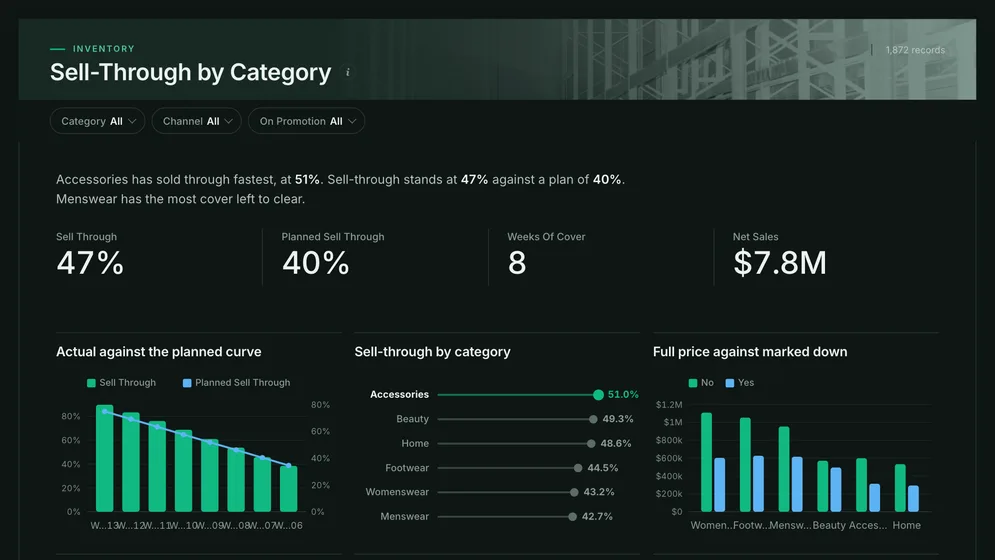
Which categories will sell out, and which will need marking down?
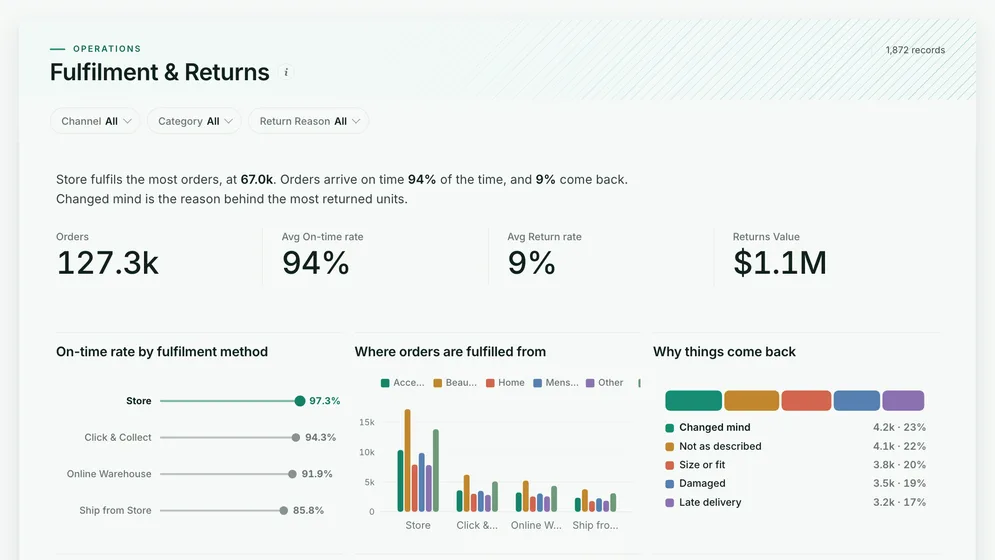
Are orders reaching customers on time, and which products come back?
Definition
An ecommerce dashboard is one screen that shows how an online store is doing: sales, orders, average order value, what customers send back and what the advertising costs. The store's own reports usually lead with gross sales, and each ad platform counts its own conversions.
Sales after discounts and returns, which is what the store keeps.
Ad cost next to the orders it brought in, by channel.
To the product and the delivery method behind them.
The metrics
Eight numbers. Most go wrong in the same way: two systems count the same order differently, so agree the definition before the chart.
How much did the store keep?
Gross sales with discounts and returns taken off, and a decision on shipping and tax made once. Returns belong to the month of the original order, or a good month looks bad.
How much does a customer spend per order?
Net sales and an order count from the same source. Counting split shipments as separate orders makes the average look smaller than it is.
What share of visits end in an order?
Sessions from your web analytics and orders from the store, over the same dates and time zone. Two tools that disagree on what a session is will move this number on their own.
How much of what we sell comes back, and why?
Returns matched to the original order line, with a reason code and the product. Without the product, a sizing problem in one range looks like a store-wide problem.
What does each dollar of advertising bring back?
Spend per channel from the ad accounts and the sales each channel brought in, credited one way. Each platform claims its own conversions, so their totals add up to more than the store sold.
What does it cost to win one order or one new customer?
Ad spend per channel and a count of orders or first-time customers, chosen once. Mixing the two makes a channel that sells to existing customers look cheap.
How much of the price are we giving away?
Discount value per order line next to the full price. A rising discount rate with steady net sales means the same revenue is costing more margin.
How fast is the stock we bought turning into sales?
Units sold against units received for the same products and period. A rate measured against the starting stock only ignores what arrived mid-season.
How to build one
From one of the examples above to a live dashboard on your own data.
Start from any of the five boards above.
Upload a spreadsheet, or connect one of 100+ tested connectors.
Fix and combine your data once. Mammoth repeats those steps for you.
The dashboard updates on a schedule and flags data that fails a check.
Public, password-protected or sign-in only, on every plan.
14-day Pro trial · No credit card
FAQ
Last reviewed against the template catalogue.
Start from one of these templates or your own spreadsheet. Share it with as many people as you like, free.


