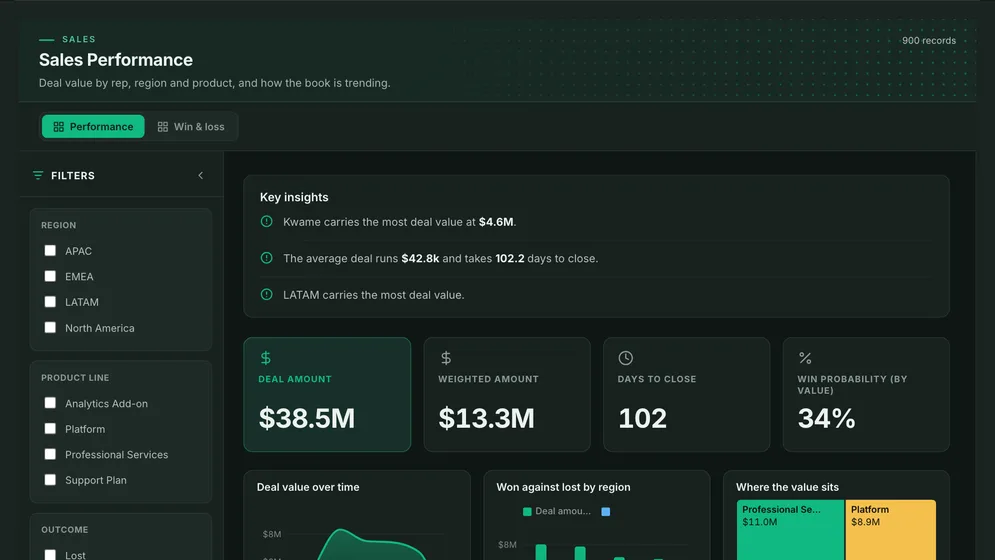
Sales dashboard from Excel
What does the deals sheet say about each rep and region?
- Deal amount
- Weighted amount
- Days to close
- Win probability (by value)
Excel dashboards
Six dashboards made from the workbooks teams already keep: a deals sheet, a budget, a P&L, a project tracker, an HR list and a stock sheet. They are not built inside Excel. You upload the workbook to Mammoth, and when next month's file arrives you upload it again and the dashboard updates.
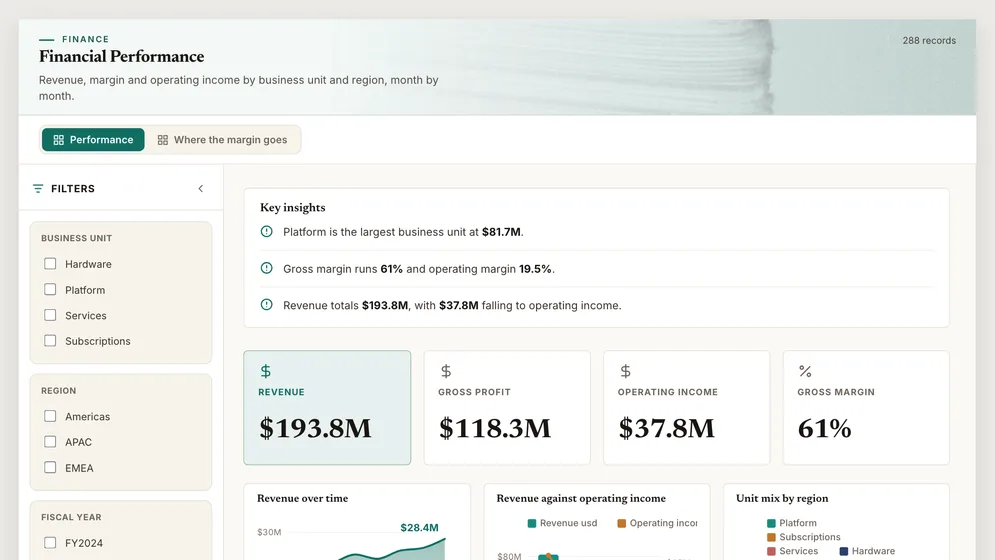
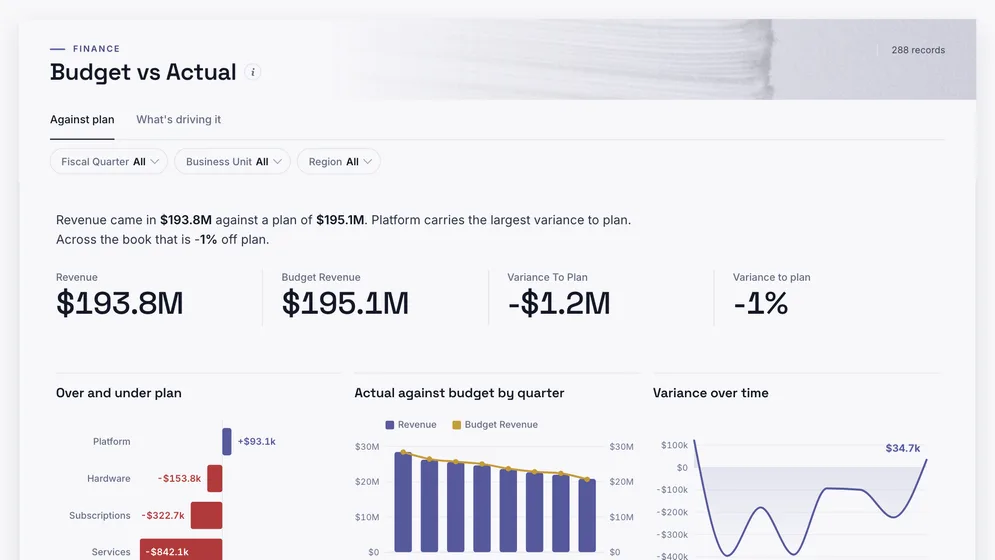
Three of the six examples. All figures are sample data.
The examples
Click a board to see all of it. Click Use template to start your own copy in Mammoth and upload your workbook. All figures are sample data.
What does the deals sheet say about each rep and region?
Where did we beat the budget, and where did we miss it?
How are revenue and margin moving, month by month?
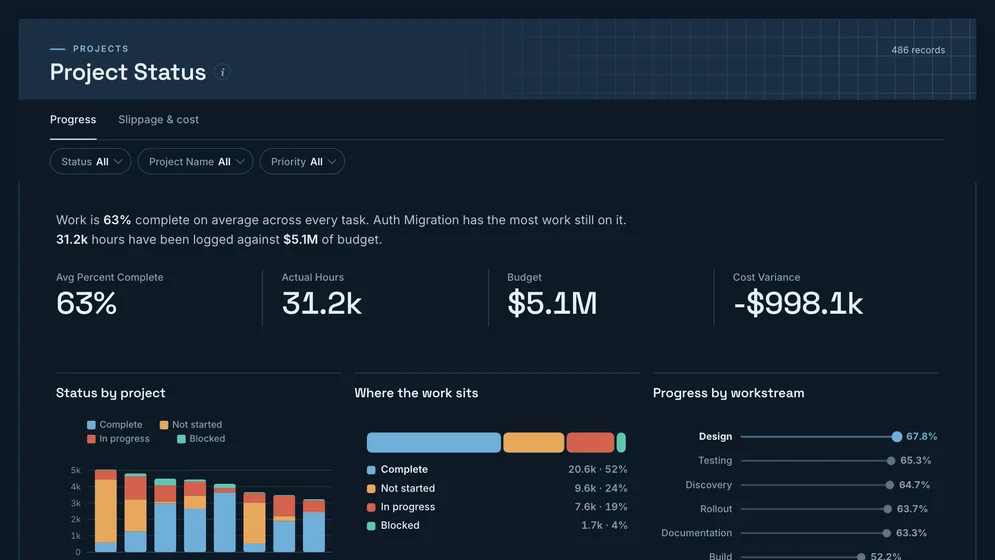
Which projects are late, over budget or blocked?
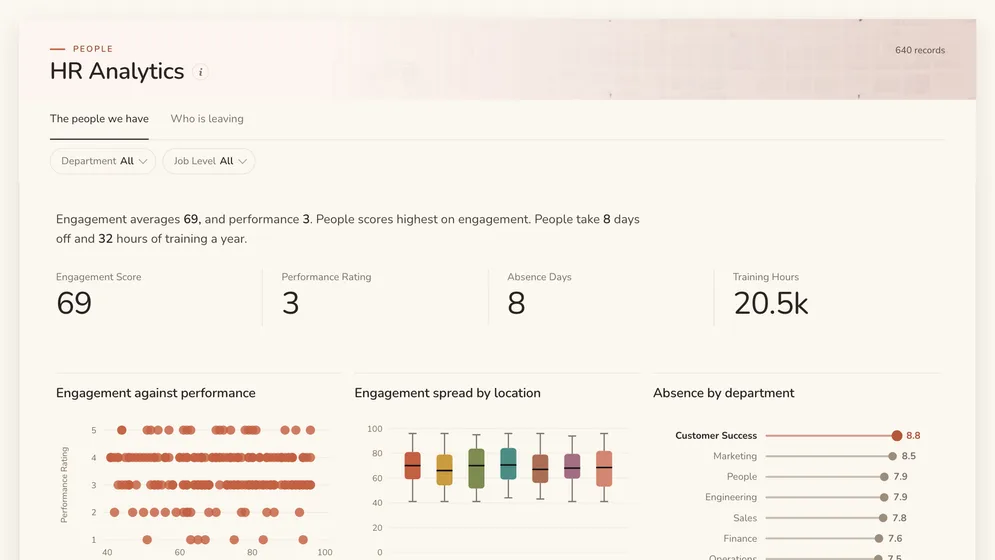
Which teams stand out on engagement, absence or performance?
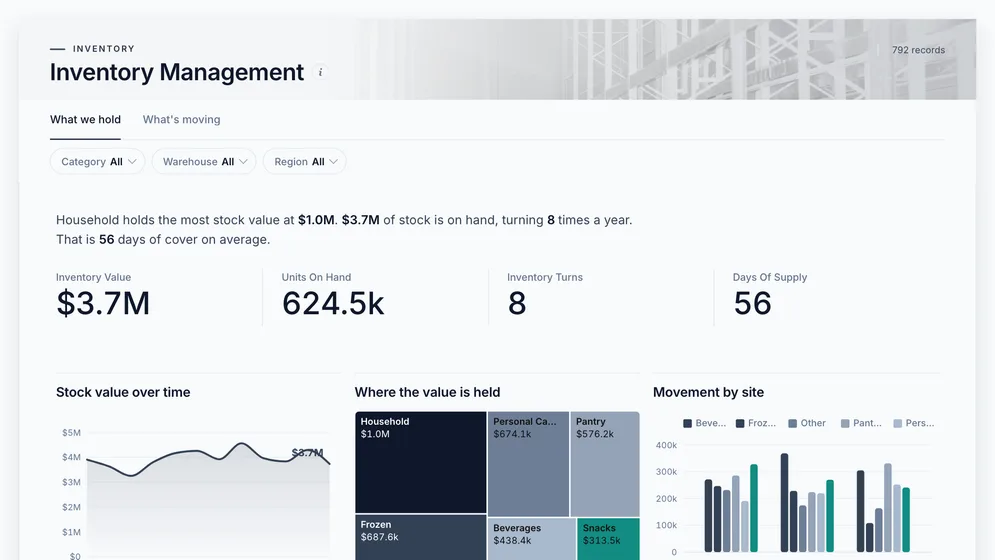
What stock is sitting still, and what is about to run out?
Definition
An Excel dashboard is a one-page summary of the numbers in a spreadsheet, with the key totals at the top and charts underneath, so nobody has to read the rows. Most are built inside Excel with pivot tables and charts on a separate tab, which works until the data changes shape or someone has to rebuild it every month.
Upload the file. Nobody restructures the sheet first.
Upload the new file and the dashboard updates.
Viewers open the dashboard without the workbook.
The metrics
Six common workbooks and the columns each one has to carry. Most spreadsheets already have them. The work is usually in making every month's file look the same.
Who is selling what, and how fast does it close?
One row per deal with amount, rep, region and close date, plus won or lost. A stage typed differently by each rep splits one stage into several.
Where did we land against plan?
Budget and actual in the same layout: the same units, regions and periods. A budget by quarter against actuals by month needs one of them rolled up first.
How are revenue and margin moving?
One row per unit, region and month, with revenue and cost lines as columns. A P&L laid out with months across the top has to be turned so months run down the rows.
What is late, over budget or blocked?
One row per task with project, status, due date and percent complete. Status values need to be a short fixed list, or every spelling becomes its own status.
Which teams stand out, and why?
One row per employee with department, location and the scores you track. Remove names and personal details before sharing a dashboard built from it.
What is sitting still, and what will run out?
One row per product, site and date, with quantity on hand, value and units moved. A sheet that is overwritten each week keeps no history, so save each week's copy.
How to build one
From one of the examples above to a live dashboard on your own data.
Start from any of the six boards above.
Upload a spreadsheet, or connect one of 100+ tested connectors.
Fix and combine your data once. Mammoth repeats those steps for you.
The dashboard updates on a schedule and flags data that fails a check.
Public, password-protected or sign-in only, on every plan.
14-day Pro trial · No credit card
FAQ
Last reviewed against the template catalogue.
Start from one of these templates or your own spreadsheet. Share it with as many people as you like, free.


