Operations dashboards
Operations dashboard examples
In short
What an operations dashboard is
An operations dashboard is a single screen showing whether the day-to-day work of a business is keeping pace: orders going out on time, stock in the right place, sites running to standard, and supplies arriving. It sits below an executive dashboard, which asks how the business is doing, and answers the question underneath: where the work is slipping today. The useful ones lead with exceptions, the late orders, the short site, the supplier everything depends on, rather than with totals.
The examples
Six operations dashboard examples
Real Mammoth templates on sample data. Every figure is illustrative.
Example 01· Template: Warehouse Performance
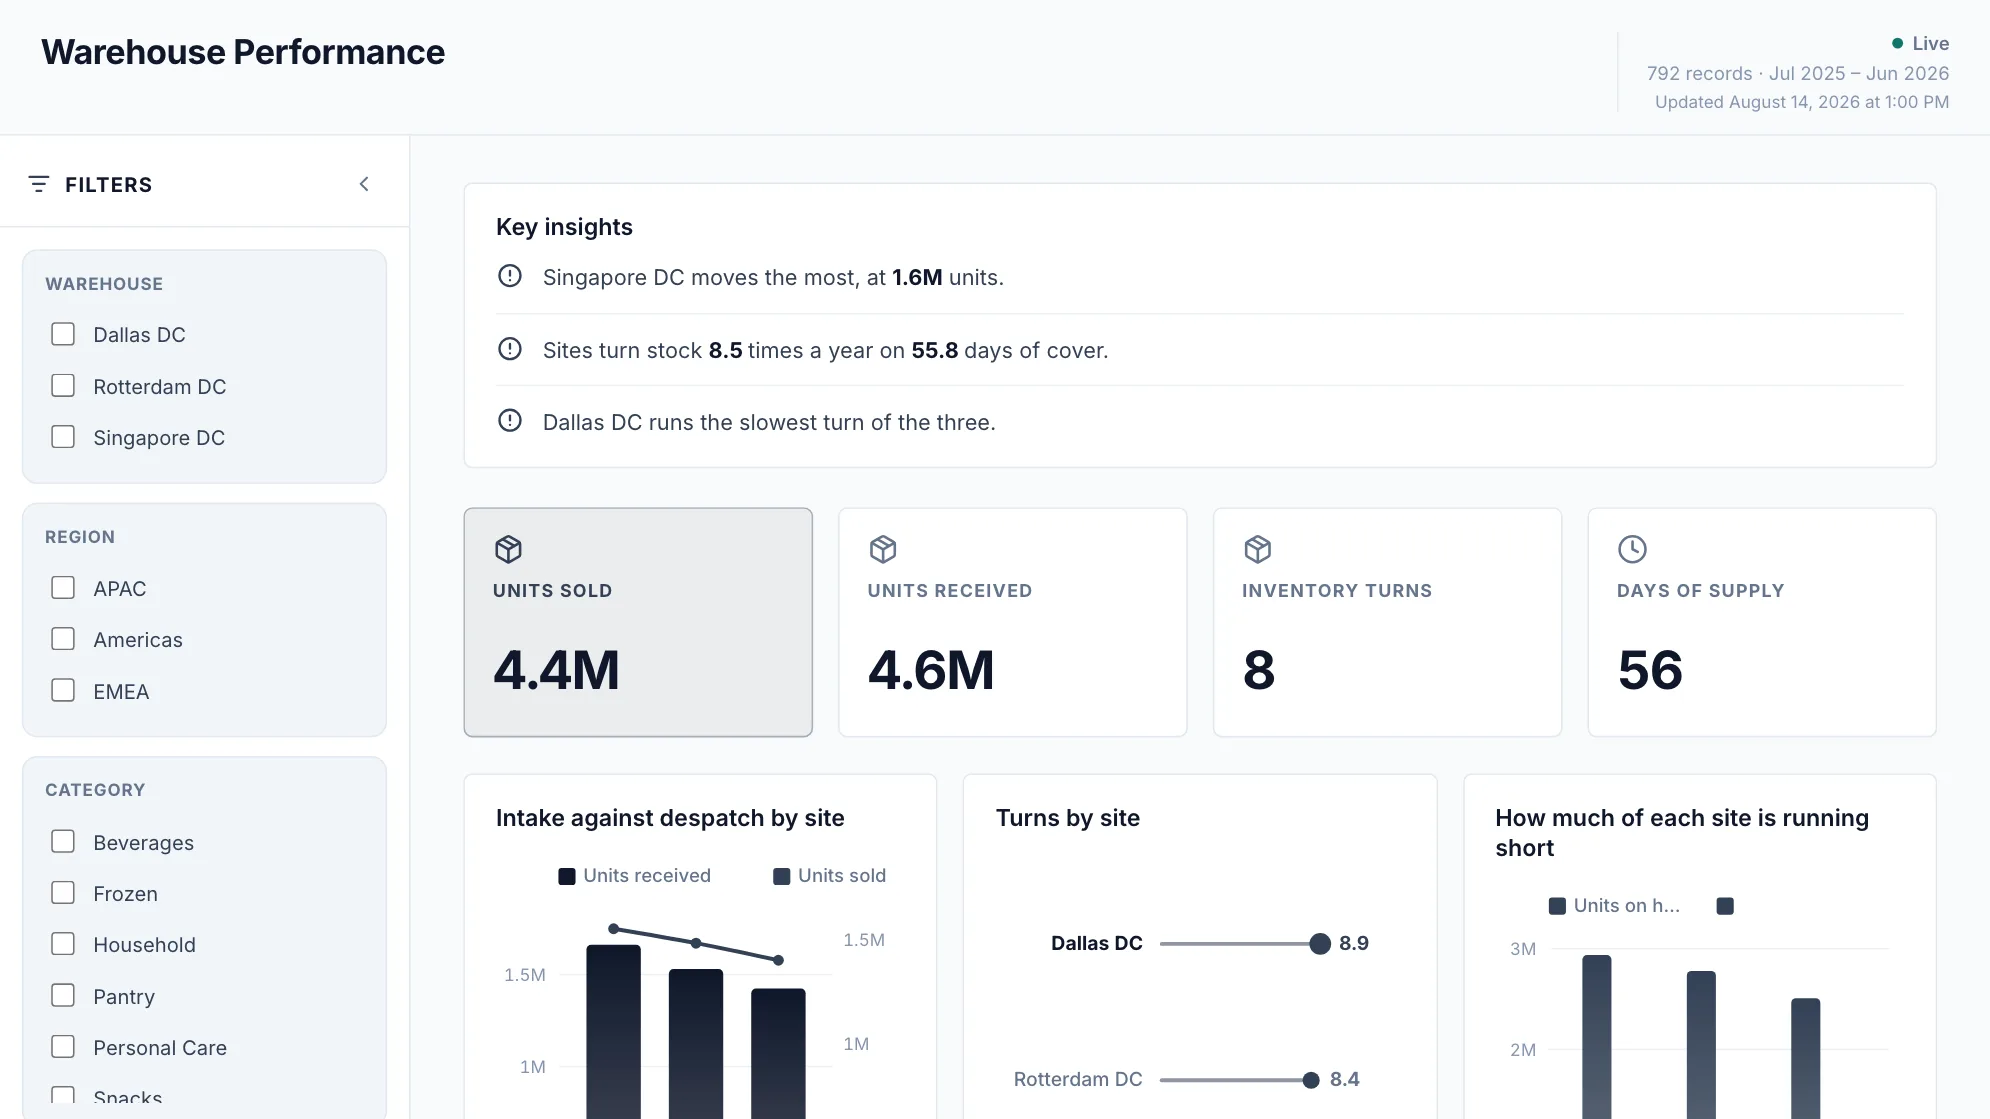
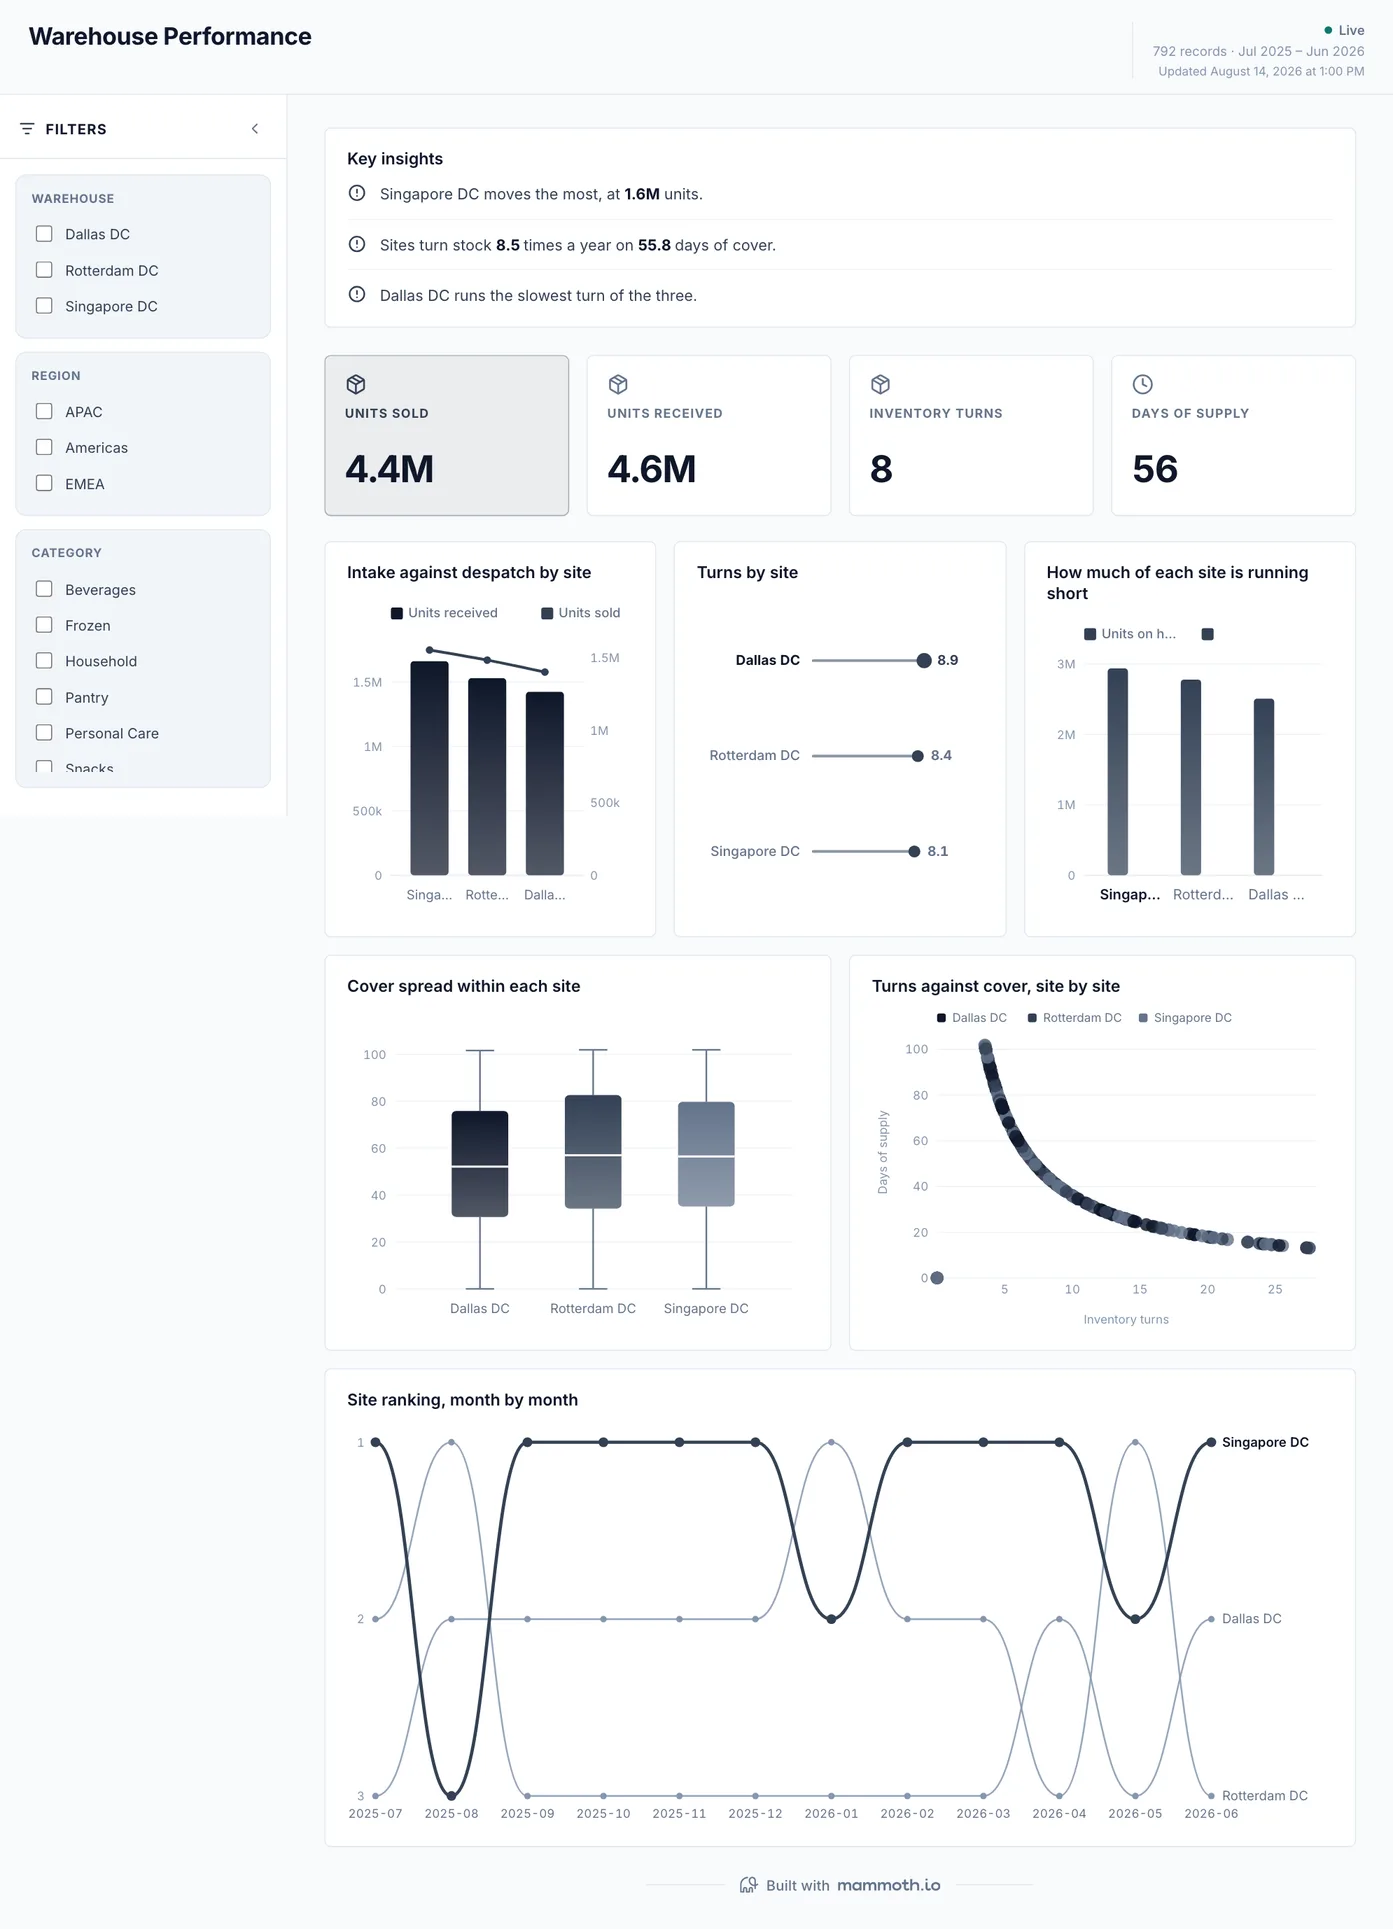
Warehouse operations dashboard
Is every site keeping up with the work coming through it?
Units received against units despatched, site by site, with turns and days of supply beside them. Throughput is the operations question here: a site that receives faster than it ships is building a backlog on its floor, and the month-by-month ranking shows which site has been slipping rather than which one had a bad week.
What is on it
- Intake against despatch by site
- Turns by site
- How much of each site is running short
- Cover spread within each site
- Turns against cover, site by site
- Site ranking, month by month
Your data needsDashboard
- a count column
- a category (~3 values)
Sample data: illustrative figures, not business results. Example 02· Template: Customer Support
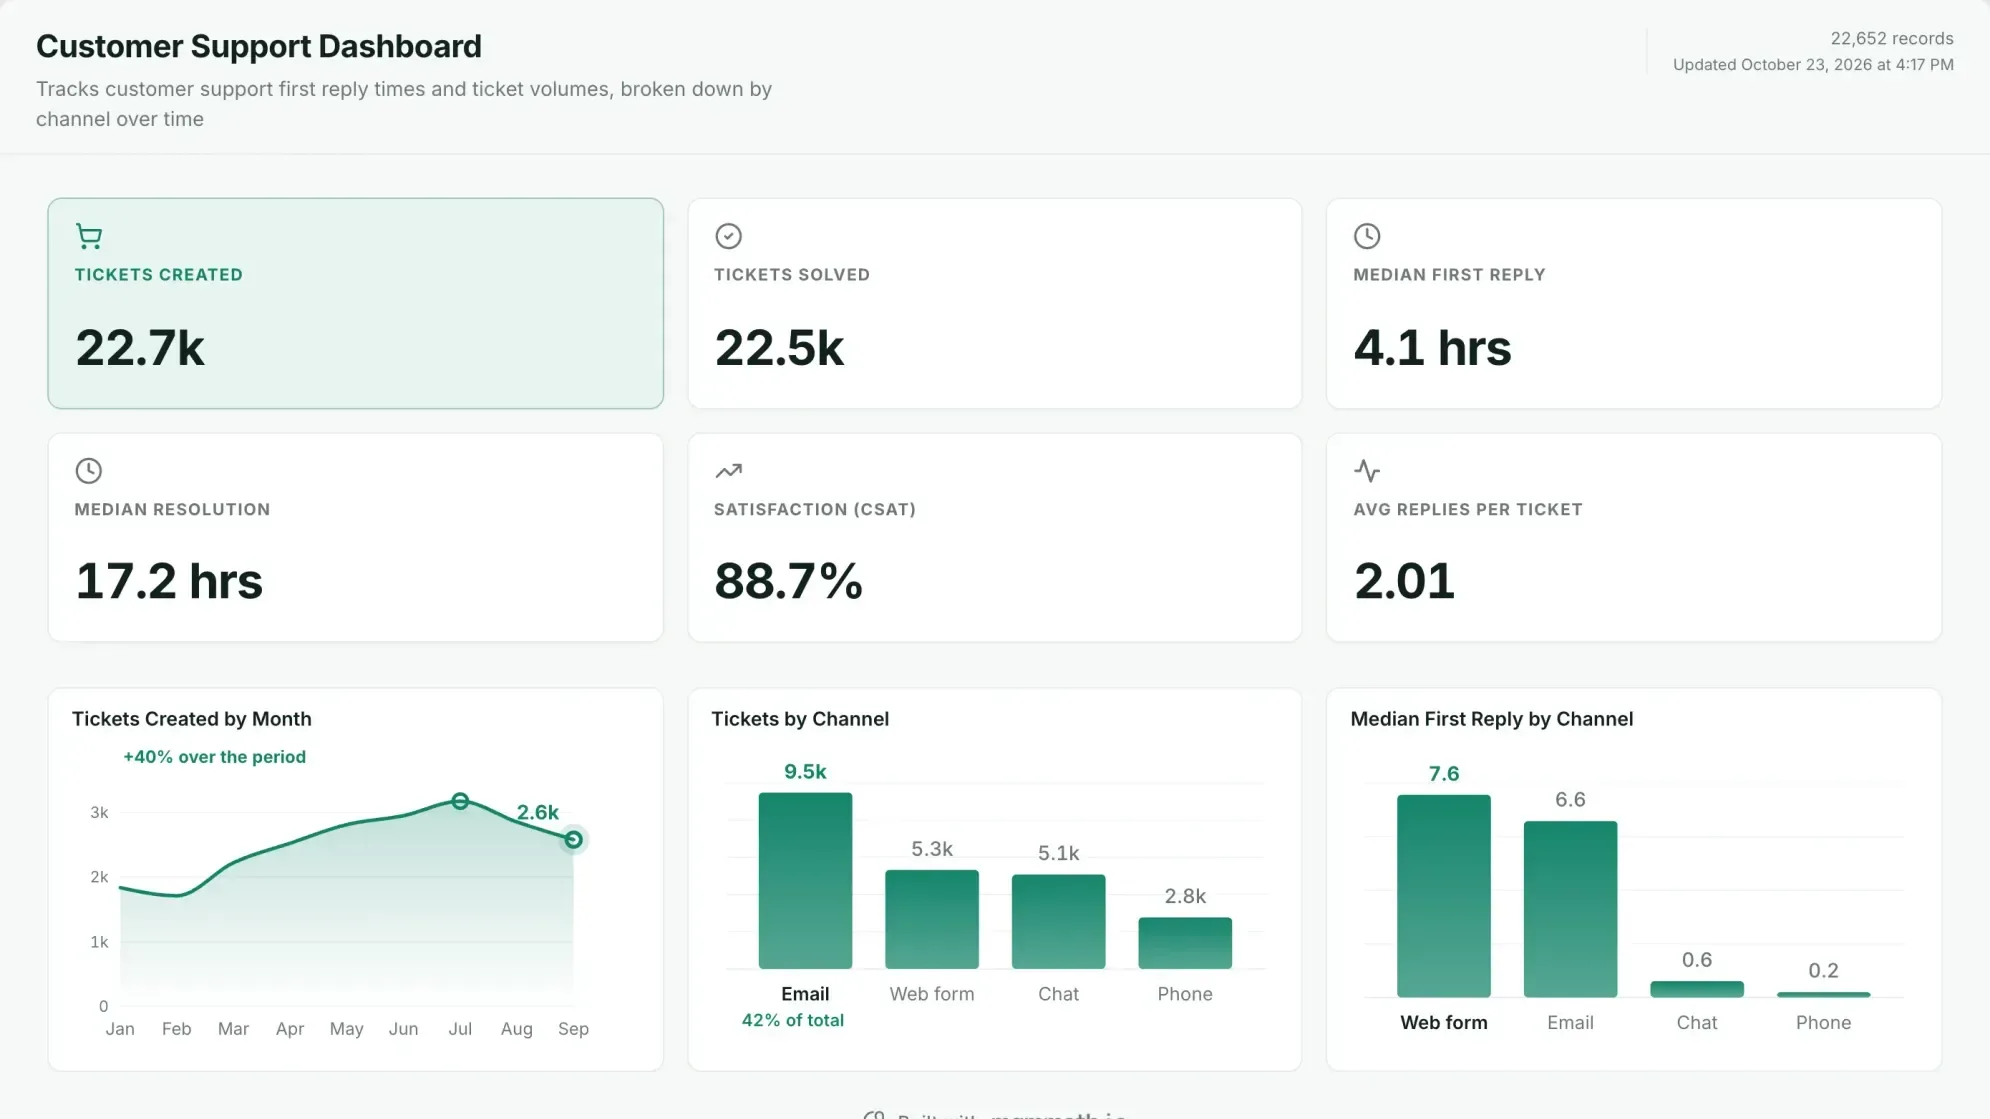
Customer support operations dashboard
Are customers hearing back fast enough, and is the queue keeping up?
Tickets in against tickets solved, how long a customer waits for the first reply and for a fix, and how they rated it, cut by channel. The times are medians, because a few tickets that wait for days drag an average past what most customers saw. Reply time by channel is the chart an operations lead acts on: it says which queue to staff before the backlog says it for them.
What is on it
- Tickets created
- Tickets solved
- Median first reply
- Median resolution
- Satisfaction (CSAT)
- Average replies per ticket
- Tickets created by month
- Tickets by channel
- Median first reply by channel
Your data needsDashboard
- a help desk ticket export
- created date, status and channel
- reply times and a satisfaction rating
Sample data: illustrative figures, not business results. Cropped; the dashboard continues below. Example 03· Template: Fulfilment & Returns
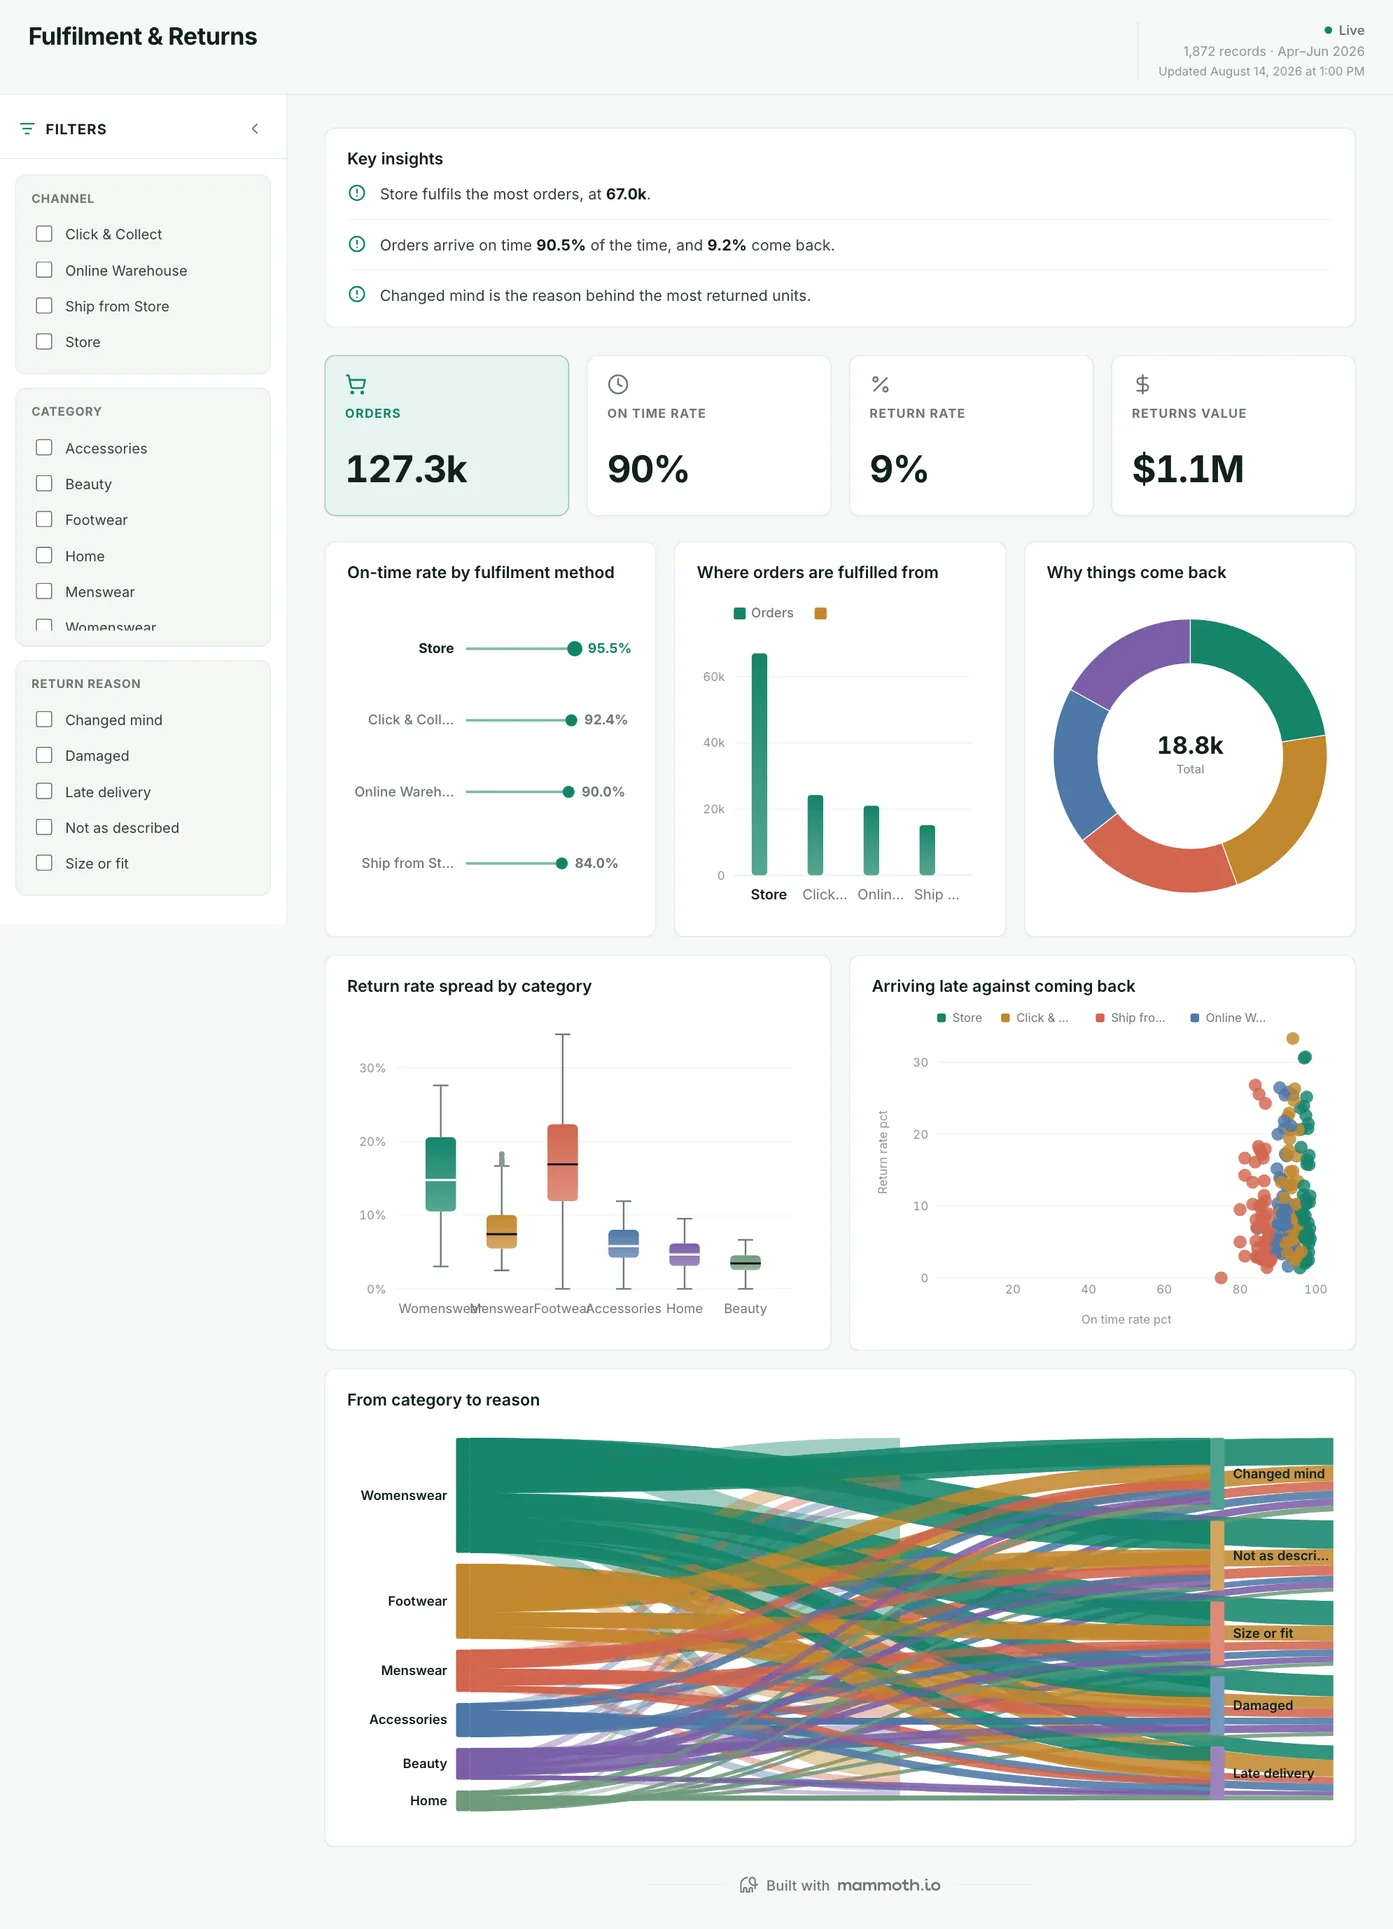
Order fulfilment dashboard
Are orders going out on time, and what comes back?
On-time rate by fulfilment method, where the orders ship from, and return rate by category, with lateness plotted against returns. For an operations team the useful cut is by method and origin: the late orders are rarely spread evenly, and the chart says which route or location to fix first.
What is on it
- On-time rate by fulfilment method
- Where orders are fulfilled from
- Why things come back
- Return rate spread by category
- Arriving late against coming back
- From category to reason
Your data needsDashboard
- a count column
- a category (~4 values)
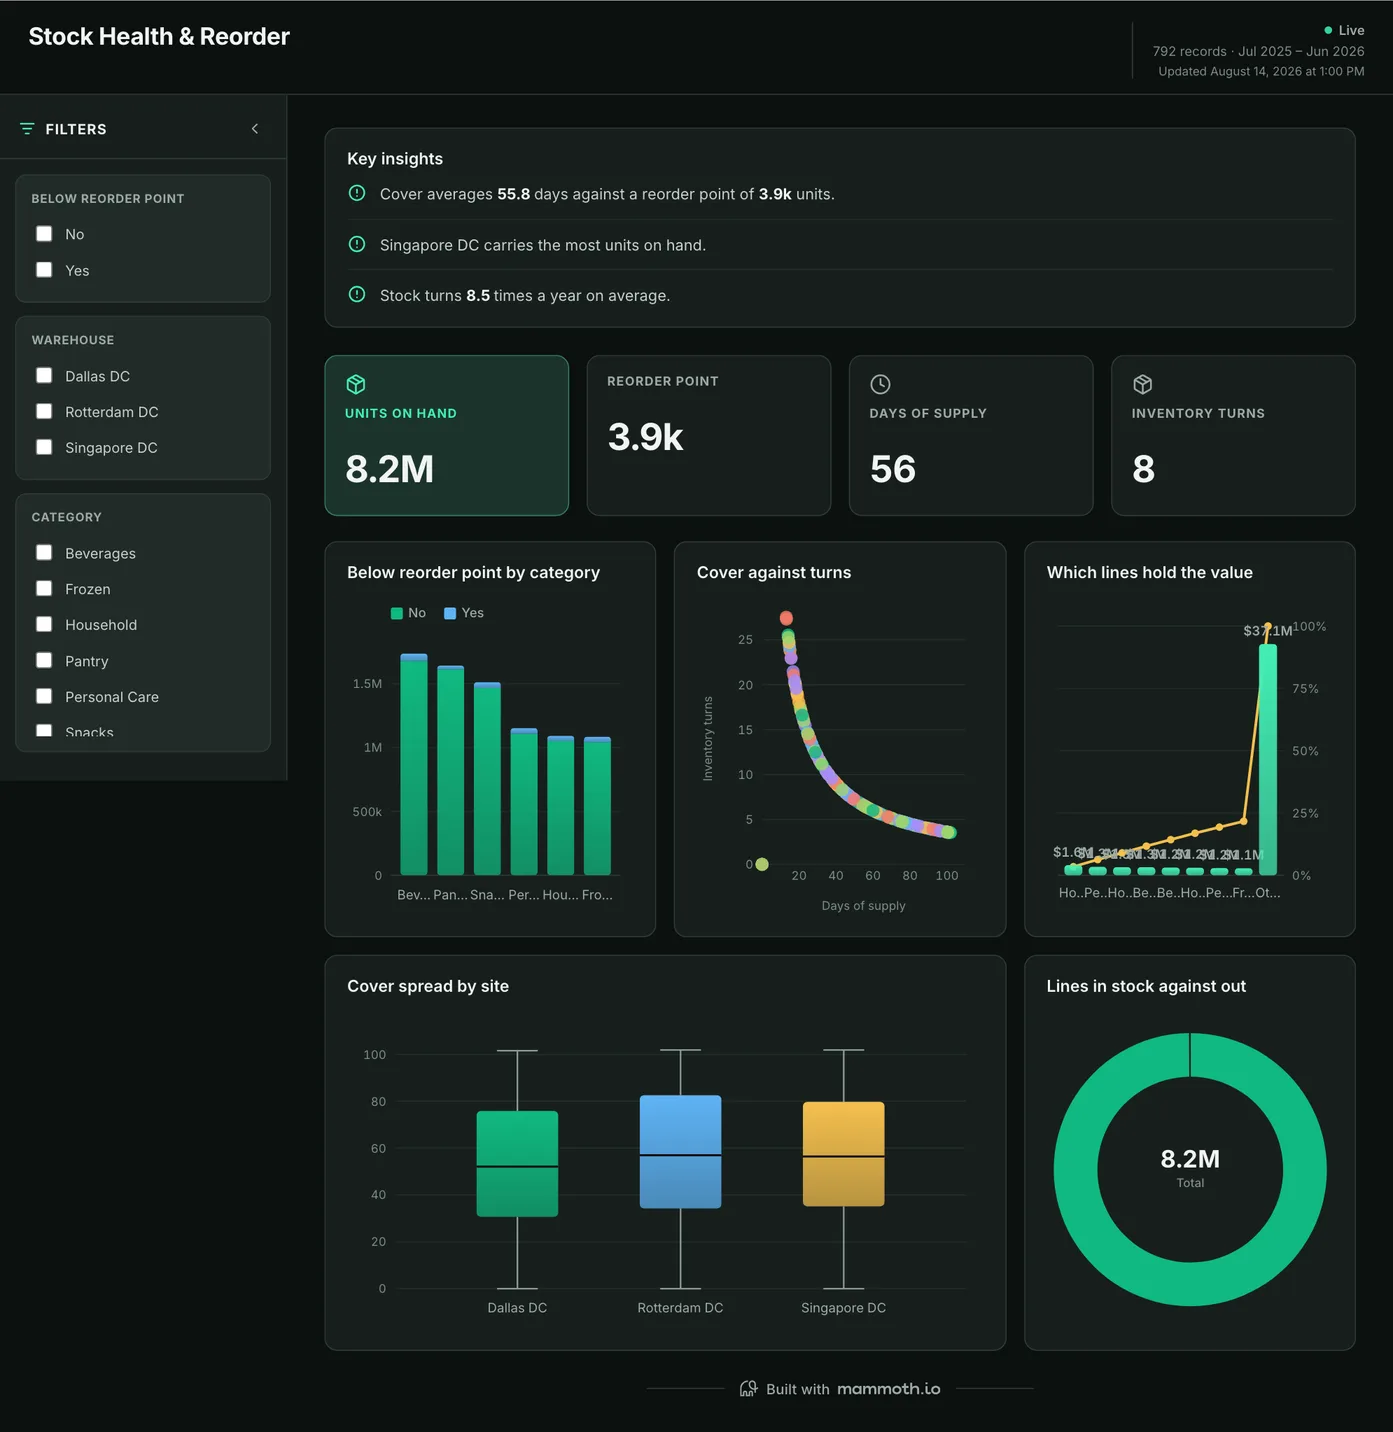
Sample data: illustrative figures, not business results. Example 04· Template: Stock Health & Reorder
Stock and reorder dashboard
What will stop the line or the shelf next?
Lines below their reorder point by category, cover against turns, and cover by site. Read from operations rather than finance, this is the supply side of the day: which items will run out before the next delivery, and whether the gap is a few lines or a pattern across a site.
What is on it
- Below reorder point by category
- Cover against turns
- Which lines hold the value
- Cover spread by site
- Lines in stock against out
Your data needsDashboard
- a count column
- a category (~2 values)
Sample data: illustrative figures, not business results. Example 05· Template: Store Comparison & Like-for-Like
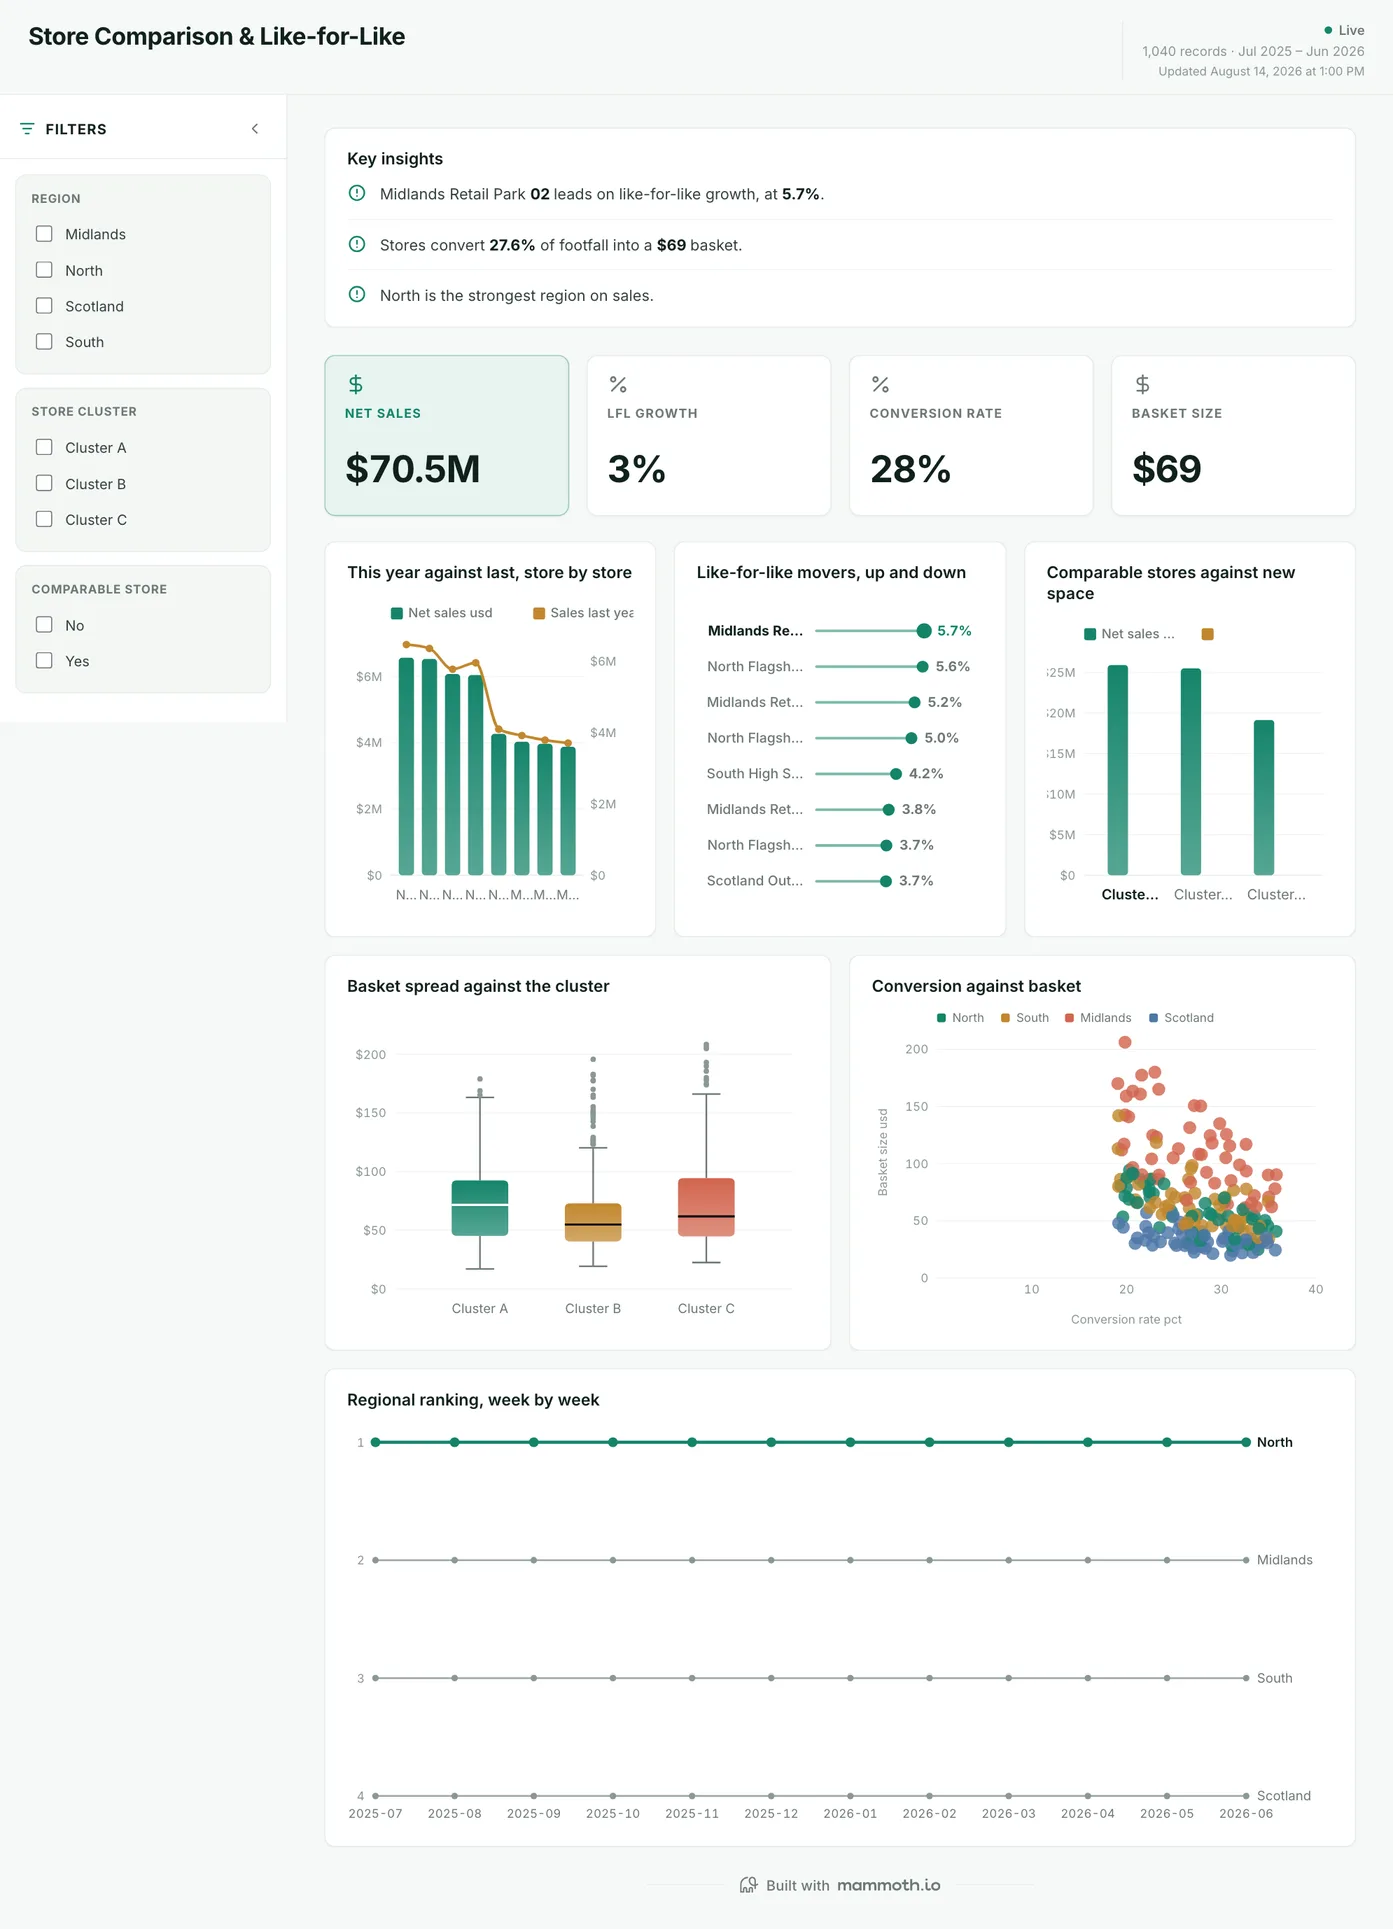
Store operations dashboard
Which locations run well, once you compare like with like?
Every location against its own result a year earlier, with new sites separated out so expansion does not pass for improvement. Conversion is set against basket for each one, which is the operations reading: a location can fall behind on footfall it served badly or on customers it never saw, and those call for different fixes.
What is on it
- This year against last, store by store
- Like-for-like movers, up and down
- Comparable stores against new space
- Basket spread against the cluster
- Conversion against basket
- Regional ranking, week by week
Your data needsDashboard
- a revenue or money column
- a category column
Sample data: illustrative figures, not business results. Example 06· Template: Spend & Vendor Concentration
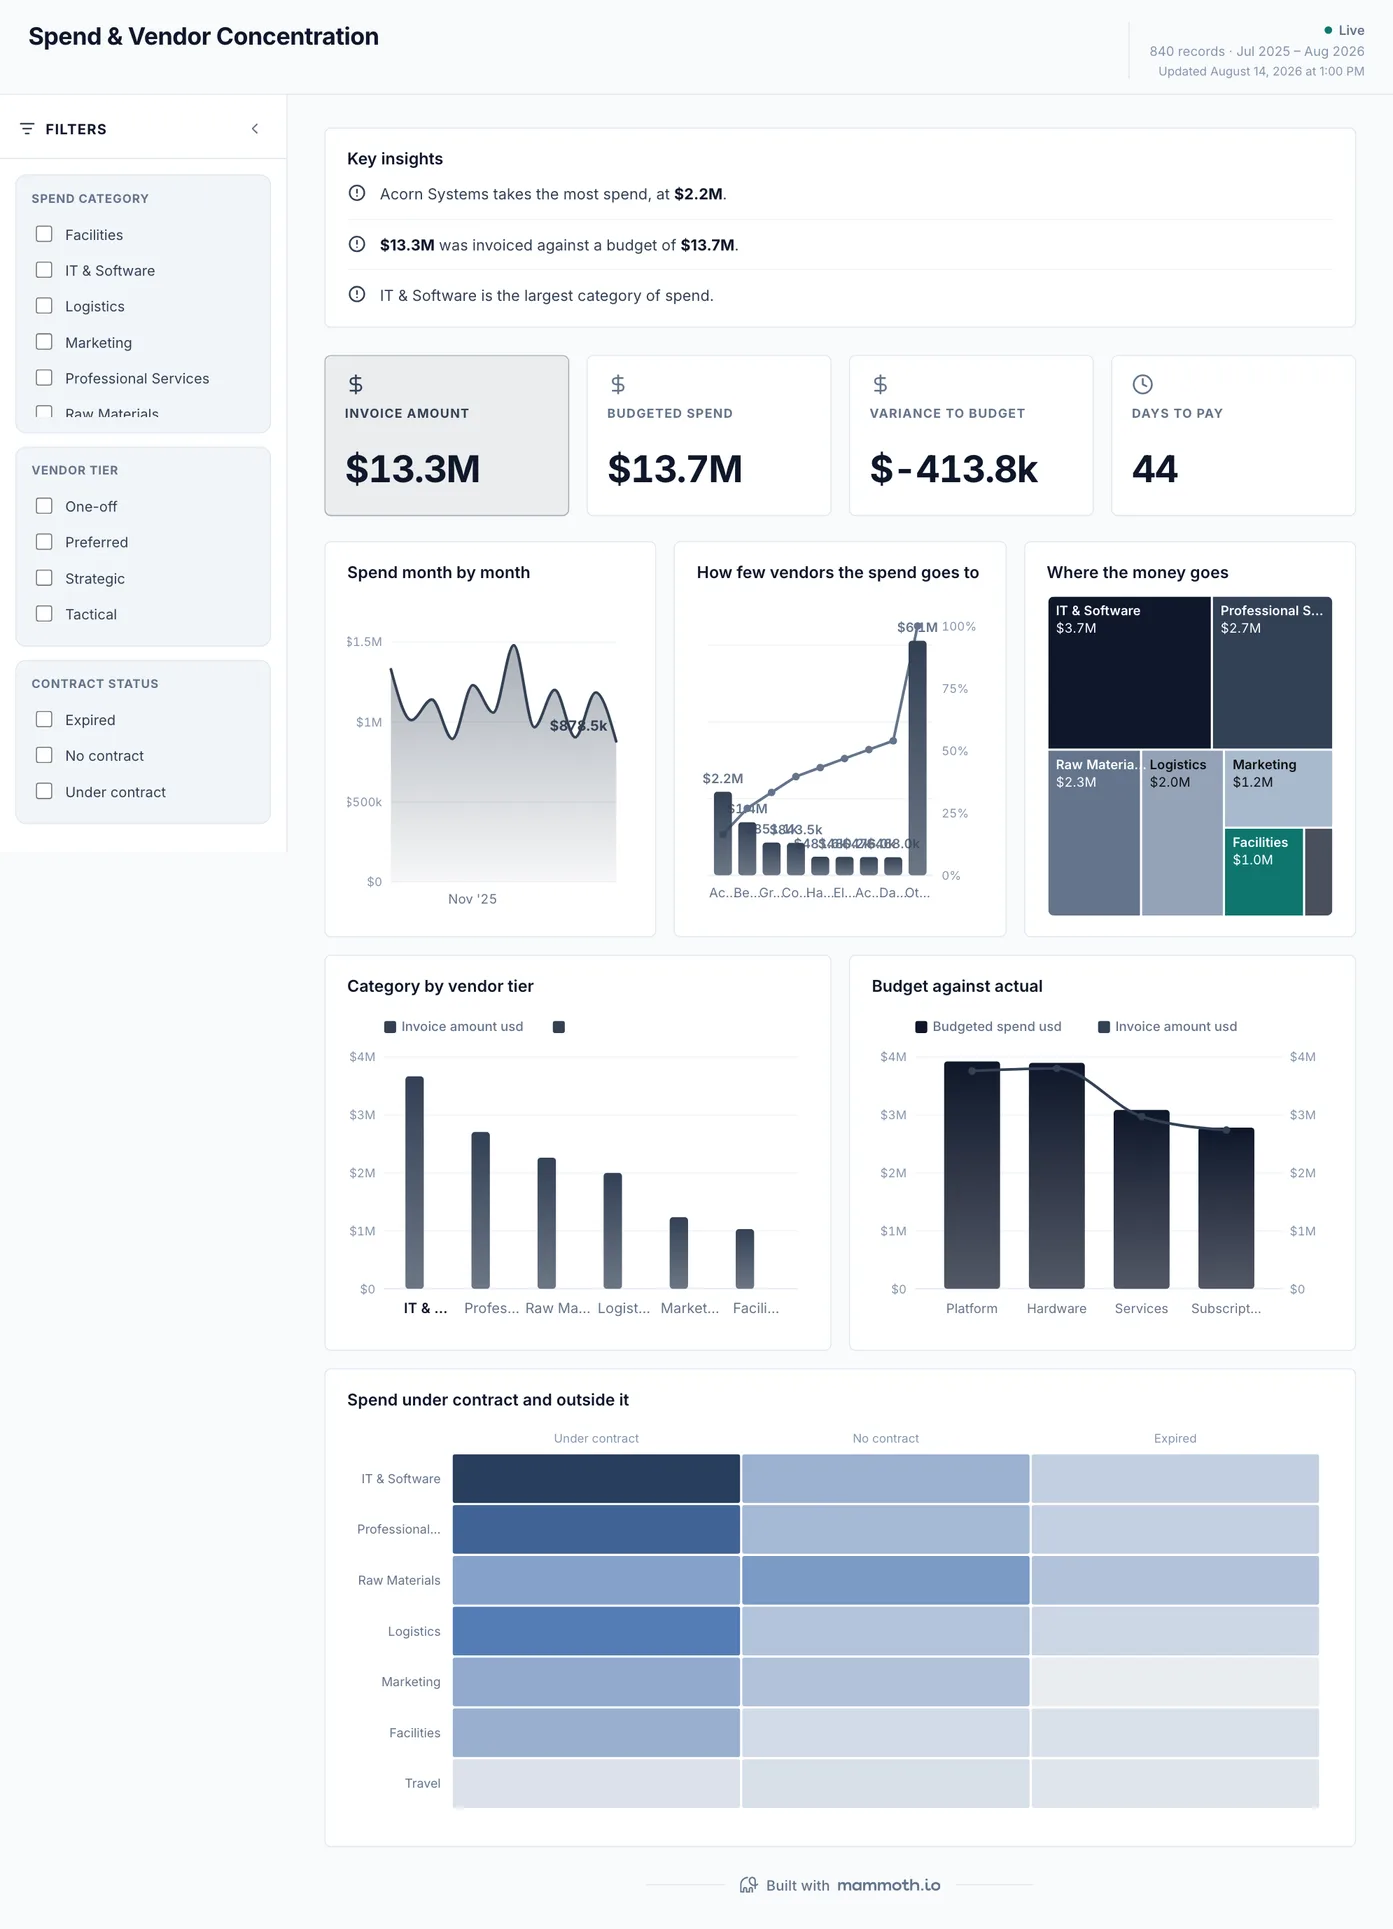
Procurement dashboard
Who do we depend on, and how much do we buy outside contract?
Spend by month against budget, how few suppliers carry most of it, and the share bought outside contract. For operations the concentration curve is a supply risk before it is a cost one: when three vendors carry most of the spend, one late shipment from any of them shows up on every other board on this page.
What is on it
- Spend month by month
- How few vendors the spend goes to
- Where the money goes
- Category by vendor tier
- Budget against actual
- Spend under contract and outside it
Your data needsDashboard
- a revenue or money column
- a category column
Sample data: illustrative figures, not business results.
The metrics
The metrics an operations dashboard is built from
Ten numbers, and most of them turn on a definition agreed before the chart: when an order is late, which date starts the clock, and what counts as a stockout.
| Metric | What it answers | What your data needs |
|---|---|---|
| On-time delivery rate | What share of orders arrive when we said they would? | A promised date and a delivered date per order. Measuring against the dispatch date instead of the promise makes every carrier delay invisible. |
| Order cycle time | How long does an order take from placed to delivered? | Timestamps for each stage, recorded in one time zone. Averages hide the long tail, so show the spread or the slowest tenth alongside the mean. |
| Throughput | How much work goes out of each site per day? | Units or orders despatched per site and day, counted the same way everywhere. One site counting lines and another counting units makes the comparison meaningless. |
| Backlog | How much work is waiting, and is the queue growing? | Intake and output over the same window, per site. Output alone looks healthy while the queue behind it doubles. |
| Median first reply time | How long does a customer wait to hear back? | A created time and a first public reply time per ticket, in business hours or clock hours but not a mix. Use the median: a few tickets left over a weekend pull an average past what most customers saw. |
| Fill rate | What share of orders ship complete, first time? | Ordered and shipped quantities per order line. A backorder that ships complete a week later is still a miss on the day it was due. |
| Return rate | How much of what goes out comes back, and why? | Returns matched to the original order, with a reason code. Returns counted against the month they arrive rather than the month they shipped make a good month look bad. |
| Stockout rate | How often is an item unavailable when it is needed? | Stock positions by item and location at a fixed time each day. A month-end snapshot misses the days an item ran out and was refilled. |
| Cost per order | What does it cost to get one order out of the door? | Labour, packing and shipping cost for the same period and site as the order count. Leave out labour and the cheapest site is the one with the most overtime. |
| Supplier concentration | How much of the operation depends on a few vendors? | Spend per vendor over twelve months with vendors de-duplicated. The same supplier under three names hides how dependent you are. |
From example to live dashboard
Pretty is easy. Current and true is the hard part.
Any of these can be drawn in a slide. What makes one worth keeping is the five steps underneath it, and they are the same five whichever example you start from.
- 01
Connect the source
The dashboard reads the system, not an export somebody saved to their desktop. 100+ tested connectors, plus anything with a REST API.
- 02
Prepare it once
Cleaning, joining and reshaping are recorded as steps you can read, change and re-run, not a formula buried three sheets deep.
- 03
Check it before anyone sees it
Data checks run with the refresh and flag the rows that fail, so a broken upstream file shows up as an alert rather than as a wrong number in a meeting.
- 04
Put it on a schedule
Refresh on a schedule and the dashboard stays current on its own. Starter refreshes weekly, Team daily, and Pro every three hours.
- 05
Publish it and send the link
Public, password-protected or sign-in only. Every sharing mode is available on every plan, including the free one.
Already have the data in a spreadsheet? Turn it into a dashboard with the AI dashboard generator.
Sharing
Everyone can see it.
Nobody pays to look.
Most dashboard tools charge for every person who opens one, which is why so many dashboards end up as a screenshot pasted into a message. Mammoth charges for the people who build. Viewers are unlimited and free on every plan, including the free one.
You pay for
The people who build
Anyone connecting a source, preparing data or publishing a dashboard counts as a platform user.
You never pay for
The people who look
Viewers are unlimited and free on every plan, including the free one. A board, a client list or a whole company: the number does not change the bill.
Plans differ in how many builders and published dashboards a workspace gets. Drafts, viewers and every sharing mode are unlimited and free on all four. Full pricing.
Operations dashboard questions
What should an operations dashboard show?
What KPIs should an operations dashboard track?
How do I build an operations dashboard?
- Connect the systems the work runs through: the order or warehouse system, the stock records, and the purchasing export.
- Agree the definitions once, such as when an order counts as late and which date starts the clock.
- Check a week of the numbers against what the floor reports before anyone relies on the board.
- Lead with exceptions, late orders by route and sites behind on despatch, and put the totals second.
- Put the preparation on a schedule and share the link, so each site sees this morning's position rather than last week's export.
What is the difference between an operations dashboard and an executive dashboard?
Where does the operations data come from?
How often should it refresh?
Can every site and shift lead see it without a licence?
Last reviewed against the template catalogue.


Build the operations dashboard you actually need.
Connect a source, prepare it once, and publish. Everyone who needs to see it can, at no per-viewer cost.
- ✓ 14-day Pro trial
- ✓ No credit card
- ✓ Viewers always free